 Fourplex
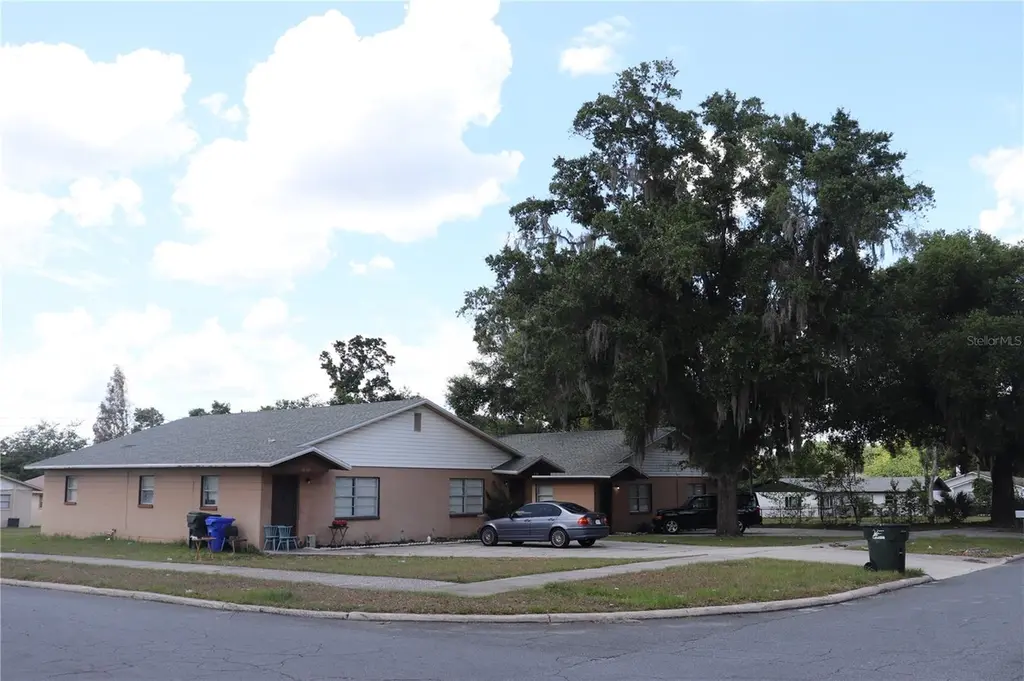
1102 Roselle Ave · Lakeland, FL
Flood risk 1/10 · Minimal
- FEMA flood zone
- X (unshaded)
- Chance of flooding over 30 yrs
- 0.0%
- Est. flood insurance / yr
- $507 – $1,088
Fire risk 1/10 · Minimal
- Est. fire insurance / yr
- $947 – $1,759
Heat risk 8/10 · Major
- Hot days now (above 108°F)
- 7 days/yr
- Hot days in 30 yrs
- 23 days/yr
Wind risk 9/10 · Severe
- Chance of severe wind over 30 yrs
- 99.0%
Air-quality risk 2/10 · Minimal
- Unhealthy air days now
- 1 days/yr
- Unhealthy air days in 30 yrs
- 1 days/yr
Risk factors via First Street. Map © Google.
Why this score? — see what drove the D grade
The composite is a weighted blend of 9 inputs, each scored 0–100. Each bar is that input's sub-score; the figure is the points it added to the 100-point composite (weight × sub-score).
- Cash flow +13.4/30.0
- ARV discount +7.5/15.0
- DSCR +4.0/10.0
- Livability +3.9/5.0
- 1% rule +3.6/10.0
- Schools +3.5/10.0
- Rent growth +2.7/5.0
- Condition / age +2.5/5.0
- Appreciation +0.0/10.0
$595,000
🖨 Deal sheet 📄 Offer letter ✓ Due diligence
Multi-family units
County records classify this as Multi-Family (2-4 Unit). Listing-text estimate: 4 units. confirmed
Listing remarks MLS
Fantastic investment opportunity! With the shortage of rental inventory, this property brings four individual units all on the same parcel of land for easy maintenance and management! Each unit is a two bedroom, one bathroom with a great internal layout. The living room and dining room are open concept and the kitchen is easily accessible, not separating the cook in the house from the living area. Ample cabinet and counter space in each of the four units makes it a great layout. While they're in need of TLC and updating, the return on investment is spectacular. Whether you're looking to grow your rental portfolio or just starting, four easily managed units can start generating revenue quickly. Setup a showing to look at the vacant units, make renovation plans, and start earning money today!
Key facts
- Laundry rooms
- New roof
- Re-piped plumbing
Tags
Property features AI
Finance
- Other: Zoned RB-1; Lot about 0.37 acre (approx. 120 x 136); Living area reported as 3,948 sq ft (public records)
- Financial info: Gross income reported: $5,520; Annual net income reported: $5,520; No lease restrictions reported
- HOA & community: No association fees or HOA
Exterior
- Parking: Each unit includes garage spaces (units report 2 garage spaces each)
- Utilities: Public water; Public sewer; Public utilities
- Home design: Residential income property (quadruplex); One level; Two buildings on the property
- Construction: Block and concrete construction; Shingle roof; Slab foundation; Built as multi-unit (quadruplex)
- Exterior features: Sidewalk
Interior
- Bedrooms: 8 total bedrooms
- Flooring: Ceramic tile
- Bathrooms: Multiple bathrooms (total count varies by unit)
- Heating & cooling: Central heating; Central air conditioning
- Interior features: Thermostat; Walk-in closets
- Laundry & utility: Inside laundry room
Neighborhood map
What this means for you Summary
Snapshot
- This is a 4 × 2-bed/1.0-bath units multifamily listed at $595k.
Deal economics
- At list price, monthly cash flow is $9 ($107/yr) — positive. Per door: $2/mo.
- The deal already cash-flows at list — no discount required.
- To meet the 1% rule (rent ≥ 1% of price), the offer needs to be $509k (14.4% below list).
- Recommended offer: $509k (14.4% below list) — sets the bar for 1% rule.
Location & tenants
- Location reads 77/100 on livability (#206 in FL, #3,179 nationally) — a middle-class / working-renter tenant base. Strengths: cost of living A+, housing A+, health & safety A+; Watch: employment D+, amenities F, commute F.
- Polk (suburban): math 39% / reading 43% proficiency, ranked #62 of 73 in FL (top 85%) — families likely to look elsewhere, expect single-tenant / working-renter base with shorter leases.
- Market conditions: Rents flat; 162 active listings in the ZIP; 6 comparable units currently listed for rent nearby; rentals at typical pace (median 24d on market — plan ~3-4 weeks tenant-placement turnaround); 10,384 units permitted in Polk County in 2024 (1,716 in 5+ unit buildings).
- At $5,094/mo this rent would consume 98% of the median local household income ($63k/yr) (locally 1179% of renters already pay >50% of income on rent) — very limited rent-growth headroom before tenants either downsize or default.
Forward outlook
- Local home prices are declining (-3.0%/yr); year-one equity from $4k of loan paydown is wiped out by about $18k of value loss. Plan a longer hold.
- Polk County population projected at +33% by 2050 — long-run rental-demand tailwind backs the buy-and-hold thesis.
Negotiation context
- Only 8 days on market — expect competitive offers; lowballing is unlikely to land.
- 4 sale attempts since 13y ago with the ask held roughly flat each time — persistent listings suggest the price (not the market) is what's stuck; bring a comps-based counter.
- Current owner paid $500k; 19% above their basis — modest negotiation headroom, anchor on the comps not their cost.
Risks & watch-outs
- Climate carrying-cost: severe wind risk, 99% chance of damaging wind over 30y; extreme-heat days projected 7→23/yr by 2055 (HVAC capex compounding) — expect insurance premiums to compound above CPI over the hold.
Questions for the listing agent
- Can we see the unit-by-unit rent roll, current vacancy, and any below-market leases? What's the average tenancy length?
- What capital expenditures (roof, boiler, parking lot, exteriors) have been made in the last 5 years, and what's planned in the next 2?
- Built in 1973 — when were the roof, HVAC, electrical panel, plumbing, and water heater last replaced?
- Is there a deadline driving the sale (1031 exchange, divorce, estate, relocation)? That informs how much negotiation room exists.
- The area grade is low — what's the realistic commute time and amenity access for the typical tenant pool here? Any planned neighborhood developments (good or bad) we should know about?
- What's the average days-on-market for RENTAL listings here right now (not sales)? A rising rental-DOM trend means longer vacancies and softer asking-rent achievability than the comps imply.
- What's the recent tenant-quality profile in this submarket — average credit score on applications, eviction rate, late-payment / NSF rate, and stable-employment percentage? A property-management company in the area should have these aggregated.
- How much new apartment / multifamily construction is in the pipeline within 1–3 miles? Heavy new supply (>2% of stock underway) typically softens rents 12–24 months out; light construction supports rent growth.
Investment metrics
- 1% rule
- 0.86% ✗
- Cap rate
- 6.31%
- Cash-on-cash
- 0.06%
- DSCR
- 1.00
- GRM
- 9.7
CMA / ARV
No comps found within radius.
Projected returns pro-forma
-3.0% appreciation · 0.77% rent growth · sell at horizon
- IRR
- -18.7%
- Equity multiple
- 0.36×
- Total profit
- $-107,011
- Equity at exit
- $88,716
- IRR
- -16.2%
- Equity multiple
- 0.18×
- Total profit
- $-136,254
- Equity at exit
- $51,445
Cash invested: $166,600 (down + closing). Projections, not guarantees.
Landlord ↔ Tenant lean methodology
- Overall (STATE)
- 87 Strongly Landlord-Friendly
- State Florida
- 87 Strongly Landlord-Friendly · R+3
- County
- — inherits STATE
- City
- — inherits STATE
ZIP-level market 33805
- Home prices YoY
- -29.8%
- Rents YoY
- 0.8%
- Active inventory
- 162
- Price-to-rent
- 38.9×
Monthly cashflow live
- Estimated rent
- $5,094 medium interval (Pro) →
- Mortgage (P&I)
- −$3,120
- Tax from tax record
- −$647 /mo · $7,766/yr
- Insurance
- −$248
- HOA
- −$0
- Vacancy / Maint / Mgmt
- −$1,070
- Net cashflow
- $9
Break-even live
4-unit breakdown (identical units grouped — click to expand)
| Units | Beds | Baths | Est. rent |
|---|---|---|---|
| 4× units | 2 | 1 | $5,096 |
| #1 | 2 | 1 | $1,274 |
| #2 | 2 | 1 | $1,274 |
| #3 | 2 | 1 | $1,274 |
| #4 | 2 | 1 | $1,274 |
| Total (4 units) | $5,094 | ||
UW: 25.0% down · 7.5% · 30yr · 1.5% tax · 5.0% vac · 8.0% maint · 8.0% mgmt
Financing live
Cash to close
- Down payment
- $148,750
- Closing costs
- $17,850
- Reserves months
- —
- Total cash needed
- —
Loan-product check · same deal, 3 products live
Conventional
25% down · 7.5% · 30yr
- Down + closing
- —
- Monthly P&I
- —
- Monthly cashflow
- —
- DSCR
- —
- Eligible?
- —
Personal DTI + credit; lowest rate.
DSCR
20% down · 8.5% · 30yr
- Down + closing
- —
- Monthly P&I
- —
- Monthly cashflow
- —
- DSCR
- —
- Eligible?
- —
No personal income docs; deal must DSCR.
Hard money
10% down · 12.0% · 12mo
- Down + closing
- —
- Monthly P&I
- —
- Monthly cashflow
- —
- DSCR
- —
- Eligible?
- —
Short-term bridge; refi at stabilization.
Rent comps 6 comps
| Address | Beds | Baths | Sqft | Rent | $/sqft | DOM | Units | Dist |
|---|---|---|---|---|---|---|---|---|
| 1128 Neville Ave Lakeland, FL | 3.0 | 2.0 | 1245 | $1,900 | $1.53 | 14d | 1 | 0.11mi |
| 2340 Shasta St Lakeland, FL | 3.0–5.0 | 2.0–3.0 | 2098 | $2,185 | $1.04 | 3d | 3 | 0.76mi |
| 1335 W Walnut St Lakeland, FL | 3.0 | 2.0 | 1626 | $1,800 | $1.11 | 3d | 1 | 1.26mi |
| 2480 Chestnut Woods Dr Lakeland, FL | 3.0 | 2.0 | 2440 | $1,300 | $0.53 | 23d | 1 | 1.35mi |
| 1615 N New York Ave Lakeland, FL | 2.0 | 1.0 | 1300 | $1,195 | $0.92 | 23d | 1 | 1.37mi |
| 1238 Herschell St Lakeland, FL | 2.0 | 1.0 | 1323 | $1,300 | $0.98 | 23d | 1 | 1.40mi |
Listing history 6 events
-
2026-06-18days on market $595,000 Active 8 DOM
-
2026-06-17days on market $595,000 Active 7 DOM
-
2026-06-16days on market $595,000 Active 6 DOM
-
2026-06-15days on market $595,000 Active 5 DOM
-
2026-06-13remarks 699-char remark
-
2026-06-13$595,000 Active 3 DOM
ⓘ Source: listings_history table (triggers on properties + properties_extension) + one-shot
backfill from property_details.listing_events for pre-trigger history.
Tax reassessment forecast FL · Resets to sale price
- Current annual tax
- $7,766 · $647/mo
- Projected year-2 tax
- $7,766 · $647/mo
- Expected delta
- $0/yr ($0/mo · 0.0%)
ⓘ Screening estimate from a state-policy table — verify with the county assessor before closing.
Climate risk First Street
- Flood 1/10 Low FEMA zone X (unshaded) · 0% chance over 30 yrs
- Wildfire 1/10 Low
- Heat 8/10 Severe 7 d/yr ≥108°F today · 23 d/yr by 30 yrs out
- Wind 9/10 Extreme 99% chance of damaging wind over 30 yrs
- Air quality 2/10 Low 1 unhealthy d/yr today · 1 by 30 yrs out
Nearby sold comps map
Loading sold comps map…
Walkable amenities ~0.75 mi
Loading nearby amenities…
Taxation est. · year 1
- Rental income
- $61,128
- − Mortgage interest
- −$33,329
- − Property taxes
- −$7,766
- − Insurance
- −$2,975
- − Repairs & maintenance
- −$4,890
- − Management
- −$4,890
- − Depreciation
- −$17,309
- Taxable loss
- −$10,032
- Est. tax savings @ 24.0%
- +$2,408
- After-tax cash flow
- $2,515/yr
For passive investors: Depreciation is non-cash, so a rental often shows a tax loss while cash-flowing — sheltering income. Rental losses are passive: they offset passive income freely, and up to $25,000/yr can offset ordinary (W-2) income if you actively participate and your MAGI is under $100k (phasing out to $0 by $150k); unused losses carry forward. On sale, claimed depreciation is recaptured at up to 25%, and gains may owe capital-gains tax (a 1031 exchange can defer both). Figures are a year-1 estimate at your 24.0% rate — not tax advice; consult a CPA.
Schools (NCES district)
- District
- Polk
- NCES district ID
- 1201590
- Math proficiency
- 39% ▼ -11.00%
- Reading proficiency
- 43% ▼ -4.00%
- Median HH income
- $43,979
- Composite
- 34.74/100
- National rank
- #5132
- State rank
- #62 of 73 in FL
Livability — Lakeland
- Score
- 77/100
- State rank
- #206
- US rank
- #3179
Category grades
Schools grade is shown separately in the Schools card above.
Census & demographics
- Census place
- Lakeland, FL
- County
- Polk County · 740,051 people
- City population
- 277,690
- Metro
- Lakeland-Winter Haven, FL
- Population (ZIP)
- 28,751
- Household income
- $62,661
- Rent vs Own
- Severe rent burden
- 1179.0
Population outlook (Polk County) Hauer SSP2
- Today (2025)
- 752,975 people
- By 2030
- 804,621 · +6.9%
- By 2040
- 906,117 · +20.3%
- By 2050
- 1,000,476 · +32.9%
- By 2075
- 1,197,520 · +59.0%
- By 2100
- 1,271,518 · +68.9%
Race, ethnicity, and origin ACS 2023
- Neighborhood character
- Diverse neighborhood (Simpson 0.68)
- Race & ethnicity
- White 38% Black 37% Hispanic / Latino 20% Two or more races 8% Asian 1%
- Hispanic origin (detail)
- Mexican 5% Puerto Rican 9% Cuban 2%
- Common ancestry
- Hispanic 2% Lithuanian 1% Romanian 1%
- Foreign-born
- 12% · Canada, Jamaica
- Languages at home
- 79% English-only · Spanish 16% French/Haitian/Cajun 2% Other Asian/Pacific 1%
Political lean MEDSL · Polk
- 2024 margin
- Strong R (+20.7) · D 39.2% · R 59.9%
- 2008→2024 swing
- -14.6pp toward R · 2008: -6.1pp · 2024: -20.7pp
- All cycles
- 2024: R+20.7 2020: R+14.4 2016: R+14.1 2012: R+6.8 2008: R+6.1
Not yet ingested
- Civics
- —
Market trends
- HPI YoY
- ▼ -158.44%
- Current HPI
- 372.7317
- Rent YoY
- ▲ 0.77%
- Metro
- Lakeland-Winter Haven, FL
- State GDP YoY
- ▲ 3.28%
- F500 in state
- 36
Industry mix (Fortune 500 HQ in FL)
| Industry | F500 HQs | Revenue |
|---|---|---|
| Industrial Technology | 2 | $29B |
|
||
| Insurance | 2 | $17B |
|
||
| Retail | 1 | $60B |
|
||
| Technology Distribution | 1 | $58B |
|
||
| Homebuilding | 1 | $35B |
|
||
| Technology Manufacturing | 1 | $35B |
|
||
Price history
+1316.7% since first listed12 events — show timeline
- 2026-06-09 Listed $595,000 Stellar MLS as Distributed by MLS Grid
- 2022-08-17 Sold (Public Records) $500,000 Public Records
- 2022-08-16 Sold (MLS) $500,000 Stellar MLS as Distributed by MLS Grid
- 2022-06-25 Pending — Stellar MLS as Distributed by MLS Grid
- 2022-06-16 Listed $550,000 Stellar MLS as Distributed by MLS Grid
- 2014-05-01 Sold (Public Records) $122,000 Public Records
- 2014-04-30 Sold (MLS) $122,000 Stellar MLS as Distributed by MLS Grid
- 2014-04-23 Pending — Stellar MLS as Distributed by MLS Grid
- 2014-04-07 Relisted — Stellar MLS as Distributed by MLS Grid
- 2014-03-29 Listing Removed — Stellar MLS as Distributed by MLS Grid
- 2013-12-26 Listed $119,000 Stellar MLS as Distributed by MLS Grid
- 1973-01-01 Sold (Public Records) $42,000 Public Records
Property tax history
+13.0%/yrLatest (2025): $7,766 · +14.5% YoY. Source: county tax records.
Cash-flow waterfall
monthlySold comps — $/sqft
last 12 mo · ≤1 miLoading sold comps…