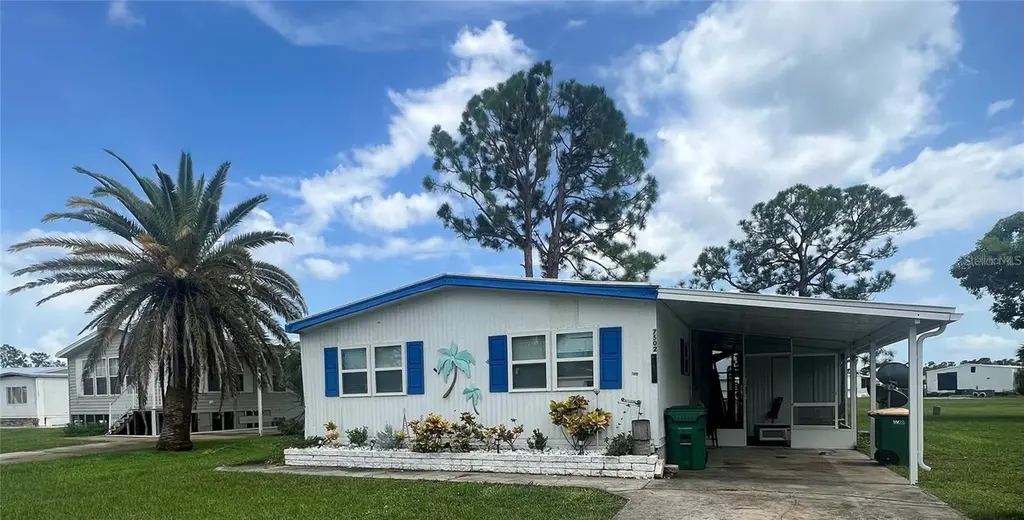
7502 Fulmar Ave · Rotonda, FL
Flood risk 9/10 · Severe
- FEMA flood zone
- AE
- Chance of flooding over 30 yrs
- 0.99%
- Est. flood insurance / yr
- $1,737 – $8,500
Fire risk 2/10 · Minimal
- Est. fire insurance / yr
- $947 – $1,759
Heat risk 10/10 · Severe
- Hot days now (above 107°F)
- 7 days/yr
- Hot days in 30 yrs
- 29 days/yr
Wind risk 10/10 · Severe
- Chance of severe wind over 30 yrs
- 99.0%
Air-quality risk 2/10 · Minimal
- Unhealthy air days now
- 1 days/yr
- Unhealthy air days in 30 yrs
- 1 days/yr
Risk factors via First Street. Map © Google.
Why this score? — see what drove the C+ grade
The composite is a weighted blend of 9 inputs, each scored 0–100. Each bar is that input's sub-score; the figure is the points it added to the 100-point composite (weight × sub-score).
- Cash flow +25.8/30.0
- DSCR +8.6/10.0
- 1% rule +8.4/10.0
- ARV discount +7.4/15.0
- Schools +4.6/10.0
- Rent growth +3.8/5.0
- Livability +3.4/5.0
- Condition / age +2.5/5.0
- Appreciation +0.0/10.0
$129,900
🖨 Deal sheet 📄 Offer letter ✓ Due diligence
Listing remarks
Welcome to easy Florida living in the sought-after Village of Holiday Lake. This fully furnished 2-bedroom, 2-bath home offers an open floor plan with a large kitchen island ideal for gathering and entertaining. Thoughtfully updated with new flooring, roof, A/C, and electrical panel, this home is move-in ready. The primary suite features double doors, perfect for golf cart access. Located just minutes from beaches, shopping, and dining, this vibrant community also includes pools, boat slips, tennis courts, and a recreation center.
Key facts
- Large kitchen island
- New flooring
- Double doors
Tags
Neighborhood map
What this means for you Summary
Snapshot
- This is a 2-bed/2.0-bath manufactured listed at $130k.
Deal economics
- At list price, monthly cash flow is $-111 ($-1k/yr) — negative.
- To cash-flow at today's rent, offer at most $110k (15.1% below list).
- Meets the 1% rule at list price ($2k rent vs $130k).
- Recommended offer: $110k (15.1% below list) — sets the bar for cash-flow.
- Cap rate 9.2% vs local median 3.1% in Rotonda — top-decile yield for the area; either an underpriced asset or a hidden risk that comps aren't pricing in. Stress-test before assuming the spread holds.
Location & tenants
- Location reads 67/100 on livability (#548 in FL) — a middle-class / working-renter tenant base. Strengths: crime A+, housing A-, cost of living B+; Watch: schools D, amenities F, commute F.
- Charlotte (suburban): math 54% / reading 54% proficiency, ranked #22 of 73 in FL (top 30%) — acceptable for families but not a draw, mixed tenant base, ~2y average lease.
- Market conditions: Rents rising fast (+5.3%/yr); 2188 active listings in the ZIP; 3 comparable units currently listed for rent nearby; rentals at typical pace (median 21d on market — plan ~3-4 weeks tenant-placement turnaround); solid renter incomes; 4,585 units permitted in Charlotte County in 2024 (703 in 5+ unit buildings).
Forward outlook
- Local home prices are declining (-3.0%/yr); year-one equity from $898 of loan paydown is wiped out by about $4k of value loss. Plan a longer hold.
- Charlotte County population projected at +24% by 2050 — long-run rental-demand tailwind backs the buy-and-hold thesis.
Negotiation context
- Only 7 days on market — expect competitive offers; lowballing is unlikely to land.
- 3 sale attempts since 2y ago with the ask held roughly flat each time — persistent listings suggest the price (not the market) is what's stuck; bring a comps-based counter.
- Current owner paid $41k; list at $130k implies a 217% gain — meaningful room to come down on a strong offer.
Risks & watch-outs
- Watch-outs: flood insurance adds $427/mo.
- Climate carrying-cost: in FEMA flood zone AE (mandatory federal flood insurance); severe wind risk, 99% chance of damaging wind over 30y; extreme-heat days projected 7→29/yr by 2055 (HVAC capex compounding) — expect insurance premiums to compound above CPI over the hold.
Questions for the listing agent
- What do current leases actually rent for vs. the listed asking? Can we see a recent rent roll and the last 12 months of T-12 income?
- What's the actual annual flood-insurance premium (NFIP or private), and is the property in a SFHA with mandatory coverage?
- What does the HOA fee cover, when was the last increase, and are there any pending special assessments or reserve-fund shortfalls?
- Is there a deadline driving the sale (1031 exchange, divorce, estate, relocation)? That informs how much negotiation room exists.
- Schools are D-rated, which usually means shorter tenancies and higher turnover. Who's the typical renter profile here, and what's been the actual vacancy rate?
- What's the average days-on-market for RENTAL listings here right now (not sales)? A rising rental-DOM trend means longer vacancies and softer asking-rent achievability than the comps imply.
- What's the recent tenant-quality profile in this submarket — average credit score on applications, eviction rate, late-payment / NSF rate, and stable-employment percentage? A property-management company in the area should have these aggregated.
- How much new for-sale + rental construction is in the pipeline within 1–3 miles? Heavy new supply typically softens prices + rents 12–24 months out; constrained supply supports both.
Investment metrics
- 1% rule
- 1.34% ✓
- Cap rate
- 9.21%
- Cash-on-cash
- 10.41%
- DSCR
- 1.46
- GRM
- 6.2
CMA / ARV
- ARV (on-the-fly)
- $129,600
- Comps found
- 2
Show comp detail 2 sales within ~0.75 mi
| Address | Dist | Beds/Ba | Sqft | Sold | Price | $/sf | Match |
|---|---|---|---|---|---|---|---|
| 7502 Fulmar Ave | 0.00mi | 2/2.0 | 960 (0%) | 1mo | $125,000 | $130 | 99 |
| 7321 Adana Ave | 0.32mi | 2/2.0 | 960 (0%) | 11mo | $130,000 | $135 | 76 |
Match score weights: distance 35% · size 25% · config 20% · recency 20%. Top-matched comps best support the ARV.
Projected returns pro-forma
-3.0% appreciation · 5.29% rent growth · sell at horizon
- IRR
- -17.8%
- Equity multiple
- 0.35×
- Total profit
- $-23,644
- Equity at exit
- $19,369
- IRR
- -3.7%
- Equity multiple
- 0.71×
- Total profit
- $-10,538
- Equity at exit
- $11,231
Cash invested: $36,372 (down + closing). Projections, not guarantees.
Landlord ↔ Tenant lean methodology
- Overall (STATE)
- 87 Strongly Landlord-Friendly
- State Florida
- 87 Strongly Landlord-Friendly · R+3
- County
- — inherits STATE
- City
- — inherits STATE
ZIP-level market 33981
- Home prices YoY
- -7.5%
- Rents YoY
- 5.3%
- Active inventory
- 2188
- Price-to-rent
- 6.2×
Monthly cashflow live
- Estimated rent
- $1,736 medium interval (Pro) →
- Mortgage (P&I)
- −$681
- Tax from tax record
- −$180 /mo · $2,163/yr
- Insurance
- −$54
- Flood insurance flood zone
- −$427 /mo · $5,118/yr
- HOA
- −$140
- Vacancy / Maint / Mgmt
- −$364
- Net cashflow
- $-111
Break-even live
UW: 25.0% down · 7.5% · 30yr · 1.5% tax · 5.0% vac · 8.0% maint · 8.0% mgmt
Financing live
Cash to close
- Down payment
- $32,475
- Closing costs
- $3,897
- Reserves months
- —
- Total cash needed
- —
Loan-product check · same deal, 3 products live
Conventional
25% down · 7.5% · 30yr
- Down + closing
- —
- Monthly P&I
- —
- Monthly cashflow
- —
- DSCR
- —
- Eligible?
- —
Personal DTI + credit; lowest rate.
DSCR
20% down · 8.5% · 30yr
- Down + closing
- —
- Monthly P&I
- —
- Monthly cashflow
- —
- DSCR
- —
- Eligible?
- —
No personal income docs; deal must DSCR.
Hard money
10% down · 12.0% · 12mo
- Down + closing
- —
- Monthly P&I
- —
- Monthly cashflow
- —
- DSCR
- —
- Eligible?
- —
Short-term bridge; refi at stabilization.
Rent comps 3 comps
| Address | Beds | Baths | Sqft | Rent | $/sqft | DOM | Units | Dist |
|---|---|---|---|---|---|---|---|---|
| 13900 San Domingo Blvd Port Charlotte, FL | 2.0 | 2.0 | 775 | $1,699 | $2.19 | 13d | 1 | 0.57mi |
| 13100 S McCall Rd Port Charlotte, FL | 2.0 | 2.0 | 832 | $1,300 | $1.56 | 21d | 1 | 1.29mi |
| 6628 Thorman Rd Port Charlotte, FL | 3.0 | 2.0 | 1116 | $1,800 | $1.61 | 21d | 1 | 1.48mi |
HOA detail
- Monthly dues
- $140 · $1,680/yr
- Likely covers
- electricpool
Listing history 13 events
-
2026-04-01status Pending
-
2026-03-24$129,900 Active
-
2026-01-07historical
-
2025-07-18$129,900 Active
-
2025-06-17price $129,900
-
2025-06-17historical
-
2025-05-17price $149,900
-
2025-01-27price $159,900
-
2024-12-01price $174,900
-
2024-12-01price $175,000
-
2024-06-17$189,900 Active
-
1995-05-17soldstatus $41,000
-
1980-01-01soldstatus $15,000
ⓘ Source: listings_history table (triggers on properties + properties_extension) + one-shot
backfill from property_details.listing_events for pre-trigger history.
Tax reassessment forecast FL · Resets to sale price
- Current annual tax
- $2,163 · $180/mo
- Projected year-2 tax
- $2,163 · $180/mo
- Expected delta
- $0/yr ($0/mo · 0.0%)
ⓘ Screening estimate from a state-policy table — verify with the county assessor before closing.
Climate risk First Street
- Flood 9/10 Extreme FEMA zone AE · 99% chance over 30 yrs
- Wildfire 2/10 Low
- Heat 10/10 Extreme 7 d/yr ≥107°F today · 29 d/yr by 30 yrs out
- Wind 10/10 Extreme 99% chance of damaging wind over 30 yrs
- Air quality 2/10 Low 1 unhealthy d/yr today · 1 by 30 yrs out
Nearby sold comps map
Loading sold comps map…
Walkable amenities ~0.75 mi
Loading nearby amenities…
Taxation est. · year 1
- Rental income
- $20,827
- − Mortgage interest
- −$7,276
- − Property taxes
- −$2,163
- − Insurance
- −$5,768
- − Repairs & maintenance
- −$1,666
- − Management
- −$1,666
- − HOA
- −$1,680
- − Depreciation
- −$3,779
- Taxable loss
- −$3,172
- Est. tax savings @ 24.0%
- +$761
- After-tax cash flow
- $-571/yr
For passive investors: Depreciation is non-cash, so a rental often shows a tax loss while cash-flowing — sheltering income. Rental losses are passive: they offset passive income freely, and up to $25,000/yr can offset ordinary (W-2) income if you actively participate and your MAGI is under $100k (phasing out to $0 by $150k); unused losses carry forward. On sale, claimed depreciation is recaptured at up to 25%, and gains may owe capital-gains tax (a 1031 exchange can defer both). Figures are a year-1 estimate at your 24.0% rate — not tax advice; consult a CPA.
Schools (NCES district)
- District
- Charlotte
- NCES district ID
- 1200240
- Math proficiency
- 54% ▼ -6.00%
- Reading proficiency
- 54% ▼ -1.00%
- Median HH income
- $44,864
- Composite
- 45.62/100
- National rank
- #2586
- State rank
- #22 of 73 in FL
Livability — Rotonda
- Score
- 67/100
- State rank
- #548
- US rank
- #10359
Category grades
Schools grade is shown separately in the Schools card above.
Census & demographics
- County
- Charlotte County · 196,994 people
- City population
- 10,490
- Metro
- Punta Gorda, FL
- Population (ZIP)
- 15,622
- Household income
- $84,098
- Rent vs Own
- Severe rent burden
- 105.0
Population outlook (Charlotte County) Hauer SSP2
- Today (2025)
- 198,646 people
- By 2030
- 210,507 · +6.0%
- By 2040
- 230,857 · +16.2%
- By 2050
- 247,148 · +24.4%
- By 2075
- 281,777 · +41.8%
- By 2100
- 293,609 · +47.8%
Race, ethnicity, and origin ACS 2023
- Neighborhood character
- Predominantly White (89%)
- Race & ethnicity
- White 89% Two or more races 4% Hispanic / Latino 4% Black 2% Asian 1%
- Common ancestry
- Romanian 4% Lithuanian 3% Italian 2%
- Foreign-born
- 6% · Canada
- Languages at home
- 96% English-only · Spanish 1% German/W. Germanic 1% Tagalog/Filipino 1%
Political lean MEDSL · Charlotte
- 2024 margin
- Solid R (+34.0) · D 32.7% · R 66.7%
- 2008→2024 swing
- -26.7pp toward R · 2008: -7.2pp · 2024: -34.0pp
- All cycles
- 2024: R+34.0 2020: R+26.6 2016: R+27.8 2012: R+14.3 2008: R+7.2
Not yet ingested
- Civics
- —
Market trends
- HPI YoY
- ▼ -28.09%
- Current HPI
- 346.5247
- Rent YoY
- ▲ 5.29%
- Metro
- Punta Gorda, FL
- State GDP YoY
- ▲ 3.28%
- F500 in state
- 36
Industry mix (Fortune 500 HQ in FL)
| Industry | F500 HQs | Revenue |
|---|---|---|
| Industrial Technology | 2 | $29B |
|
||
| Insurance | 2 | $17B |
|
||
| Retail | 1 | $60B |
|
||
| Technology Distribution | 1 | $58B |
|
||
| Homebuilding | 1 | $35B |
|
||
| Technology Manufacturing | 1 | $35B |
|
||
Price history
+766.0% since first listed13 events — show timeline
- 2026-04-01 Pending — Stellar MLS as Distributed by MLS Grid
- 2026-03-24 Listed $129,900 Stellar MLS as Distributed by MLS Grid
- 2026-01-07 Listing Removed — Stellar MLS as Distributed by MLS Grid
- 2025-07-18 Listed $129,900 Stellar MLS as Distributed by MLS Grid
- 2025-06-17 Price Changed $129,900 Stellar MLS as Distributed by MLS Grid
- 2025-06-17 Listing Removed — Stellar MLS as Distributed by MLS Grid
- 2025-05-17 Price Changed $149,900 Stellar MLS as Distributed by MLS Grid
- 2025-01-27 Price Changed $159,900 Stellar MLS as Distributed by MLS Grid
- 2024-12-01 Price Changed $174,900 Stellar MLS as Distributed by MLS Grid
- 2024-12-01 Price Changed $175,000 Stellar MLS as Distributed by MLS Grid
- 2024-06-17 Listed $189,900 Stellar MLS as Distributed by MLS Grid
- 1995-05-17 Sold (Public Records) $41,000 Public Records
- 1980-01-01 Sold (Public Records) $15,000 Public Records
Property tax history
+4.7%/yrLatest (2025): $2,163 · -14.1% YoY. Source: county tax records.
Cash-flow waterfall
monthlySold comps — $/sqft
last 12 mo · ≤1 miLoading sold comps…