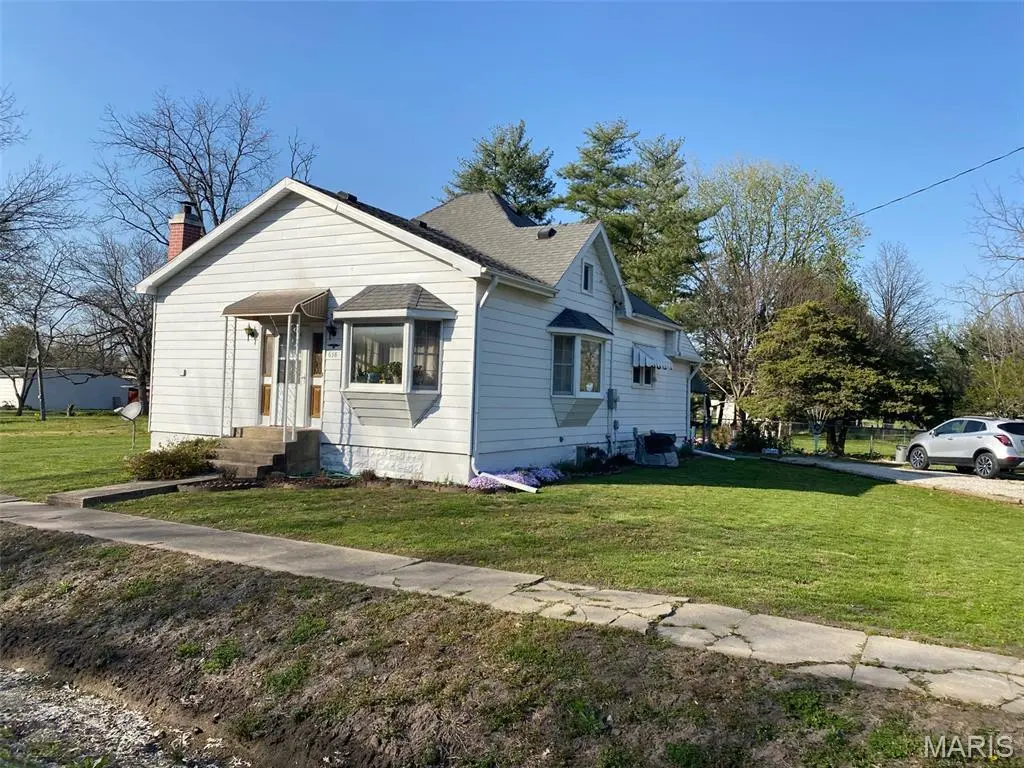
638 E Ford Ave · Witt, IL
Flood risk No data
- FEMA flood zone
- —
- Chance of flooding over 30 yrs
- —
- Est. flood insurance / yr
- —
Fire risk No data
- Est. fire insurance / yr
- —
Heat risk No data
- Hot days now (above threshold)
- —
- Hot days in 30 yrs
- —
Wind risk No data
- Chance of severe wind over 30 yrs
- —
Air-quality risk No data
- Unhealthy air days now
- —
- Unhealthy air days in 30 yrs
- —
Risk factors via First Street. Map © Google.
Why this score? — see what drove the C+ grade
The composite is a weighted blend of 9 inputs, each scored 0–100. Each bar is that input's sub-score; the figure is the points it added to the 100-point composite (weight × sub-score).
- Cash flow +30.0/30.0
- DSCR +10.0/10.0
- 1% rule +8.5/10.0
- Appreciation +6.0/10.0
- Livability +2.7/5.0
- Rent growth +2.5/5.0
- Condition / age +2.5/5.0
- Schools +2.4/10.0
- ARV discount +0.0/15.0
$73,500
🖨 Deal sheet (PDF) 📄 Offer letter ✓ Due diligence
Listing remarks MLS
Just listed, 2 bedroom home situated on the edge of town! It offers a dine-in kitchen, living room/dining room combination, 2 bedrooms and 1 full bath plus the unfinished basement. It is a great starter home with room to build on. City Water, Gas and Sewer. Gas furnace, CA and gas water heater.
Key facts
- Gas furnace
- Dine-in kitchen
- Sewer
Tags
Neighborhood map
What this means for you Summary
Snapshot
- This is a 2-bed/1.0-bath other listed at $74k.
Deal economics
- At list price, monthly cash flow is $277 ($3k/yr) — positive.
- The deal already cash-flows at list — no discount required.
- Meets the 1% rule at list price ($993 rent vs $74k).
- Recommended offer: $65k (12.0% below list) — sets the bar for market timing.
Location & tenants
- Location reads 54/100 on livability (#1,266 in IL) — a working-class tenant base; expect higher turnover. Strengths: cost of living A+, housing B; Watch: crime F, amenities F, commute F.
- Hillsboro CUSD 3 (town): math 20% / reading 36% proficiency, ranked #282 of 620 in IL (top 46%) — low school quality limits family demand, transient renter base, plan for 1-2y turnover.
- Zoned schools: Hillsboro Jr High School (math 18% / reading 41%, grade F, #256 of 665 statewide, top 41%, 345 students, 0% FRL); Hillsboro High School (math 12% / reading 17%, grade F, #479 of 693 statewide, top 71%, 468 students, 0% FRL) — zoned schools average 0% FRL vs 44% district-wide (44 pts lower); this property's tenant base skews higher-income than the district average.
- Market conditions: 6 active listings in the ZIP; 12 units permitted in Montgomery County in 2024 (0 in 5+ unit buildings).
Forward outlook
- In year one you build about $2k of equity ($508 loan paydown + $2k appreciation (2.1% local appreciation)).
- Montgomery County population projected at -20% by 2050 — secular population decline; favor cash flow + early exit over multi-decade hold.
- At projected returns (2.1% appreciation + 3.0% rent growth), your $21k cash investment doubles in ~4 years — after that, you're playing with house money.
Negotiation context
- It's been on market 186 days — a 12% lower offer ($65k) is reasonable based on typical stale-listing flexibility.
Risks & watch-outs
- Watch-outs: built in 1940 — expect roof / HVAC / electrical / plumbing capex.
Questions for the listing agent
- It's been on market 186 days. Have you received any prior offers? Is the seller open to a 12% concession, seller financing, or rate buy-down credit?
- Built in 1940 — when were the roof, HVAC, electrical panel, plumbing, and water heater last replaced?
- Why hasn't it sold? Are there any deal-killer items the seller is aware of (foundation, flood, title, zoning, code violations)?
- Is there a deadline driving the sale (1031 exchange, divorce, estate, relocation)? That informs how much negotiation room exists.
- Schools are F-rated, which usually means shorter tenancies and higher turnover. Who's the typical renter profile here, and what's been the actual vacancy rate?
- Crime grade is F in this area — have there been break-ins, vandalism, or insurance claims at this property in the last 3 years? What carrier currently insures it and at what premium?
- What's the average days-on-market for RENTAL listings here right now (not sales)? A rising rental-DOM trend means longer vacancies and softer asking-rent achievability than the comps imply.
- What's the recent tenant-quality profile in this submarket — average credit score on applications, eviction rate, late-payment / NSF rate, and stable-employment percentage? A property-management company in the area should have these aggregated.
- How much new for-sale + rental construction is in the pipeline within 1–3 miles? Heavy new supply typically softens prices + rents 12–24 months out; constrained supply supports both.
Investment metrics
- 1% rule
- 1.35% ✓
- Cap rate
- 10.81%
- Cash-on-cash
- 16.14%
- DSCR
- 1.72
- GRM
- 6.2
CMA / ARV
- ARV (median comp)
- $57,372
- List price
- $73,500
- Delta
- 28.11%
- Verdict
- OVERPRICED
- Comps
- 19 within 1.0 mi
Projected returns pro-forma
2.08% appreciation · 3.0% rent growth · sell at horizon
- IRR
- 20.6%
- Equity multiple
- 2.12×
- Total profit
- $22,979
- Equity at exit
- $29,301
- IRR
- 22.6%
- Equity multiple
- 4.00×
- Total profit
- $61,676
- Equity at exit
- $42,433
Cash invested: $20,580 (down + closing). Projections, not guarantees.
Landlord ↔ Tenant lean methodology
- Overall (STATE)
- 43 Moderately Tenant-Leaning
- State Illinois
- 43 Moderately Tenant-Leaning · D+7
- County
- — inherits STATE
- City
- — inherits STATE
ZIP-level market 62094
- Home prices YoY
- 2.0%
- Active inventory
- 6
- Price-to-rent
- 6.2×
Monthly cashflow live
- Estimated rent
- $993 medium interval (Pro) →
- Mortgage (P&I)
- −$385
- Tax est. 1.5%
- −$92 /mo · $1,102/yr
- Insurance
- −$31
- HOA
- −$0
- Vacancy / Maint / Mgmt
- −$209
- Net cashflow
- $277
Break-even live
Sensitivity live
| Price | -10% $328 | -5% $302 | +0% $277 | +5% $251 | +10% $226 |
|---|---|---|---|---|---|
| Rent | -10% $198 | -5% $238 | +0% $277 | +5% $316 | +10% $355 |
| Rate | -1.0pp $314 | -0.5pp $296 | base $277 | +0.5pp $258 | +1.0pp $238 |
UW: 25.0% down · 7.5% · 30yr · 1.5% tax · 5.0% vac · 8.0% maint · 8.0% mgmt
Financing live
Cash to close
- Down payment
- $18,375
- Closing costs
- $2,205
- Reserves months
- —
- Total cash needed
- —
Loan-product check · same deal, 3 products live
Conventional
25% down · 7.5% · 30yr
- Down + closing
- —
- Monthly P&I
- —
- Monthly cashflow
- —
- DSCR
- —
- Eligible?
- —
Personal DTI + credit; lowest rate.
DSCR
20% down · 8.5% · 30yr
- Down + closing
- —
- Monthly P&I
- —
- Monthly cashflow
- —
- DSCR
- —
- Eligible?
- —
No personal income docs; deal must DSCR.
Hard money
10% down · 12.0% · 12mo
- Down + closing
- —
- Monthly P&I
- —
- Monthly cashflow
- —
- DSCR
- —
- Eligible?
- —
Short-term bridge; refi at stabilization.
Listing history 17 events
-
2026-06-21days on market $73,500 Active 186 DOM
-
2026-06-21days on market $73,500 Active 185 DOM
-
2026-06-18days on market $73,500 Active 183 DOM
-
2026-06-17days on market $73,500 Active 182 DOM
-
2026-06-16days on market $73,500 Active 181 DOM
-
2026-06-16days on market $73,500 Active 180 DOM
-
2026-06-13days on market $73,500 Active 179 DOM
-
2026-06-12days on market $73,500 Active 178 DOM
-
2026-06-09days on market $73,500 Active 175 DOM
-
2026-06-08days on market $73,500 Active 174 DOM
-
2026-06-07days on market $73,500 Active 173 DOM
-
2026-06-04days on market $73,500 Active 169 DOM
-
2026-06-02days on market $73,500 Active 168 DOM
-
2026-06-01days on market $73,500 Active 167 DOM
-
2026-05-31days on market $73,500 Active 166 DOM
-
2026-05-31days on market $73,500 Active 165 DOM
-
2025-12-16$73,500 Active 297-char remark
Show marketing remark (297 chars)
Just listed, 2 bedroom home situated on the edge of town! It offers a dine-in kitchen, living room/dining room combination, 2 bedrooms and 1 full bath plus the unfinished basement. It is a great starter home with room to build on. City Water, Gas and Sewer. Gas furnace, CA and gas water heater.
ⓘ Source: listings_history table (triggers on properties + properties_extension) + one-shot
backfill from property_details.listing_events for pre-trigger history.
Nearby sold comps map
Loading sold comps map…
Walkable amenities ~0.75 mi
Loading nearby amenities…
Taxation est. · year 1
- Rental income
- $11,921
- − Mortgage interest
- −$4,117
- − Property taxes
- −$1,102
- − Insurance
- −$368
- − Repairs & maintenance
- −$954
- − Management
- −$954
- − Depreciation
- −$2,138
- Taxable income
- $2,288
- Est. tax owed @ 24.0%
- −$549
- After-tax cash flow
- $2,773/yr
For passive investors: Depreciation is non-cash, so a rental often shows a tax loss while cash-flowing — sheltering income. Rental losses are passive: they offset passive income freely, and up to $25,000/yr can offset ordinary (W-2) income if you actively participate and your MAGI is under $100k (phasing out to $0 by $150k); unused losses carry forward. On sale, claimed depreciation is recaptured at up to 25%, and gains may owe capital-gains tax (a 1031 exchange can defer both). Figures are a year-1 estimate at your 24.0% rate — not tax advice; consult a CPA.
Schools (NCES district)
- District
- Hillsboro CUSD 3
- NCES district ID
- 1719200
- Math proficiency
- 20% ▼ -4.00%
- Reading proficiency
- 36% ▼ -7.00%
- Median HH income
- $43,744
- Composite
- 23.89/100
- National rank
- #7794
- State rank
- #282 of 620 in IL
Livability — Witt
- Score
- 54/100
- State rank
- #1266
- US rank
- #23794
Category grades
Schools grade is shown separately in the Schools card above.
Census & demographics
- Census place
- Witt, IL
- Population (ZIP)
- 1,018
Population outlook (Montgomery County) Hauer SSP2
- Today (2025)
- 27,471 people
- By 2030
- 26,410 · -3.9%
- By 2040
- 24,233 · -11.8%
- By 2050
- 21,948 · -20.1%
- By 2075
- 16,686 · -39.3%
- By 2100
- 11,369 · -58.6%
Race, ethnicity, and origin ACS 2023
- Neighborhood character
- Predominantly White (95%)
- Race & ethnicity
- White 95% Black 3% Hispanic / Latino 1% Two or more races 1%
- Common ancestry
- Lithuanian 2% German 1% Iranian 1%
- Foreign-born
- 0%
Political lean MEDSL · Montgomery
- 2024 margin
- Solid R (+44.0) · D 27.1% · R 71.1% · Other 1.8%
- 2008→2024 swing
- -46.7pp toward R · 2008: 2.6pp · 2024: -44.0pp
- All cycles
- 2024: R+44.0 2020: R+41.0 2016: R+40.0 2012: R+14.2 2008: D+2.6
Not yet ingested
- Civics
- —
Market trends
- HPI YoY
- ▲ 2.08%
- Current HPI
- 103.233
- Rent YoY
- —
- Metro
- —
- State GDP YoY
- ▲ 1.59%
- F500 in state
- 60
Industry mix (Fortune 500 HQ in IL)
| Industry | F500 HQs | Revenue |
|---|---|---|
| Insurance | 4 | $201B |
|
||
| Consumer Goods | 4 | $87B |
|
||
| Industrial Machinery | 3 | $64B |
|
||
| Healthcare | 2 | $55B |
|
||
| Retail / Pharmacy | 1 | $148B |
|
||
| Agriculture / Food | 1 | $86B |
|
||
Price history
1 event — show timeline
- 2025-12-16 Listed $73,500 MARIS as Distributed by MLS Grid
Property tax history
+2.8%/yrLatest (2021): $141 · +4.9% YoY. Source: county tax records.
Cash-flow waterfall
monthlySold comps — $/sqft
last 12 mo · ≤1 miLoading sold comps…