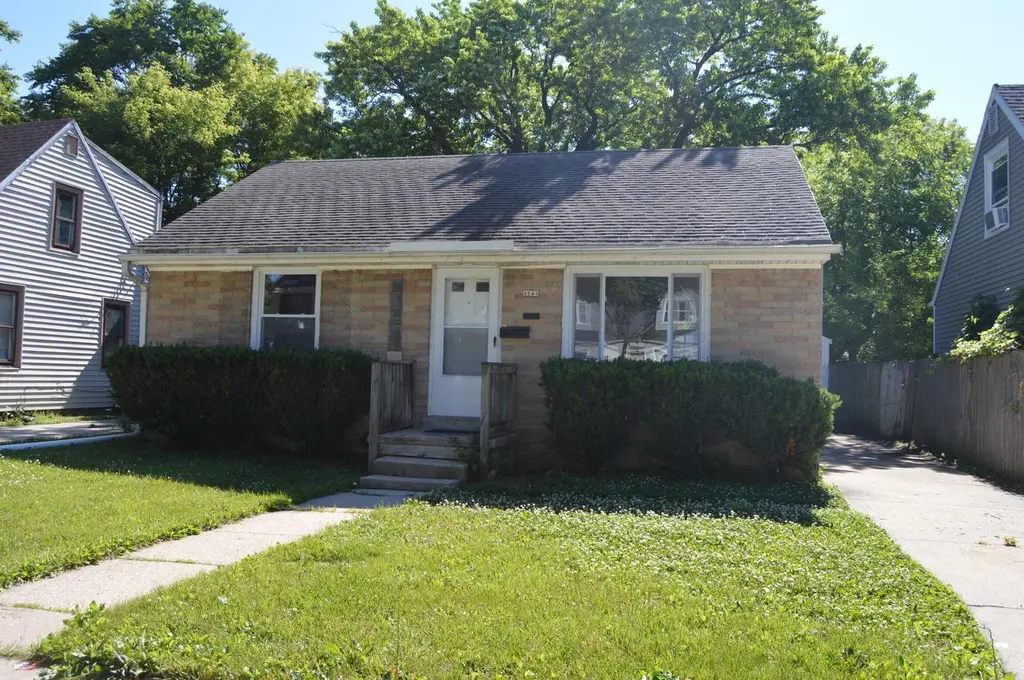
4844 N 54th St · Milwaukee, WI
Flood risk 1/10 · Minimal
- FEMA flood zone
- X (unshaded)
- Chance of flooding over 30 yrs
- 0.0%
- Est. flood insurance / yr
- $473 – $860
Fire risk 1/10 · Minimal
- Est. fire insurance / yr
- $636 – $1,182
Heat risk 2/10 · Minimal
- Hot days now (above 100°F)
- 7 days/yr
- Hot days in 30 yrs
- 13 days/yr
Wind risk 2/10 · Minimal
- Chance of severe wind over 30 yrs
- —
Air-quality risk 2/10 · Minimal
- Unhealthy air days now
- 2 days/yr
- Unhealthy air days in 30 yrs
- 2 days/yr
Risk factors via First Street. Map © Google.
Why this score? — see what drove the D+ grade
The composite is a weighted blend of 9 inputs, each scored 0–100. Each bar is that input's sub-score; the figure is the points it added to the 100-point composite (weight × sub-score).
- Cash flow +14.9/30.0
- ARV discount +10.3/15.0
- DSCR +4.6/10.0
- 1% rule +4.2/10.0
- Livability +4.0/5.0
- Rent growth +3.8/5.0
- Condition / age +2.5/5.0
- Schools +1.2/10.0
- Appreciation +0.0/10.0
$139,900
🖨 Deal sheet (PDF) 📄 Offer letter ✓ Due diligence
Listing remarks
Well maintained ranch ready for a new owner! Property has new kitchen cabinets, countertop, flooring, dishwasher and microwave/fan, brand new windows throughout, beautiful hardwood floors, a bonus room through one of the bedrooms, and a spacious basement. Park your car in the one car garage or driveway and enjoy the secluded back yard. Set up your showing today!
Key facts
- New flooring
- Bonus room
- New kitchen cabinets
Tags
Property features AI
Exterior
- Parking: Detached 1-car garage
- Utilities: Municipal water; Municipal sewer
- Home design: Single-family, one-story home; Estimated living area range: 751–1,000 sq. ft.
- Construction: Assessor/public record used for year built
- Exterior features: Aluminum and aluminum/steel siding; Brick and brick/stone elements; Lot under 1/2 acre (about 0.14 acre); Zoned RT2
Interior
- Kitchen: Kitchen on main level; Dishwasher; Microwave (with fan)
- Bedrooms: Main-level primary bedroom, about 11 x 11; Main-level second bedroom, about 11 x 10
- Bathrooms: One full bathroom
- Heating & cooling: Forced air heating; Natural gas fuel
- Interior features: Full basement with block construction and a sump pump; Bonus room on main level; Living room on main level
- Laundry & utility: Basement utility space (sump pump present)
Neighborhood map
What this means for you Summary
Snapshot
- This is a 2-bed/1.0-bath single-family listed at $140k.
Deal economics
- At list price, monthly cash flow is $42 ($498/yr) — positive.
- The deal already cash-flows at list — no discount required.
- To meet the 1% rule (rent ≥ 1% of price), the offer needs to be $129k (7.9% below list).
- Recommended offer: $129k (7.9% below list) — sets the bar for 1% rule.
- Cap rate 6.6% vs local median 5.1% in Milwaukee — top-decile yield for the area; either an underpriced asset or a hidden risk that comps aren't pricing in. Stress-test before assuming the spread holds.
Location & tenants
- Location reads 81/100 on livability (#55 in WI, #1,534 nationally) — a professional / high-income tenant draw. Strengths: amenities A+, commute A+, cost of living A+; Watch: employment D+, schools F, crime F.
- Milwaukee School District (urban): math 10% / reading 18% proficiency, ranked #337 of 342 in WI (top 98%) — low school quality limits family demand, transient renter base, plan for 1-2y turnover; 77% free/reduced lunch — lower-income household profile, screen leases tightly.
- Market conditions: Rents rising fast (+5.3%/yr); 152 active listings in the ZIP; 33 comparable units currently listed for rent nearby; rentals at typical pace (median 26d on market — plan ~3-4 weeks tenant-placement turnaround); 45% of comp listings sitting > 30 days — soft ceiling on asking rent; 1,017 units permitted in Milwaukee County in 2024 (803 in 5+ unit buildings).
- This rent runs 34% of the median local income ($46k/yr) — at the standard rent-burdened threshold; future hikes will face affordability resistance.
Forward outlook
- Local home prices are declining (-3.0%/yr); year-one equity from $967 of loan paydown is wiped out by about $4k of value loss. Plan a longer hold.
- Milwaukee County population projected at +4% by 2050 — modest demand growth; plan on rents tracking national, not racing it.
Negotiation context
- Only 9 days on market — expect competitive offers; lowballing is unlikely to land.
Risks & watch-outs
- Watch-outs: built in 1953 — expect roof / HVAC / electrical / plumbing capex.
Questions for the listing agent
- Built in 1953 — when were the roof, HVAC, electrical panel, plumbing, and water heater last replaced?
- Is there a deadline driving the sale (1031 exchange, divorce, estate, relocation)? That informs how much negotiation room exists.
- Schools are F-rated, which usually means shorter tenancies and higher turnover. Who's the typical renter profile here, and what's been the actual vacancy rate?
- Crime grade is F in this area — have there been break-ins, vandalism, or insurance claims at this property in the last 3 years? What carrier currently insures it and at what premium?
- The area grade is low — what's the realistic commute time and amenity access for the typical tenant pool here? Any planned neighborhood developments (good or bad) we should know about?
- What's the average days-on-market for RENTAL listings here right now (not sales)? A rising rental-DOM trend means longer vacancies and softer asking-rent achievability than the comps imply.
- What's the recent tenant-quality profile in this submarket — average credit score on applications, eviction rate, late-payment / NSF rate, and stable-employment percentage? A property-management company in the area should have these aggregated.
- How much new for-sale + rental construction is in the pipeline within 1–3 miles? Heavy new supply typically softens prices + rents 12–24 months out; constrained supply supports both.
Investment metrics
- 1% rule
- 0.92% ✗
- Cap rate
- 6.65%
- Cash-on-cash
- 1.27%
- DSCR
- 1.06
- GRM
- 9.1
CMA / ARV
- ARV (on-the-fly)
- $149,184
- Comps found
- 12
Show comp detail 12 sales within ~0.75 mi
| Address | Dist | Beds/Ba | Sqft | Sold | Price | $/sf | Match |
|---|---|---|---|---|---|---|---|
| 4868 N 52nd St | 0.13mi | 2/1.0 | 850 (-4%) | 2mo | $145,605 | $171 | 85 |
| 5003 N 51st Blvd | 0.25mi | 3/1.0 (+1) | 934 (+5%) | 1mo | $110,000 | $118 | 74 |
| 4906 N 58th St | 0.26mi | 3/1.0 (+1) | 940 (+6%) | 1mo | $100,000 | $106 | 72 |
| 4752 N 44th St | 0.63mi | 2/1.0 | 913 (+3%) | 1mo | $160,000 | $175 | 65 |
| 4430 W Glendale Ave | 0.64mi | 3/1.0 (+1) | 908 (+2%) | 0mo | $180,000 | $198 | 61 |
| 5267 N 48th St | 0.64mi | 3/1.0 (+1) | 932 (+5%) | 1mo | $183,000 | $196 | 56 |
| 4451 N 49th St | 0.58mi | 3/1.0 (+1) | 940 (+6%) | 2mo | $199,900 | $213 | 56 |
| 5064 N 56th St | 0.30mi | 3/2.0 (+1) | 1,012 (+14%) | 2mo | $140,000 | $138 | 52 |
| 5243 N 46th St | 0.69mi | 2/1.0 | 803 (-10%) | 1mo | $135,000 | $168 | 51 |
| 4941 N Sherman Blvd | 0.67mi | 3/1.0 (+1) | 973 (+10%) | 0mo | $110,000 | $113 | 48 |
| 5353 N 56th St | 0.65mi | 3/3.0 (+1) | 832 (-6%) | 1mo | $125,000 | $150 | 46 |
| 4618 W Congress St | 0.71mi | 2/1.0 | 1,008 (+14%) | 1mo | $81,500 | $81 | 44 |
Match score weights: distance 35% · size 25% · config 20% · recency 20%. Top-matched comps best support the ARV.
Projected returns pro-forma
-3.0% appreciation · 5.29% rent growth · sell at horizon
- IRR
- -11.7%
- Equity multiple
- 0.57×
- Total profit
- $-16,964
- Equity at exit
- $20,860
- IRR
- 0.6%
- Equity multiple
- 1.05×
- Total profit
- $1,789
- Equity at exit
- $12,096
Cash invested: $39,172 (down + closing). Projections, not guarantees.
Landlord ↔ Tenant lean methodology
- Overall (STATE)
- 73 Landlord-Friendly
- State Wisconsin
- 73 Landlord-Friendly · R+2
- County
- — inherits STATE
- City
- — inherits STATE
ZIP-level market 53218
- Home prices YoY
- -19.0%
- Rents YoY
- 5.3%
- Active inventory
- 152
- Price-to-rent
- 9.1×
Monthly cashflow live
- Estimated rent
- $1,288 high interval (Pro) →
- Mortgage (P&I)
- −$734
- Tax from tax record
- −$184 /mo · $2,208/yr
- Insurance
- −$58
- HOA
- −$0
- Vacancy / Maint / Mgmt
- −$270
- Net cashflow
- $42
Break-even live
Sensitivity live
| Price | -10% $121 | -5% $81 | +0% $42 | +5% $2 | +10% $-38 |
|---|---|---|---|---|---|
| Rent | -10% $-60 | -5% $-9 | +0% $42 | +5% $92 | +10% $143 |
| Rate | -1.0pp $112 | -0.5pp $77 | base $42 | +0.5pp $5 | +1.0pp $-32 |
UW: 25.0% down · 7.5% · 30yr · 1.5% tax · 5.0% vac · 8.0% maint · 8.0% mgmt
Financing live
Cash to close
- Down payment
- $34,975
- Closing costs
- $4,197
- Reserves months
- —
- Total cash needed
- —
Loan-product check · same deal, 3 products live
Conventional
25% down · 7.5% · 30yr
- Down + closing
- —
- Monthly P&I
- —
- Monthly cashflow
- —
- DSCR
- —
- Eligible?
- —
Personal DTI + credit; lowest rate.
DSCR
20% down · 8.5% · 30yr
- Down + closing
- —
- Monthly P&I
- —
- Monthly cashflow
- —
- DSCR
- —
- Eligible?
- —
No personal income docs; deal must DSCR.
Hard money
10% down · 12.0% · 12mo
- Down + closing
- —
- Monthly P&I
- —
- Monthly cashflow
- —
- DSCR
- —
- Eligible?
- —
Short-term bridge; refi at stabilization.
Rent comps 33 comps
| Address | Beds | Baths | Sqft | Rent | $/sqft | DOM | Units | Dist |
|---|---|---|---|---|---|---|---|---|
| 4640 N 51st Blvd Milwaukee, WI | 2.0 | 1.0 | 1075 | $1,275 | $1.19 | 45d | 1 | 0.35mi |
| 4852 N 48th St Unit 4852 Milwaukee, WI | 2.0 | 1.0 | 830 | $995 | $1.20 | 3d | 1 | 0.38mi |
| 4727 N 46th St Milwaukee, WI | 3.0 | 1.0 | 936 | $1,700 | $1.82 | 45d | 1 | 0.50mi |
| 5050 N 47th St Milwaukee, WI | 2.0 | 1.0 | 1092 | $1,700 | $1.56 | 45d | 1 | 0.51mi |
| 4703 N 45th St Milwaukee, WI | 3.0 | 1.0 | 1031 | $1,695 | $1.64 | 25d | 1 | 0.57mi |
| 4610 W Eggert Pl #4612 Milwaukee, WI | 3.0 | 1.0 | 852 | $1,095 | $1.29 | 25d | 1 | 0.59mi |
| 5165-5167 N 45th St Unit 5165 Milwaukee, WI | 3.0 | 1.0 | 1020 | $1,200 | $1.18 | 18d | 1 | 0.66mi |
| 4702 N 44th St Milwaukee, WI | 3.0 | 2.0 | 1050 | $1,850 | $1.76 | 45d | 1 | 0.66mi |
| 6518 W Hampton Ave Unit 2 Milwaukee, WI | 2.0 | 1.0 | 1100 | $1,200 | $1.09 | 45d | 1 | 0.67mi |
| 4479A N 44th St Milwaukee, WI | 2.0 | 1.0 | 1000 | $895 | $0.90 | 45d | 1 | 0.76mi |
| 4661 N 38th St Unit 4661 Milwaukee, WI | 2.0 | 1.0 | 1000 | $845 | $0.84 | 16d | 1 | 1.02mi |
| 5688 N 56th St Milwaukee, WI | 3.0 | 1.0 | 850 | $1,445 | $1.70 | 14d | 1 | 1.06mi |
| 5657 N 60th St #5659 Milwaukee, WI | 3.0 | 1.0 | 878 | $995 | $1.13 | 18d | 1 | 1.07mi |
| 4572 N 38th St Unit 2 Milwaukee, WI | 2.0 | 1.0 | 600 | $950 | $1.58 | 45d | 1 | 1.07mi |
| 4843 N 72nd St Milwaukee, WI | 3.0 | 1.0 | 1014 | $1,485 | $1.46 | 45d | 1 | 1.13mi |
| 5435 N 40th St Milwaukee, WI | 2.0 | 1.0 | 850 | $1,150 | $1.35 | 18d | 1 | 1.13mi |
| 6221 W Thurston Ave #6223 Milwaukee, WI | 3.0 | 1.0 | 800 | $1,100 | $1.38 | 21d | 1 | 1.13mi |
| 4651 N 36th St #4 Milwaukee, WI | 2.0 | 1.0 | 747 | $945 | $1.27 | 25d | 1 | 1.14mi |
| 5659 N 64th St Unit 5659A Milwaukee, WI | 2.0 | 1.0 | 1091 | $1,300 | $1.19 | 45d | 1 | 1.17mi |
| 6026 W Carmen Ave Milwaukee, WI | 2.0 | 1.0 | 672 | $1,195 | $1.78 | 25d | 1 | 1.22mi |
| 7348 W Medford Ave Unit 7348A Milwaukee, WI | 2.0 | 1.0 | 1095 | $950 | $0.87 | 25d | 1 | 1.25mi |
| 4153 N 68th St Milwaukee, WI | 3.0 | 1.0 | 1025 | $1,700 | $1.66 | 45d | 1 | 1.26mi |
| 5830 N 61st St Milwaukee, WI | 3.0 | 1.0 | 1024 | $1,450 | $1.42 | 45d | 1 | 1.27mi |
| 5237 N 34th St Unit 5237 Lower Milwaukee, WI | 2.0 | 1.0 | 956 | $1,350 | $1.41 | 25d | 1 | 1.32mi |
| 5820 N 65th St #5822 Milwaukee, WI | 2.0 | 1.0 | 700 | $1,245 | $1.78 | 45d | 1 | 1.36mi |
| 5823 N 65th St Unit Upper Milwaukee, WI | 2.0 | 1.0 | 768 | $1,295 | $1.69 | 45d | 1 | 1.37mi |
| 5831 N 65th St Unit 5831 Milwaukee, WI | 3.0 | 1.0 | 900 | $1,195 | $1.33 | 45d | 1 | 1.38mi |
| 3925 N 42nd St Milwaukee, WI | 2.0 | 1.0 | 985 | $1,400 | $1.42 | 25d | 1 | 1.40mi |
| 5032 N 32nd St Milwaukee, WI | 3.0 | 2.0 | 1089 | $1,750 | $1.61 | 14d | 1 | 1.40mi |
| 3890 N Sherman Blvd Milwaukee, WI | 2.0 | 1.0 | 950 | $1,100 | $1.16 | 14d | 1 | 1.42mi |
| 3925 N 41st St Unit 2 Milwaukee, WI | 1.0 | 1.0 | 700 | $845 | $1.21 | 25d | 1 | 1.43mi |
| 7701 W Hampton Ave Unit 6 Milwaukee, WI | 2.0 | 1.0 | 816 | $1,250 | $1.53 | 45d | 1 | 1.44mi |
| 5905 N 66th St Unit 66th Lower Milwaukee, WI | 3.0 | 1.0 | 1000 | $1,600 | $1.60 | 18d | 1 | 1.49mi |
Listing history 7 events
-
2026-06-21days on market $139,900 Active 9 DOM
-
2026-06-18days on market $139,900 Active 6 DOM
-
2026-06-17days on market $139,900 Active 5 DOM
-
2026-06-16days on market $139,900 Active 4 DOM
-
2026-06-15days on market $139,900 Active 3 DOM
-
2026-06-13remarks 364-char remark
-
2026-06-13$139,900 Active 1 DOM
ⓘ Source: listings_history table (triggers on properties + properties_extension) + one-shot
backfill from property_details.listing_events for pre-trigger history.
Tax reassessment forecast WI · Partial reset (capped growth)
- Current annual tax
- $2,208 · $184/mo
- Projected year-2 tax
- $2,398 · $200/mo
- Expected delta
- +$190/yr (+$16/mo · 8.6%)
ⓘ Screening estimate from a state-policy table — verify with the county assessor before closing.
Climate risk First Street
- Flood 1/10 Low FEMA zone X (unshaded) · 0% chance over 30 yrs
- Wildfire 1/10 Low
- Heat 2/10 Low 7 d/yr ≥100°F today · 13 d/yr by 30 yrs out
- Wind 2/10 Low
- Air quality 2/10 Low 2 unhealthy d/yr today · 2 by 30 yrs out
Nearby sold comps map
Loading sold comps map…
Walkable amenities ~0.75 mi
Loading nearby amenities…
Taxation est. · year 1
- Rental income
- $15,455
- − Mortgage interest
- −$7,837
- − Property taxes
- −$2,208
- − Insurance
- −$700
- − Repairs & maintenance
- −$1,236
- − Management
- −$1,236
- − Depreciation
- −$4,070
- Taxable loss
- −$1,831
- Est. tax savings @ 24.0%
- +$440
- After-tax cash flow
- $938/yr
For passive investors: Depreciation is non-cash, so a rental often shows a tax loss while cash-flowing — sheltering income. Rental losses are passive: they offset passive income freely, and up to $25,000/yr can offset ordinary (W-2) income if you actively participate and your MAGI is under $100k (phasing out to $0 by $150k); unused losses carry forward. On sale, claimed depreciation is recaptured at up to 25%, and gains may owe capital-gains tax (a 1031 exchange can defer both). Figures are a year-1 estimate at your 24.0% rate — not tax advice; consult a CPA.
Schools (NCES district)
- District
- Milwaukee School District
- NCES district ID
- 5509600
- Math proficiency
- 10% ▼ -5.00%
- Reading proficiency
- 18% ▬ 0.00%
- Median HH income
- $36,339
- Composite
- 11.61/100
- National rank
- #9696
- State rank
- #337 of 342 in WI
Livability — Milwaukee
- Score
- 81/100
- State rank
- #55
- US rank
- #1534
Category grades
Schools grade is shown separately in the Schools card above.
Census & demographics
- Census place
- Milwaukee, WI
- County
- Milwaukee County · 926,379 people
- City population
- 573,768
- Metro
- Milwaukee-Waukesha, WI
- Population (ZIP)
- 41,196
- Household income
- $45,642
- Rent vs Own
- Severe rent burden
- 2421.0
Population outlook (Milwaukee County) Hauer SSP2
- Today (2025)
- 995,758 people
- By 2030
- 1,009,124 · +1.3%
- By 2040
- 1,028,128 · +3.3%
- By 2050
- 1,040,066 · +4.4%
- By 2075
- 1,057,849 · +6.2%
- By 2100
- 1,039,774 · +4.4%
Race, ethnicity, and origin ACS 2023
- Neighborhood character
- Predominantly Black (72%)
- Race & ethnicity
- Black 72% Asian 10% White 10% Hispanic / Latino 5% Two or more races 3%
- Common ancestry
- Romanian 1% Lithuanian 1%
- Foreign-born
- 6% · Philippines, Canada
- Languages at home
- 89% English-only · Other Asian/Pacific 7% Spanish 3%
Political lean MEDSL · Milwaukee
- 2024 margin
- Solid D (+38.5) · D 68.3% · R 29.8% · Other 1.8%
- 2008→2024 swing
- +2.7pp toward D · 2008: 35.9pp · 2024: 38.5pp
- All cycles
- 2024: D+38.5 2020: D+39.9 2016: D+37.5 2012: D+34.6 2008: D+35.9
Not yet ingested
- Civics
- —
Market trends
- HPI YoY
- ▼ -76.44%
- Current HPI
- 325.1975
- Rent YoY
- ▲ 5.29%
- Metro
- Milwaukee-Waukesha, WI
- State GDP YoY
- ▲ 2.10%
- F500 in state
- 20
Industry mix (Fortune 500 HQ in WI)
| Industry | F500 HQs | Revenue |
|---|---|---|
| Industrial Machinery | 4 | $23B |
|
||
| Industrial Technology | 2 | $36B |
|
||
| Insurance | 1 | $36B |
|
||
| Professional Services | 1 | $19B |
|
||
| Utilities | 1 | $9B |
|
||
| Consumer Goods | 1 | $3B |
|
||
Price history
1 event — show timeline
- 2026-06-12 Listed $139,900 METROMLS
Property tax history
+3.4%/yrLatest (2024): $2,208 · +37.6% YoY. Source: county tax records.
Cash-flow waterfall
monthlySold comps — $/sqft
last 12 mo · ≤1 miLoading sold comps…