 🌊 Lakefront
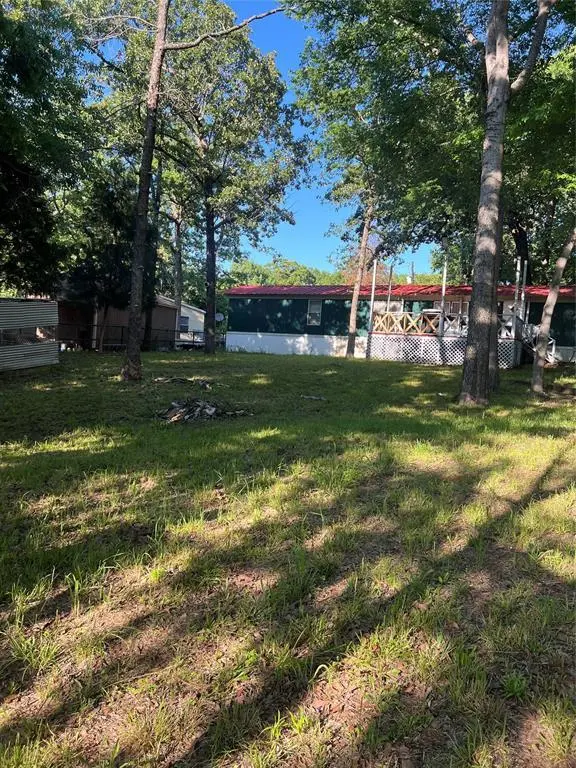
107 Chicota St · Payne Springs, TX
Flood risk No data
- FEMA flood zone
- —
- Chance of flooding over 30 yrs
- —
- Est. flood insurance / yr
- —
Fire risk No data
- Est. fire insurance / yr
- —
Heat risk No data
- Hot days now (above threshold)
- —
- Hot days in 30 yrs
- —
Wind risk No data
- Chance of severe wind over 30 yrs
- —
Air-quality risk No data
- Unhealthy air days now
- —
- Unhealthy air days in 30 yrs
- —
Risk factors via First Street. Map © Google.
Why this score? — see what drove the C grade
The composite is a weighted blend of 9 inputs, each scored 0–100. Each bar is that input's sub-score; the figure is the points it added to the 100-point composite (weight × sub-score).
- Cash flow +26.4/30.0
- DSCR +9.0/10.0
- ARV discount +7.5/15.0
- 1% rule +5.9/10.0
- Schools +3.2/10.0
- Livability +3.1/5.0
- Condition / age +2.5/5.0
- Rent growth +1.1/5.0
- Appreciation +0.0/10.0
$150,000
🖨 Deal sheet 📄 Offer letter ✓ Due diligence
Listing remarks MLS
nice secluded property for those who like the lake living with a country feeling. Property is ideal for a first time buyer, weekend home or for an investors looking to add an extra rental to their portfolio. This 2008 single wide 3 bedroom 2 bath home have a nice large deck patio either to entertain family and friends or just to relax an enjoy the Texas nature feeling with seasonal water view and shade from the big tall trees.
Key facts
- Secluded property
- Large deck patio
- Seasonal water view
Tags
Neighborhood map
What this means for you Summary
Snapshot
- This is a 3-bed/2.0-bath manufactured listed at $150k.
Deal economics
- At list price, monthly cash flow is $391 ($5k/yr) — positive.
- The deal already cash-flows at list — no discount required.
- Meets the 1% rule at list price ($2k rent vs $150k).
- Recommended offer: $132k (12.0% below list) — sets the bar for market timing.
- Cap rate 9.4% vs local median 3.9% in Payne Springs — top-decile yield for the area; either an underpriced asset or a hidden risk that comps aren't pricing in. Stress-test before assuming the spread holds.
Location & tenants
- Location reads 61/100 on livability (#985 in TX) — a middle-class / working-renter tenant base. Strengths: crime A+, cost of living A+, housing A; Watch: schools F, amenities F, commute F.
- Eustace ISD (rural): math 32% / reading 45% proficiency, ranked #455 of 826 in TX (top 55%) — families likely to look elsewhere, expect single-tenant / working-renter base with shorter leases; 62% free/reduced lunch — lower-income household profile, screen leases tightly.
- Market conditions: Rents falling (-5.8%/yr); 694 active listings in the ZIP; 3 comparable units currently listed for rent nearby; rentals lingering (median 44d on market — plan ~5-8 weeks vacancy on turnover, expect pricing pressure); 100% of comp listings sitting > 30 days — soft ceiling on asking rent; 263 units permitted in Henderson County in 2024 (0 in 5+ unit buildings).
- This rent runs 32% of the median local income ($61k/yr) — at the standard rent-burdened threshold; future hikes will face affordability resistance.
Forward outlook
- Local home prices are declining (-3.0%/yr); year-one equity from $1k of loan paydown is wiped out by about $4k of value loss. Plan a longer hold.
Negotiation context
- It's been on market 232 days — a 12% lower offer ($132k) is reasonable based on typical stale-listing flexibility.
- 3 sale attempts since 2y ago with the ask held roughly flat each time — persistent listings suggest the price (not the market) is what's stuck; bring a comps-based counter.
Questions for the listing agent
- It's been on market 232 days. Have you received any prior offers? Is the seller open to a 12% concession, seller financing, or rate buy-down credit?
- Why hasn't it sold? Are there any deal-killer items the seller is aware of (foundation, flood, title, zoning, code violations)?
- Is there a deadline driving the sale (1031 exchange, divorce, estate, relocation)? That informs how much negotiation room exists.
- Schools are F-rated, which usually means shorter tenancies and higher turnover. Who's the typical renter profile here, and what's been the actual vacancy rate?
- This sits on a lake — are riparian / water-frontage rights deeded with the parcel? Any dock permits, shoreline easements, or HOA water-use restrictions?
- What's the documented flood / surge / shoreline-erosion history here (FEMA AND non-FEMA — e.g., storm surge, creek backup, septic-field saturation)?
- Any water-quality or seasonal algae-bloom issues that affect tenant satisfaction or short-term-rental demand?
- What's the average days-on-market for RENTAL listings here right now (not sales)? A rising rental-DOM trend means longer vacancies and softer asking-rent achievability than the comps imply.
- What's the recent tenant-quality profile in this submarket — average credit score on applications, eviction rate, late-payment / NSF rate, and stable-employment percentage? A property-management company in the area should have these aggregated.
- How much new for-sale + rental construction is in the pipeline within 1–3 miles? Heavy new supply typically softens prices + rents 12–24 months out; constrained supply supports both.
Investment metrics
- 1% rule
- 1.09% ✓
- Cap rate
- 9.42%
- Cash-on-cash
- 11.17%
- DSCR
- 1.50
- GRM
- 7.6
CMA / ARV
- ARV (median comp)
- $87,200
- List price
- $150,000
- Delta
- 72.02%
- Verdict
- OVERPRICED
- Comps
- 2 within 1.0 mi
Show comp detail 6 sales within ~0.75 mi
| Address | Dist | Beds/Ba | Sqft | Sold | Price | $/sf | Match |
|---|---|---|---|---|---|---|---|
| 121 Coahoma St | 0.33mi | 3/2.0 | 1,064 (-12%) | 9mo | $87,400 | $82 | 56 |
| 7111 Inca Trl | 0.41mi | 2/2.0 (-1) | 1,064 (-12%) | 1mo | $88,900 | $84 | 54 |
| 127 Little River Bnd | 0.40mi | 3/2.0 | 1,288 (+6%) | 22mo | $275,000 | $214 | 53 |
| 7657 Double Bridge Rd | 0.60mi | 3/2.0 | 1,150 (-5%) | 19mo | $84,500 | $73 | 47 |
| 102 Lake Arrowhead Dr | 0.49mi | 3/2.0 | 1,064 (-12%) | 14mo | $37,000 | $35 | 44 |
| 100 Kiowa Trl | 0.72mi | 3/2.0 | 1,191 (-2%) | 23mo | $117,900 | $99 | 43 |
Match score weights: distance 35% · size 25% · config 20% · recency 20%. Top-matched comps best support the ARV.
Projected returns pro-forma
-3.0% appreciation · 0.0% rent growth · sell at horizon
- IRR
- -2.8%
- Equity multiple
- 0.90×
- Total profit
- $-4,264
- Equity at exit
- $22,365
- IRR
- 3.6%
- Equity multiple
- 1.23×
- Total profit
- $9,564
- Equity at exit
- $12,969
Cash invested: $42,000 (down + closing). Projections, not guarantees.
Landlord ↔ Tenant lean methodology
- Overall (STATE)
- 87 Strongly Landlord-Friendly
- State Texas
- 87 Strongly Landlord-Friendly · R+5
- County
- — inherits STATE
- City
- — inherits STATE
ZIP-level market 75156
- Rents YoY
- -5.8%
- Active inventory
- 694
- Price-to-rent
- 7.6×
Monthly cashflow live
- Estimated rent
- $1,638 medium interval (Pro) →
- Mortgage (P&I)
- −$787
- Tax from tax record
- −$54 /mo · $649/yr
- Insurance
- −$62
- HOA
- −$0
- Vacancy / Maint / Mgmt
- −$344
- Net cashflow
- $391
Break-even live
UW: 25.0% down · 7.5% · 30yr · 1.5% tax · 5.0% vac · 8.0% maint · 8.0% mgmt
Financing live
Cash to close
- Down payment
- $37,500
- Closing costs
- $4,500
- Reserves months
- —
- Total cash needed
- —
Loan-product check · same deal, 3 products live
Conventional
25% down · 7.5% · 30yr
- Down + closing
- —
- Monthly P&I
- —
- Monthly cashflow
- —
- DSCR
- —
- Eligible?
- —
Personal DTI + credit; lowest rate.
DSCR
20% down · 8.5% · 30yr
- Down + closing
- —
- Monthly P&I
- —
- Monthly cashflow
- —
- DSCR
- —
- Eligible?
- —
No personal income docs; deal must DSCR.
Hard money
10% down · 12.0% · 12mo
- Down + closing
- —
- Monthly P&I
- —
- Monthly cashflow
- —
- DSCR
- —
- Eligible?
- —
Short-term bridge; refi at stabilization.
Rent comps 3 comps
| Address | Beds | Baths | Sqft | Rent | $/sqft | DOM | Units | Dist |
|---|---|---|---|---|---|---|---|---|
| 110 Bowie St Mabank, TX | 3.0 | 2.0 | 1200 | $1,550 | $1.29 | 43d | 1 | 0.36mi |
| 120 Trails End St Mabank, TX | 2.0 | 2.0 | 1176 | $1,895 | $1.61 | 43d | 1 | 1.00mi |
| 102 Lynn Creek Dr Mabank, TX | 3.0 | 1.0 | 1400 | $995 | $0.71 | 43d | 1 | 1.13mi |
Listing history 20 events
-
2026-06-19days on market $150,000 Active 232 DOM
-
2026-06-18days on market $150,000 Active 231 DOM
-
2026-06-17days on market $150,000 Active 230 DOM
-
2026-06-16days on market $150,000 Active 229 DOM
-
2026-06-15days on market $150,000 Active 228 DOM
-
2026-06-14days on market $150,000 Active 226 DOM
-
2026-06-12days on market $150,000 Active 225 DOM
-
2026-06-09days on market $150,000 Active 222 DOM
-
2026-06-08days on market $150,000 Active 221 DOM
-
2026-06-07days on market $150,000 Active 220 DOM
-
2026-06-05days on market $150,000 Active 217 DOM
-
2026-06-02days on market $150,000 Active 215 DOM
-
2026-06-01days on market $150,000 Active 214 DOM
-
2026-05-31days on market $150,000 Active 213 DOM
-
2026-05-30days on market $150,000 Active 212 DOM
-
2025-10-30$150,000 Active 434-char remark
Show marketing remark (434 chars)
nice secluded property for those who like the lake living with a country feeling. Property is ideal for a first time buyer, weekend home or for an investors looking to add an extra rental to their portfolio. This 2008 single wide 3 bedroom 2 bath home have a nice large deck patio either to entertain family and friends or just to relax an enjoy the Texas nature feeling with seasonal water view and shade from the big tall trees.
-
2025-09-09historical
-
2025-04-12$150,000 Active
-
2025-03-25historical
-
2024-09-25$150,000 Active
ⓘ Source: listings_history table (triggers on properties + properties_extension) + one-shot
backfill from property_details.listing_events for pre-trigger history.
Tax reassessment forecast TX · Resets to sale price
- Current annual tax
- $649 · $54/mo
- Projected year-2 tax
- $2,745 · $229/mo
- Expected delta
- +$2,096/yr (+$175/mo · 323.0%)
ⓘ Screening estimate from a state-policy table — verify with the county assessor before closing.
Nearby sold comps map
Loading sold comps map…
Walkable amenities ~0.75 mi
Loading nearby amenities…
Taxation est. · year 1
- Rental income
- $19,658
- − Mortgage interest
- −$8,402
- − Property taxes
- −$649
- − Insurance
- −$750
- − Repairs & maintenance
- −$1,573
- − Management
- −$1,573
- − Depreciation
- −$4,364
- Taxable income
- $2,348
- Est. tax owed @ 24.0%
- −$563
- After-tax cash flow
- $4,128/yr
For passive investors: Depreciation is non-cash, so a rental often shows a tax loss while cash-flowing — sheltering income. Rental losses are passive: they offset passive income freely, and up to $25,000/yr can offset ordinary (W-2) income if you actively participate and your MAGI is under $100k (phasing out to $0 by $150k); unused losses carry forward. On sale, claimed depreciation is recaptured at up to 25%, and gains may owe capital-gains tax (a 1031 exchange can defer both). Figures are a year-1 estimate at your 24.0% rate — not tax advice; consult a CPA.
Schools (NCES district)
- District
- Eustace ISD
- NCES district ID
- 4818720
- Math proficiency
- 32% ▼ -18.00%
- Reading proficiency
- 45% ▼ -7.00%
- Median HH income
- $42,425
- Composite
- 32.48/100
- National rank
- #5711
- State rank
- #455 of 826 in TX
Livability — Payne Springs
- Score
- 61/100
- State rank
- #985
- US rank
- #17539
Category grades
Schools grade is shown separately in the Schools card above.
Census & demographics
- County
- Henderson County · 34,977 people
- City population
- 16,333
- Metro
- Athens, TX
- Population (ZIP)
- 16,333
- Household income
- $60,867
- Rent vs Own
- Severe rent burden
- 400.0
Population outlook (Henderson County) Hauer SSP2
- Today (2025)
- 80,471 people
- By 2030
- 80,608 · +0.2%
- By 2040
- 80,087 · -0.5%
- By 2050
- 78,208 · -2.8%
- By 2075
- 72,423 · -10.0%
- By 2100
- 61,012 · -24.2%
Race, ethnicity, and origin ACS 2023
- Neighborhood character
- Predominantly White (85%)
- Race & ethnicity
- White 85% Hispanic / Latino 7% Two or more races 7% Black 1%
- Hispanic origin (detail)
- Mexican 5%
- Common ancestry
- Slovak 3% Serbian 2% European 2%
- Foreign-born
- 4% · Canada, Jamaica
- Languages at home
- 94% English-only · Spanish 4% Other Indo-European 1%
Political lean MEDSL · Henderson
- 2024 margin
- Solid R (+63.5) · D 18.0% · R 81.4%
- 2008→2024 swing
- -18.8pp toward R · 2008: -44.6pp · 2024: -63.5pp
- All cycles
- 2024: R+63.5 2020: R+60.2 2016: R+60.0 2012: R+54.8 2008: R+44.6
Not yet ingested
- Civics
- —
Market trends
- HPI YoY
- ▼ -216.77%
- Current HPI
- 199.8108
- Rent YoY
- ▼ -5.76%
- Metro
- Athens, TX
- State GDP YoY
- ▲ 3.95%
- F500 in state
- 110
Industry mix (Fortune 500 HQ in TX)
| Industry | F500 HQs | Revenue |
|---|---|---|
| Energy | 16 | $1,198B |
|
||
| Technology | 5 | $198B |
|
||
| Engineering / Construction | 4 | $72B |
|
||
| Energy Services | 3 | $60B |
|
||
| Utilities | 3 | $41B |
|
||
| Healthcare | 2 | $330B |
|
||
Price history
+0.0% since first listed5 events — show timeline
- 2025-10-30 Listed $150,000 NTREIS
- 2025-09-09 Listing Removed — NTREIS
- 2025-04-12 Listed $150,000 NTREIS
- 2025-03-25 Listing Removed — NTREIS
- 2024-09-25 Listed $150,000 NTREIS
Property tax history
+1.6%/yrLatest (2025): $649 · -4.6% YoY. Source: county tax records.
Cash-flow waterfall
monthlySold comps — $/sqft
last 12 mo · ≤1 miLoading sold comps…