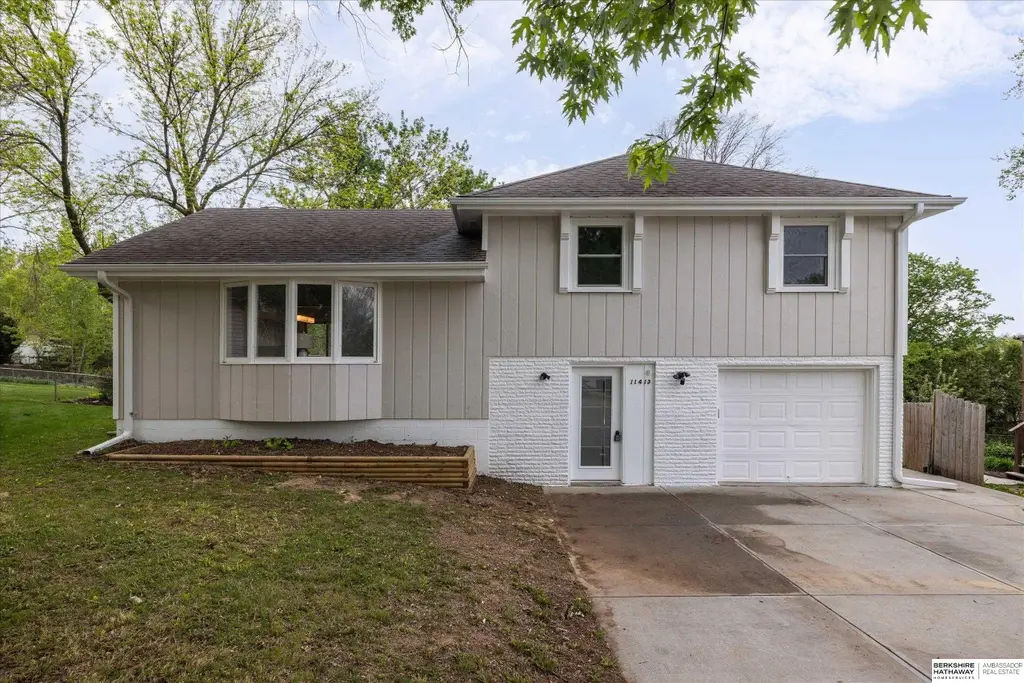
11413 S Cir · Omaha, NE
Flood risk 1/10 · Minimal
- FEMA flood zone
- X (unshaded)
- Chance of flooding over 30 yrs
- 0.0%
- Est. flood insurance / yr
- $473 – $860
Fire risk 1/10 · Minimal
- Est. fire insurance / yr
- $1,161 – $2,155
Heat risk 3/10 · Minor
- Hot days now (above 103°F)
- 7 days/yr
- Hot days in 30 yrs
- 16 days/yr
Wind risk 2/10 · Minimal
- Chance of severe wind over 30 yrs
- —
Air-quality risk 2/10 · Minimal
- Unhealthy air days now
- 1 days/yr
- Unhealthy air days in 30 yrs
- 1 days/yr
Risk factors via First Street. Map © Google.
Why this score? — see what drove the F grade
The composite is a weighted blend of 9 inputs, each scored 0–100. Each bar is that input's sub-score; the figure is the points it added to the 100-point composite (weight × sub-score).
- ARV discount +7.5/15.0
- Cash flow +5.9/30.0
- Schools +5.3/10.0
- Livability +4.2/5.0
- Rent growth +3.4/5.0
- Condition / age +2.5/5.0
- 1% rule +1.0/10.0
- DSCR +0.3/10.0
- Appreciation +0.0/10.0
$289,900
🖨 Deal sheet 📄 Offer letter ✓ Due diligence
Listing remarks
This home is nestled on a cul-de-sac with a public park just down the street! Home has been updated and is move in ready. New LVP, carpet, updated bathrooms, quartz counters, appliances and much more! Schedule your showing today!
Key facts
- Quartz counters
- Updated bathrooms
- Cul-de-sac
Tags
Property features AI
Exterior
- Parking: Attached garage (1 car); Built-in garage with 1 covered parking space
- Utilities: Public water; Public sewer
- Home design: Single-family residence; Multi-level home; Built in 1968; Not new / not a model
- Construction: Composition roof; Block foundation
- Exterior features: Deck; Chain link and privacy fencing; Lot approximately 0.14 acres (about 104 x 62)
Interior
- Kitchen: Kitchen on main floor
- Bedrooms: Primary bedroom on 2nd floor; Additional bedrooms on 2nd floor and basement
- Bathrooms: 3 total bathrooms (2 full, 1 half)
- Heating & cooling: Natural gas forced-air heating; Central air conditioning
- Interior features: Finished basement; No fireplaces
- Laundry & utility: Basement utility/finished area available
Neighborhood map
What this means for you Summary
Snapshot
- This is a 3-bed/2.5-bath other listed at $290k.
Deal economics
- At list price, monthly cash flow is $-568 ($-7k/yr) — negative.
- To cash-flow at today's rent, offer at most $190k (34.6% below list).
- To meet the 1% rule (rent ≥ 1% of price), the offer needs to be $173k (40.5% below list).
- Recommended offer: $173k (40.5% below list) — sets the bar for 1% rule.
Location & tenants
- Location reads 84/100 on livability (#7 in NE, #663 nationally) — a professional / high-income tenant draw. Strengths: amenities A+, commute A+, cost of living A+; Watch: crime F.
- Millard Public Schools (urban): math 58% / reading 60% proficiency, ranked #13 of 111 in NE (top 12%) — acceptable for families but not a draw, mixed tenant base, ~2y average lease; only 13% free/reduced lunch — higher-income household profile.
- Zoned schools: Walt Disney Elementary School (math 47% / reading 57%, grade C-, #200 of 502 statewide, top 46%, 396 students, 44% FRL); Millard Central Middle School (math 39% / reading 41%, grade F, #84 of 128 statewide, top 65%, 825 students, 47% FRL); Millard South High School (math 51% / reading 54%, grade C-, #97 of 261 statewide, top 37%, 2,607 students, 36% FRL) — zoned schools average 42% FRL vs 13% district-wide (29 pts higher); higher-poverty schools than district average — tighter screening recommended.
- Market conditions: Rents rising (+3.6%/yr); 113 active listings in the ZIP; 11 comparable units currently listed for rent nearby; rentals leasing fast (median 3d on market — plan ~1-2 weeks tenant-placement turnaround); solid renter incomes; 4,539 units permitted in Douglas County in 2024 (2,583 in 5+ unit buildings).
Forward outlook
- Local home prices are declining (-3.0%/yr); year-one equity from $2k of loan paydown is wiped out by about $9k of value loss. Plan a longer hold.
- Douglas County population projected at +28% by 2050 — long-run rental-demand tailwind backs the buy-and-hold thesis.
Negotiation context
- Only 4 days on market — expect competitive offers; lowballing is unlikely to land.
- 9 sale attempts since 28y ago with the ask held roughly flat each time — persistent listings suggest the price (not the market) is what's stuck; bring a comps-based counter.
- Current owner paid $125k; list at $290k implies a 132% gain — meaningful room to come down on a strong offer.
Questions for the listing agent
- What do current leases actually rent for vs. the listed asking? Can we see a recent rent roll and the last 12 months of T-12 income?
- Built in 1968 — when were the roof, HVAC, electrical panel, plumbing, and water heater last replaced?
- Is there a deadline driving the sale (1031 exchange, divorce, estate, relocation)? That informs how much negotiation room exists.
- Crime grade is F in this area — have there been break-ins, vandalism, or insurance claims at this property in the last 3 years? What carrier currently insures it and at what premium?
- The area grade is low — what's the realistic commute time and amenity access for the typical tenant pool here? Any planned neighborhood developments (good or bad) we should know about?
- What's the average days-on-market for RENTAL listings here right now (not sales)? A rising rental-DOM trend means longer vacancies and softer asking-rent achievability than the comps imply.
- What's the recent tenant-quality profile in this submarket — average credit score on applications, eviction rate, late-payment / NSF rate, and stable-employment percentage? A property-management company in the area should have these aggregated.
- How much new for-sale + rental construction is in the pipeline within 1–3 miles? Heavy new supply typically softens prices + rents 12–24 months out; constrained supply supports both.
Investment metrics
- 1% rule
- 0.60% ✗
- Cap rate
- 3.94%
- Cash-on-cash
- -8.39%
- DSCR
- 0.63
- GRM
- 14.0
CMA / ARV
No comps found within radius.
Projected returns pro-forma
-3.0% appreciation · 3.58% rent growth · sell at horizon
- IRR
- -30.5%
- Equity multiple
- -0.01×
- Total profit
- $-82,127
- Equity at exit
- $43,225
- IRR
- -30.3%
- Equity multiple
- -0.40×
- Total profit
- $-113,928
- Equity at exit
- $25,065
Cash invested: $81,172 (down + closing). Projections, not guarantees.
Landlord ↔ Tenant lean methodology
- Overall (STATE)
- 83 Strongly Landlord-Friendly
- State Nebraska
- 83 Strongly Landlord-Friendly · R+13
- County
- — inherits STATE
- City
- — inherits STATE
ZIP-level market 68137
- Rents YoY
- 3.6%
- Active inventory
- 113
- Price-to-rent
- 14.0×
Monthly cashflow live
- Estimated rent
- $1,725 high interval (Pro) →
- Mortgage (P&I)
- −$1,520
- Tax from tax record
- −$289 /mo · $3,473/yr
- Insurance
- −$121
- HOA
- −$0
- Vacancy / Maint / Mgmt
- −$362
- Net cashflow
- $-568
Break-even live
UW: 25.0% down · 7.5% · 30yr · 1.5% tax · 5.0% vac · 8.0% maint · 8.0% mgmt
Financing live
Cash to close
- Down payment
- $72,475
- Closing costs
- $8,697
- Reserves months
- —
- Total cash needed
- —
Loan-product check · same deal, 3 products live
Conventional
25% down · 7.5% · 30yr
- Down + closing
- —
- Monthly P&I
- —
- Monthly cashflow
- —
- DSCR
- —
- Eligible?
- —
Personal DTI + credit; lowest rate.
DSCR
20% down · 8.5% · 30yr
- Down + closing
- —
- Monthly P&I
- —
- Monthly cashflow
- —
- DSCR
- —
- Eligible?
- —
No personal income docs; deal must DSCR.
Hard money
10% down · 12.0% · 12mo
- Down + closing
- —
- Monthly P&I
- —
- Monthly cashflow
- —
- DSCR
- —
- Eligible?
- —
Short-term bridge; refi at stabilization.
Rent comps 11 comps
| Address | Beds | Baths | Sqft | Rent | $/sqft | DOM | Units | Dist |
|---|---|---|---|---|---|---|---|---|
| 11029 R Plz Omaha, NE | 1.0–2.0 | 1.0–1.5 | 920 | $1,190 | $1.29 | 3d | 15 | 0.26mi |
| 5622 S 110th Cir Omaha, NE | 2.0 | 1.0 | 1600 | $1,795 | $1.12 | 43d | 1 | 0.47mi |
| 11025 M St Omaha, NE | 2.0 | 1.0–2.0 | 854 | $1,640 | $1.92 | 2d | 20 | 0.62mi |
| 12230 Anne St Omaha, NE | 1.0–2.0 | 1.0–1.5 | 900 | $1,010 | $1.12 | 3d | 5 | 0.88mi |
| 6601 S 108th Ct Omaha, NE | 1.0–2.0 | 1.0–2.0 | 869 | $1,500 | $1.73 | 43d | 1 | 0.88mi |
| 12741 Woodcrest Dr Unit 12841 Condo Omaha, NE | 2.0 | 2.0 | 1019 | $2,200 | $2.16 | 3d | 1 | 0.90mi |
| 12727 Woodcrest Plz #123 Omaha, NE | 3.0 | 2.0 | 1508 | $2,200 | $1.46 | 43d | 1 | 1.09mi |
| 10025 South Plz Unit 021R-1 Omaha, NE | 2.0 | 1.0 | 950 | $1,229 | $1.29 | 3d | 1 | 1.11mi |
| 12741 Woodcrest Plz #317 Omaha, NE | 2.0 | 2.0 | 1019 | $2,400 | $2.36 | 43d | 1 | 1.14mi |
| 5344 S 99th St Omaha, NE | 3.0 | 1.0–2.0 | 750 | $1,575 | $2.10 | 3d | 9 | 1.22mi |
| 3618 S 120th St Omaha, NE | 3.0 | 2.0 | 1524 | $2,050 | $1.35 | 2d | 1 | 1.47mi |
Listing history 29 events
-
2026-05-12status Pending
-
2026-05-08$289,900 New
-
2026-04-27status Pending
-
2026-04-27historical
-
2026-04-22$295,000 New
-
2021-11-29historical
-
2021-11-09status Back On Market
-
2021-11-05status Pending
-
2021-11-03$205,000 Active - New
-
2021-08-23status Pending
-
2021-08-23historical
-
2021-08-20status Back On Market
-
2021-08-05status Pending
-
2021-08-02price $205,000
-
2021-07-11price $218,000
-
2021-06-28price $225,000
-
2021-06-17price $230,000
-
2021-06-02$240,000 Active - New
-
2004-07-14soldstatus $125,000
-
2004-06-30soldstatus $125,000
-
2004-04-29historical
-
2004-04-16$127,500
-
2001-05-31soldstatus $102,000
-
2001-04-21historical
-
2001-04-21soldstatus $102,000
-
2001-03-03$103,950
-
1998-03-31soldstatus $85,000
-
1998-02-09historical
-
1998-02-05$85,000
ⓘ Source: listings_history table (triggers on properties + properties_extension) + one-shot
backfill from property_details.listing_events for pre-trigger history.
Tax reassessment forecast NE · Resets to sale price
- Current annual tax
- $3,473 · $289/mo
- Projected year-2 tax
- $5,015 · $418/mo
- Expected delta
- +$1,542/yr (+$128/mo · 44.4%)
ⓘ Screening estimate from a state-policy table — verify with the county assessor before closing.
Climate risk First Street
- Flood 1/10 Low FEMA zone X (unshaded) · 0% chance over 30 yrs
- Wildfire 1/10 Low
- Heat 3/10 Moderate 7 d/yr ≥103°F today · 16 d/yr by 30 yrs out
- Wind 2/10 Low
- Air quality 2/10 Low 1 unhealthy d/yr today · 1 by 30 yrs out
Nearby sold comps map
Loading sold comps map…
Walkable amenities ~0.75 mi
Loading nearby amenities…
Taxation est. · year 1
- Rental income
- $20,704
- − Mortgage interest
- −$16,239
- − Property taxes
- −$3,473
- − Insurance
- −$1,450
- − Repairs & maintenance
- −$1,656
- − Management
- −$1,656
- − Depreciation
- −$8,433
- Taxable loss
- −$12,204
- Est. tax savings @ 24.0%
- +$2,929
- After-tax cash flow
- $-3,881/yr
For passive investors: Depreciation is non-cash, so a rental often shows a tax loss while cash-flowing — sheltering income. Rental losses are passive: they offset passive income freely, and up to $25,000/yr can offset ordinary (W-2) income if you actively participate and your MAGI is under $100k (phasing out to $0 by $150k); unused losses carry forward. On sale, claimed depreciation is recaptured at up to 25%, and gains may owe capital-gains tax (a 1031 exchange can defer both). Figures are a year-1 estimate at your 24.0% rate — not tax advice; consult a CPA.
Schools (NCES district)
- District
- Millard Public Schools
- NCES district ID
- 3173740
- Math proficiency
- 58% ▼ -7.00%
- Reading proficiency
- 60% ▼ -6.00%
- Median HH income
- $81,146
- Composite
- 53.23/100
- National rank
- #1500
- State rank
- #13 of 111 in NE
Livability — Omaha
- Score
- 84/100
- State rank
- #7
- US rank
- #663
Category grades
Schools grade is shown separately in the Schools card above.
Census & demographics
- Census place
- Omaha, NE
- County
- Douglas County · 538,646 people
- City population
- 552,986
- Metro
- Omaha-Council Bluffs, NE-IA
- Population (ZIP)
- 24,277
- Household income
- $80,739
- Rent vs Own
- Severe rent burden
- 728.0
Population outlook (Douglas County) Hauer SSP2
- Today (2025)
- 625,245 people
- By 2030
- 661,613 · +5.8%
- By 2040
- 732,395 · +17.1%
- By 2050
- 801,988 · +28.3%
- By 2075
- 968,637 · +54.9%
- By 2100
- 1,101,871 · +76.2%
Race, ethnicity, and origin ACS 2023
- Neighborhood character
- Predominantly White (79%)
- Race & ethnicity
- White 79% Hispanic / Latino 9% Two or more races 7% Asian 5% Black 2%
- Hispanic origin (detail)
- Mexican 6%
- Common ancestry
- Romanian 4% Lithuanian 2% Portuguese 2%
- Foreign-born
- 9% · Canada, Vietnam, South Korea
- Languages at home
- 90% English-only · Spanish 5% Other Asian/Pacific 2% Other Indo-European 1%
Political lean MEDSL · Douglas
- 2024 margin
- D (+10.2) · D 54.4% · R 44.2% · Other 1.4%
- 2008→2024 swing
- +5.5pp toward D · 2008: 4.6pp · 2024: 10.2pp
- All cycles
- 2024: D+10.2 2020: D+11.3 2016: D+1.4 2012: R+4.3 2008: D+4.6
Not yet ingested
- Civics
- —
Market trends
- HPI YoY
- ▼ -240.79%
- Current HPI
- 231.568
- Rent YoY
- ▲ 3.58%
- Metro
- Omaha-Council Bluffs, NE-IA
- State GDP YoY
- ▲ 0.68%
- F500 in state
- 2
Industry mix (Fortune 500 HQ in NE)
| Industry | F500 HQs | Revenue |
|---|---|---|
| Conglomerate | 1 | $371B |
|
||
Price history
+241.1% since first listed29 events — show timeline
- 2026-05-12 Pending — GPRMLS
- 2026-05-08 Listed $289,900 GPRMLS
- 2026-04-27 Pending — GPRMLS
- 2026-04-27 Listing Removed — GPRMLS
- 2026-04-22 Listed $295,000 GPRMLS
- 2021-11-29 Listing Removed — GPRMLS
- 2021-11-09 Relisted — GPRMLS
- 2021-11-05 Pending — GPRMLS
- 2021-11-03 Listed $205,000 GPRMLS
- 2021-08-23 Pending — GPRMLS
- 2021-08-23 Listing Removed — GPRMLS
- 2021-08-20 Relisted — GPRMLS
- 2021-08-05 Pending — GPRMLS
- 2021-08-02 Price Changed $205,000 GPRMLS
- 2021-07-11 Price Changed $218,000 GPRMLS
- 2021-06-28 Price Changed $225,000 GPRMLS
- 2021-06-17 Price Changed $230,000 GPRMLS
- 2021-06-02 Listed $240,000 GPRMLS
- 2004-07-14 Sold (Public Records) $125,000 Public Records
- 2004-06-30 Sold (MLS) $125,000 GPRMLS
- 2004-04-29 Listing Removed — GPRMLS
- 2004-04-16 Listed $127,500 GPRMLS
- 2001-05-31 Sold (MLS) $102,000 GPRMLS
- 2001-04-21 Sold (Public Records) $102,000 Public Records
- 2001-04-21 Listing Removed — GPRMLS
- 2001-03-03 Listed $103,950 GPRMLS
- 1998-03-31 Sold (MLS) $85,000 GPRMLS
- 1998-02-09 Listing Removed — GPRMLS
- 1998-02-05 Listed $85,000 GPRMLS
Property tax history
+2.9%/yrLatest (2025): $3,473 · -3.9% YoY. Source: county tax records.
Cash-flow waterfall
monthlySold comps — $/sqft
last 12 mo · ≤1 miLoading sold comps…