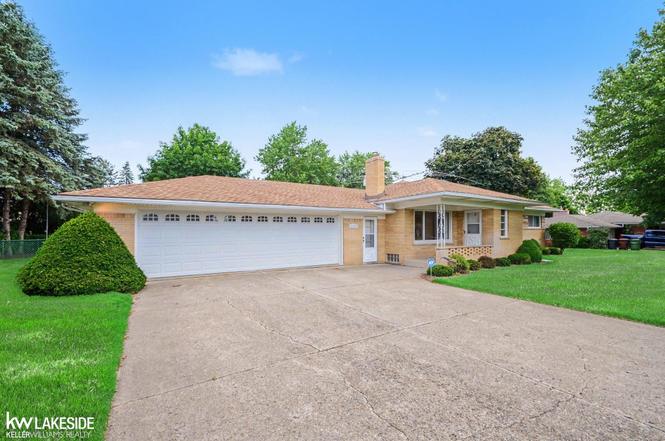
4455 Montgomery Rd · Shelby, MI
Flood risk 1/10 · Minimal
- FEMA flood zone
- X (unshaded)
- Chance of flooding over 30 yrs
- 0.0%
- Est. flood insurance / yr
- $473 – $860
Fire risk 1/10 · Minimal
- Est. fire insurance / yr
- $784 – $1,456
Heat risk 3/10 · Minor
- Hot days now (above 97°F)
- 7 days/yr
- Hot days in 30 yrs
- 15 days/yr
Wind risk 1/10 · Minimal
- Chance of severe wind over 30 yrs
- —
Air-quality risk 3/10 · Minor
- Unhealthy air days now
- 2 days/yr
- Unhealthy air days in 30 yrs
- 4 days/yr
Risk factors via First Street. Map © Google.
Why this score? — see what drove the D- grade
The composite is a weighted blend of 9 inputs, each scored 0–100. Each bar is that input's sub-score; the figure is the points it added to the 100-point composite (weight × sub-score).
- Cash flow +15.9/30.0
- DSCR +4.9/10.0
- Schools +4.1/10.0
- 1% rule +3.6/10.0
- Livability +3.5/5.0
- Rent growth +2.5/5.0
- Condition / age +2.5/5.0
- ARV discount +0.4/15.0
- Appreciation +0.0/10.0
$364,900
🖨 Deal sheet 📄 Offer letter ✓ Due diligence
Listing remarks MLS
HURRY! Rare opportunity to own a ranch home in Country Lane Estates Sub! Award winning Utica Schools! Estate sale on this extremely solid, well maintained home on a large almost half acre lot is ready for you to add your personal touches! They don't build them like this anymore!! Great layout w/ 3 large bedrooms, a spacious living room as well as a family room w/ Fireplace and door that leads to back patio & fenced pet area! The backyard offers a shed and plenty of space for a pool, garden, kids playscape or all of the above! A second entry door leads to a walkthrough mud room w/ storage cabinets and easy access to the garage & second full bath so no tracking dirt through the house! HUGE oversized 2.75 car garage! Estate believes there are hardwood floors under carpet(buyer to verify). Full block basement ready for your finishing touches! City water but sprinkler system is still run by the private well so no additional water bill to keep your grass or garden looking great! WHOLE HOME BRIGGS & STRATTON GENERATOR! Home Warranty included!
Key facts
- Ranch home
- Walkthrough mud room
- Large lot
Tags
Property features AI
Finance
- HOA & community: Homeowners association present
Exterior
- Parking: Attached garage with 2.5 spaces; Direct access; Garage door opener
- Utilities: Water: Private, Public, and Well listed; Sewer: Septic tank
- Home design: Single family residence; One level
- Construction: Brick construction; Block foundation; Built with above-grade finished area
- Exterior features: Patio; Porch; Fenced yard; Shed(s)
Interior
- Kitchen: Oven; Range; Refrigerator
- Bedrooms: Total of 7 rooms (bedroom count not specified)
- Flooring: Hardwood
- Bathrooms: 2 full bathrooms
- Heating & cooling: Forced air heating (natural gas); Central air conditioning
- Interior features: Window treatments; Fireplace in the family room; Full block basement
- Laundry & utility: Washer; Dryer; Gas water heater
Neighborhood map
What this means for you Summary
Snapshot
- This is a 3-bed/1.5-bath single-family listed at $365k.
Deal economics
- At list price, monthly cash flow is $177 ($2k/yr) — positive.
- The deal already cash-flows at list — no discount required.
- To meet the 1% rule (rent ≥ 1% of price), the offer needs to be $313k (14.1% below list).
- Recommended offer: $313k (14.1% below list) — sets the bar for 1% rule.
- Cap rate 6.9% vs local median 3.2% in Shelby — top-decile yield for the area; either an underpriced asset or a hidden risk that comps aren't pricing in. Stress-test before assuming the spread holds.
Location & tenants
- Location reads 70/100 on livability (#324 in MI) — a middle-class / working-renter tenant base. Strengths: crime A+, cost of living A+, housing A+; Watch: employment D+, schools F, amenities F.
- Utica Community Schools (suburban): math 38% / reading 53% proficiency, ranked #126 of 540 in MI (top 23%) — families likely to look elsewhere, expect single-tenant / working-renter base with shorter leases.
- Market conditions: 167 active listings in the ZIP; 2 comparable units currently listed for rent nearby; 1,321 units permitted in Macomb County in 2024 (86 in 5+ unit buildings).
Forward outlook
- Local home prices are declining (-3.0%/yr); year-one equity from $3k of loan paydown is wiped out by about $11k of value loss. Plan a longer hold.
- Macomb County population projected at +9% by 2050 — modest demand growth; plan on rents tracking national, not racing it.
Negotiation context
- Only 1 days on market — expect competitive offers; lowballing is unlikely to land.
- 2 sale attempts with the ask held roughly flat each time — persistent listings suggest the price (not the market) is what's stuck; bring a comps-based counter.
Risks & watch-outs
- Watch-outs: built in 1959 — expect roof / HVAC / electrical / plumbing capex.
Questions for the listing agent
- Built in 1959 — when were the roof, HVAC, electrical panel, plumbing, and water heater last replaced?
- Is there a deadline driving the sale (1031 exchange, divorce, estate, relocation)? That informs how much negotiation room exists.
- Schools are F-rated, which usually means shorter tenancies and higher turnover. Who's the typical renter profile here, and what's been the actual vacancy rate?
- The area grade is low — what's the realistic commute time and amenity access for the typical tenant pool here? Any planned neighborhood developments (good or bad) we should know about?
- What's the average days-on-market for RENTAL listings here right now (not sales)? A rising rental-DOM trend means longer vacancies and softer asking-rent achievability than the comps imply.
- What's the recent tenant-quality profile in this submarket — average credit score on applications, eviction rate, late-payment / NSF rate, and stable-employment percentage? A property-management company in the area should have these aggregated.
- How much new for-sale + rental construction is in the pipeline within 1–3 miles? Heavy new supply typically softens prices + rents 12–24 months out; constrained supply supports both.
Investment metrics
- 1% rule
- 0.86% ✗
- Cap rate
- 6.87%
- Cash-on-cash
- 2.08%
- DSCR
- 1.09
- GRM
- 9.7
CMA / ARV
- ARV (on-the-fly)
- $315,386
- Comps found
- 12
Show comp detail 12 sales within ~0.75 mi
| Address | Dist | Beds/Ba | Sqft | Sold | Price | $/sf | Match |
|---|---|---|---|---|---|---|---|
| 51575 Shelby Rd | 0.22mi | 3/1.0 | 1,550 (+1%) | 12mo | $305,000 | $197 | 76 |
| 5000 Robert St | 0.27mi | 3/1.0 | 1,442 (-6%) | 2mo | $200,000 | $139 | 74 |
| 4574 Fella St | 0.33mi | 3/2.0 | 1,613 (+5%) | 0mo | $332,500 | $206 | 73 |
| 52461 Pappy Ln | 0.35mi | 3/1.5 | 1,463 (-4%) | 7mo | $300,000 | $205 | 70 |
| 50709 Mile End Dr | 0.64mi | 3/1.5 | 1,512 (-1%) | 2mo | $335,000 | $222 | 66 |
| 51281 Shelby Rd | 0.35mi | 3/2.0 | 1,680 (+10%) | 4mo | $247,000 | $147 | 62 |
| 53121 Franklin Dr | 0.66mi | 3/2.0 | 1,541 (+1%) | 8mo | $385,000 | $250 | 59 |
| 50659 Dartmoor Dr | 0.69mi | 3/1.5 | 1,565 (+2%) | 8mo | $236,000 | $151 | 57 |
| 53383 Starlite Dr | 0.75mi | 3/1.5 | 1,548 (+1%) | 12mo | $385,000 | $249 | 54 |
| 52471 Ihla St | 0.44mi | 3/1.5 | 1,724 (+13%) | 9mo | $317,000 | $184 | 51 |
| 4259 Kingmont Dr | 0.57mi | 3/1.5 | 1,400 (-9%) | 11mo | $291,000 | $208 | 50 |
| 53216 Bruce Hill Dr | 0.69mi | 3/2.0 | 1,353 (-12%) | 12mo | $370,000 | $273 | 37 |
Match score weights: distance 35% · size 25% · config 20% · recency 20%. Top-matched comps best support the ARV.
Projected returns pro-forma
-3.0% appreciation · 3.0% rent growth · sell at horizon
- IRR
- -13.0%
- Equity multiple
- 0.53×
- Total profit
- $-47,963
- Equity at exit
- $54,408
- IRR
- -4.1%
- Equity multiple
- 0.73×
- Total profit
- $-27,634
- Equity at exit
- $31,550
Cash invested: $102,172 (down + closing). Projections, not guarantees.
Landlord ↔ Tenant lean methodology
- Overall (STATE)
- 62 Landlord-Friendly
- State Michigan
- 62 Landlord-Friendly · EVEN
- County
- — inherits STATE
- City
- — inherits STATE
ZIP-level market 48316
- Active inventory
- 167
- Price-to-rent
- 9.7×
Monthly cashflow live
- Estimated rent
- $3,135 medium interval (Pro) →
- Mortgage (P&I)
- −$1,914
- Tax from tax record
- −$234 /mo · $2,809/yr
- Insurance
- −$152
- HOA
- −$0
- Vacancy / Maint / Mgmt
- −$658
- Net cashflow
- $177
Break-even live
UW: 25.0% down · 7.5% · 30yr · 1.5% tax · 5.0% vac · 8.0% maint · 8.0% mgmt
Financing live
Cash to close
- Down payment
- $91,225
- Closing costs
- $10,947
- Reserves months
- —
- Total cash needed
- —
Loan-product check · same deal, 3 products live
Conventional
25% down · 7.5% · 30yr
- Down + closing
- —
- Monthly P&I
- —
- Monthly cashflow
- —
- DSCR
- —
- Eligible?
- —
Personal DTI + credit; lowest rate.
DSCR
20% down · 8.5% · 30yr
- Down + closing
- —
- Monthly P&I
- —
- Monthly cashflow
- —
- DSCR
- —
- Eligible?
- —
No personal income docs; deal must DSCR.
Hard money
10% down · 12.0% · 12mo
- Down + closing
- —
- Monthly P&I
- —
- Monthly cashflow
- —
- DSCR
- —
- Eligible?
- —
Short-term bridge; refi at stabilization.
Rent comps 2 comps
| Address | Beds | Baths | Sqft | Rent | $/sqft | DOM | Units | Dist |
|---|---|---|---|---|---|---|---|---|
| 6015 Brynthrop Dr Shelby Township, MI | 4.0 | 2.0 | 1800 | $2,450 | $1.36 | 4d | 1 | 0.77mi |
| 1880 E Avon Rd Rochester Hills, MI | 2.0 | 2.0 | 1294 | $4,470 | $3.45 | 2d | 1 | 1.49mi |
Listing history 2 events
-
2026-06-17remarks 691-char remark
-
2026-06-17$364,900 Active 1 DOM
ⓘ Source: listings_history table (triggers on properties + properties_extension) + one-shot
backfill from property_details.listing_events for pre-trigger history.
Tax reassessment forecast MI · Partial reset (capped growth)
- Current annual tax
- $2,809 · $234/mo
- Projected year-2 tax
- $4,214 · $351/mo
- Expected delta
- +$1,405/yr (+$117/mo · 50.0%)
ⓘ Screening estimate from a state-policy table — verify with the county assessor before closing.
Climate risk First Street
- Flood 1/10 Low FEMA zone X (unshaded) · 0% chance over 30 yrs
- Wildfire 1/10 Low
- Heat 3/10 Moderate 7 d/yr ≥97°F today · 15 d/yr by 30 yrs out
- Wind 1/10 Low
- Air quality 3/10 Moderate 2 unhealthy d/yr today · 4 by 30 yrs out
Nearby sold comps map
Loading sold comps map…
Walkable amenities ~0.75 mi
Loading nearby amenities…
Taxation est. · year 1
- Rental income
- $37,617
- − Mortgage interest
- −$20,440
- − Property taxes
- −$2,809
- − Insurance
- −$1,824
- − Repairs & maintenance
- −$3,009
- − Management
- −$3,009
- − Depreciation
- −$10,615
- Taxable loss
- −$4,091
- Est. tax savings @ 24.0%
- +$982
- After-tax cash flow
- $3,102/yr
For passive investors: Depreciation is non-cash, so a rental often shows a tax loss while cash-flowing — sheltering income. Rental losses are passive: they offset passive income freely, and up to $25,000/yr can offset ordinary (W-2) income if you actively participate and your MAGI is under $100k (phasing out to $0 by $150k); unused losses carry forward. On sale, claimed depreciation is recaptured at up to 25%, and gains may owe capital-gains tax (a 1031 exchange can defer both). Figures are a year-1 estimate at your 24.0% rate — not tax advice; consult a CPA.
Schools (NCES district)
- District
- Utica Community Schools
- NCES district ID
- 2634470
- Math proficiency
- 38% ▼ -13.00%
- Reading proficiency
- 53% ▼ -7.00%
- Median HH income
- $65,953
- Composite
- 40.52/100
- National rank
- #3709
- State rank
- #126 of 540 in MI
Livability — Shelby
- Score
- 70/100
- State rank
- #324
- US rank
- #7973
Category grades
Schools grade is shown separately in the Schools card above.
Census & demographics
- Population (ZIP)
- 28,355
Population outlook (Macomb County) Hauer SSP2
- Today (2025)
- 925,296 people
- By 2030
- 948,226 · +2.5%
- By 2040
- 983,961 · +6.3%
- By 2050
- 1,010,200 · +9.2%
- By 2075
- 1,076,222 · +16.3%
- By 2100
- 1,077,065 · +16.4%
Race, ethnicity, and origin ACS 2023
- Neighborhood character
- Predominantly White (89%)
- Race & ethnicity
- White 89% Hispanic / Latino 3% Two or more races 3% Asian 3% Black 2%
- Common ancestry
- Romanian 16% Lithuanian 4% Slovak 3%
- Foreign-born
- 12% · Canada, China, South Korea
- Languages at home
- 83% English-only · Other Indo-European 6% Russian/Polish/Slavic 4% Spanish 2%
Political lean MEDSL · Macomb
- 2024 margin
- R (+13.7) · D 42.2% · R 55.9% · Other 1.9%
- 2008→2024 swing
- -22.3pp toward R · 2008: 8.6pp · 2024: -13.7pp
- All cycles
- 2024: R+13.7 2020: R+8.1 2016: R+11.6 2012: D+4.0 2008: D+8.6
Not yet ingested
- Civics
- —
Market trends
- HPI YoY
- ▼ -200.39%
- Current HPI
- 186.8397
- Rent YoY
- —
- Metro
- —
- State GDP YoY
- ▲ 1.37%
- F500 in state
- 28
Industry mix (Fortune 500 HQ in MI)
| Industry | F500 HQs | Revenue |
|---|---|---|
| Automotive Parts | 3 | $48B |
|
||
| Automotive | 2 | $372B |
|
||
| Chemicals | 1 | $45B |
|
||
| Automotive Retail | 1 | $29B |
|
||
| Healthcare / Medical Devices | 1 | $23B |
|
||
| Automotive Technology | 1 | $20B |
|
||
Price history
+0.0% since first listed2 events — show timeline
- 2026-06-17 Listed $364,900 REALCOMP
- 2026-06-15 Listed $364,900 MiRealSource-MiMLS
Property tax history
+2.8%/yrLatest (2025): $2,809 · +2.9% YoY. Source: county tax records.
Cash-flow waterfall
monthlySold comps — $/sqft
last 12 mo · ≤1 miLoading sold comps…