 Multi-family
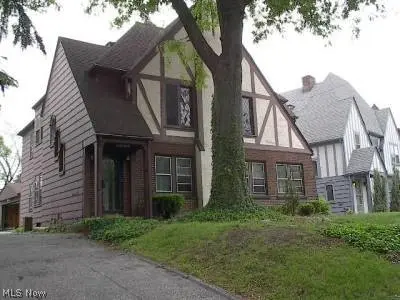
18323 Newell Rd · Shaker Heights, OH
Flood risk 1/10 · Minimal
- FEMA flood zone
- X (unshaded)
- Chance of flooding over 30 yrs
- 0.0%
- Est. flood insurance / yr
- $507 – $1,088
Fire risk 1/10 · Minimal
- Est. fire insurance / yr
- $713 – $1,323
Heat risk 2/10 · Minimal
- Hot days now (above 95°F)
- 7 days/yr
- Hot days in 30 yrs
- 16 days/yr
Wind risk 1/10 · Minimal
- Chance of severe wind over 30 yrs
- —
Air-quality risk 3/10 · Minor
- Unhealthy air days now
- 3 days/yr
- Unhealthy air days in 30 yrs
- 5 days/yr
Risk factors via First Street. Map © Google.
Why this score? — see what drove the B+ grade
The composite is a weighted blend of 9 inputs, each scored 0–100. Each bar is that input's sub-score; the figure is the points it added to the 100-point composite (weight × sub-score).
- Cash flow +30.0/30.0
- ARV discount +15.0/15.0
- 1% rule +10.0/10.0
- DSCR +10.0/10.0
- Schools +5.0/10.0
- Livability +4.5/5.0
- Rent growth +2.8/5.0
- Condition / age +2.5/5.0
- Appreciation +0.0/10.0
$259,900
🖨 Deal sheet (PDF) 📄 Offer letter ✓ Due diligence
Multi-family units
County records classify this as Multi-Family (2-4 Unit). Listing-text estimate: 1 unit. estimate disagrees with records
Listing remarks
Ready & Clean for New Owner to move in. Handsome Tudor. Well maintained . 1st floor: 2 Bedrooms, Sunroom for office, Bath, Oak floors. 2nd floor: 2 Bedrooms , Sunroom for office, Bath, Oak floors. 3rd Floor: rents separately - $650/mo, private entrance, 1 Bedroom, Living room, Full Bath. Updated hot water tanks, Forced air Furnaces. Gable roof 2 car Garage. Short distance to Van Aken Market District. Let Rental income pay most of you Housing expenses. Point of Sale inspection is all Clear. See supplements. rents separately.
Key facts
- Gable roof
- Sunroom for office
- Forced air furnaces
Tags
Property features AI
Finance
- Financial info: Owner pays exterior maintenance and trash collection; Tenants pay cable, electricity, heat, hot water, snow removal, sewer and water; Two leased residential units generating rental income ($1,105 and $1,225 actual rents)
- HOA & community: Playground nearby; Restaurants nearby; Street lights and sidewalks in neighborhood
Exterior
- Parking: Detached garage that faces the side; Driveway (shared driveway, private access available)
- Security: Smoke detectors; Carbon monoxide detectors
- Utilities: Public water; Public sewer
- Home design: Multi-story property (3 stories); Faces southwest; Single building
- Construction: Brick, shingle siding and wood siding exterior; Asphalt/fiberglass roof
- Exterior features: Rain gutters; Sloped front yard; Near public transit; Wooded lot
Interior
- Kitchen: Dishwasher; Range; Refrigerator
- Bedrooms: Two 2-bedroom units (each unit has 2 bedrooms)
- Bathrooms: Three full bathrooms (total for property); Each unit includes 1 bathroom
- Heating & cooling: Gas heating with forced air and baseboard
- Interior features: Built-in bookcases; Crown molding; Entrance foyer; Primary bedroom on main level; Storage space; Wood-frame windows with blinds
- Laundry & utility: Washer hookup in basement
Neighborhood map
What this means for you Summary
Snapshot
- This is a 6-bed/3.0-bath multifamily listed at $260k.
Deal economics
- At list price, monthly cash flow is $2k ($27k/yr) — positive.
- The deal already cash-flows at list — no discount required.
- Meets the 1% rule at list price ($6k rent vs $260k).
- Recommended offer: $252k (3.0% below list) — sets the bar for market timing.
- Cap rate 16.7% vs local median 2.5% in Shaker Heights — top-decile yield for the area; either an underpriced asset or a hidden risk that comps aren't pricing in. Stress-test before assuming the spread holds.
Location & tenants
- Location reads 89/100 on livability (#15 in OH, #134 nationally) — a professional / high-income tenant draw. Strengths: schools A+, crime A+, commute A+; Watch: amenities F.
- Shaker Heights City (suburban): math 50% / reading 63% proficiency, ranked #309 of 656 in OH (top 47%) — acceptable for families but not a draw, mixed tenant base, ~2y average lease.
- Market conditions: Rents rising (+1.1%/yr); 183 active listings in the ZIP; 1 comparable units currently listed for rent nearby; solid renter incomes; 1,441 units permitted in Cuyahoga County in 2024 (700 in 5+ unit buildings).
- At $5,686/mo this rent would consume 67% of the median local household income ($101k/yr) (locally 1294% of renters already pay >50% of income on rent) — very limited rent-growth headroom before tenants either downsize or default.
Forward outlook
- Local home prices are declining (-3.0%/yr); year-one equity from $2k of loan paydown is wiped out by about $8k of value loss. Plan a longer hold.
- Cuyahoga County population projected to shrink 8% by 2050 — rents likely to lag national; underwrite the cash flow, not the appreciation.
- At projected returns (-3.0% appreciation + 1.1% rent growth), your $73k cash investment doubles in ~4 years — after that, you're playing with house money.
Negotiation context
- It's been on market 45 days — a 3% lower offer ($252k) is reasonable based on typical stale-listing flexibility.
- Current owner paid $133k; list at $260k implies a 95% gain — meaningful room to come down on a strong offer.
Risks & watch-outs
- Watch-outs: property tax is 3.5% of price; built in 1927 — expect roof / HVAC / electrical / plumbing capex.
Questions for the listing agent
- It's been on market 45 days. Have you received any prior offers? Is the seller open to a 3% concession, seller financing, or rate buy-down credit?
- Built in 1927 — when were the roof, HVAC, electrical panel, plumbing, and water heater last replaced?
- Property tax is high relative to price — has the assessment been appealed recently, and will the sale trigger a re-assessment?
- Is there a deadline driving the sale (1031 exchange, divorce, estate, relocation)? That informs how much negotiation room exists.
- Schools are A-rated — typically a magnet for longer-tenancy family renters. What's the average tenant stay here, and is there a school-zone premium baked into asking?
- What's the average days-on-market for RENTAL listings here right now (not sales)? A rising rental-DOM trend means longer vacancies and softer asking-rent achievability than the comps imply.
- What's the recent tenant-quality profile in this submarket — average credit score on applications, eviction rate, late-payment / NSF rate, and stable-employment percentage? A property-management company in the area should have these aggregated.
- How much new apartment / multifamily construction is in the pipeline within 1–3 miles? Heavy new supply (>2% of stock underway) typically softens rents 12–24 months out; light construction supports rent growth.
Investment metrics
- 1% rule
- 2.19% ✓
- Cap rate
- 16.70%
- Cash-on-cash
- 37.18%
- DSCR
- 2.65
- GRM
- 3.8
CMA / ARV
- ARV (median comp)
- $316,336
- List price
- $259,900
- Delta
- -17.84%
- Verdict
- UNDERPRICED
- Comps
- 20 within 1.0 mi
Show comp detail 12 sales within ~0.75 mi
| Address | Dist | Beds/Ba | Sqft | Sold | Price | $/sf | Match |
|---|---|---|---|---|---|---|---|
| 17928 Winslow Rd | 0.16mi | 7/3.0 (+1) | 3,150 (-6%) | 3mo | $336,500 | $107 | 75 |
| 18717 Winslow Rd | 0.22mi | 5/3.0 (-1) | 3,454 (+3%) | 11mo | $341,750 | $99 | 71 |
| 18431 Newell Rd | 0.08mi | 7/3.0 (+1) | 3,655 (+9%) | 7mo | $281,500 | $77 | 70 |
| 18405 Newell Rd | 0.03mi | 7/3.5 (+1) | 3,094 (-8%) | 11mo | $310,000 | $100 | 70 |
| 18423 Winslow Rd | 0.14mi | 6/3.0 | 2,975 (-11%) | 13mo | $326,000 | $110 | 64 |
| 3553 Ingleside Rd | 0.22mi | 6/4.0 | 2,923 (-13%) | 7mo | $375,000 | $128 | 59 |
| 19229 Winslow Rd | 0.42mi | 6/3.0 | 3,037 (-9%) | 7mo | $390,000 | $128 | 59 |
| 19406 Chagrin Blvd | 0.43mi | 6/4.0 | 2,942 (-12%) | 2mo | $352,000 | $120 | 54 |
| 3454 Ingleside Rd | 0.24mi | 6/2.0 | 2,980 (-11%) | 17mo | $203,520 | $68 | 52 |
| 19835 Winslow Rd | 0.60mi | 6/4.0 | 3,000 (-10%) | 15mo | $349,900 | $117 | 38 |
| 3644 Rolliston Rd | 0.65mi | 6/3.0 | 3,000 (-10%) | 18mo | $250,000 | $83 | 38 |
| 3658 Strathavon Rd | 0.61mi | 7/3.0 (+1) | 2,940 (-12%) | 18mo | $226,250 | $77 | 32 |
Match score weights: distance 35% · size 25% · config 20% · recency 20%. Top-matched comps best support the ARV.
Projected returns pro-forma
-3.0% appreciation · 1.15% rent growth · sell at horizon
- IRR
- 30.8%
- Equity multiple
- 2.26×
- Total profit
- $91,440
- Equity at exit
- $38,752
- IRR
- 36.9%
- Equity multiple
- 4.09×
- Total profit
- $224,880
- Equity at exit
- $22,471
Cash invested: $72,772 (down + closing). Projections, not guarantees.
Landlord ↔ Tenant lean methodology
- Overall (STATE)
- 73 Landlord-Friendly
- State Ohio
- 73 Landlord-Friendly · R+6
- County
- — inherits STATE
- City
- — inherits STATE
ZIP-level market 44122
- Rents YoY
- 1.1%
- Active inventory
- 183
- Price-to-rent
- 16.0×
Monthly cashflow live
- Estimated rent
- $5,686 high interval (Pro) →
- Mortgage (P&I)
- −$1,363
- Tax from tax record
- −$766 /mo · $9,194/yr
- Insurance
- −$108
- HOA
- −$0
- Vacancy / Maint / Mgmt
- −$1,194
- Net cashflow
- $2,255
Break-even live
Sensitivity live
| Price | -10% $2,402 | -5% $2,328 | +0% $2,255 | +5% $2,181 | +10% $2,107 |
|---|---|---|---|---|---|
| Rent | -10% $1,805 | -5% $2,030 | +0% $2,255 | +5% $2,479 | +10% $2,704 |
| Rate | -1.0pp $2,385 | -0.5pp $2,321 | base $2,255 | +0.5pp $2,187 | +1.0pp $2,119 |
4-unit breakdown (identical units grouped — click to expand)
| Units | Beds | Baths | Est. rent |
|---|---|---|---|
| 2× units | 1 | 1 | $2,706 |
| #1 | 1 | 1 | $1,353 |
| #4 | 1 | 1 | $1,353 |
| 2× units | 2 | 1 | $2,978 |
| #2 | 2 | 1 | $1,489 |
| #3 | 2 | 1 | $1,489 |
| Total (4 units) | $5,686 | ||
UW: 25.0% down · 7.5% · 30yr · 1.5% tax · 5.0% vac · 8.0% maint · 8.0% mgmt
Financing live
Cash to close
- Down payment
- $64,975
- Closing costs
- $7,797
- Reserves months
- —
- Total cash needed
- —
Loan-product check · same deal, 3 products live
Conventional
25% down · 7.5% · 30yr
- Down + closing
- —
- Monthly P&I
- —
- Monthly cashflow
- —
- DSCR
- —
- Eligible?
- —
Personal DTI + credit; lowest rate.
DSCR
20% down · 8.5% · 30yr
- Down + closing
- —
- Monthly P&I
- —
- Monthly cashflow
- —
- DSCR
- —
- Eligible?
- —
No personal income docs; deal must DSCR.
Hard money
10% down · 12.0% · 12mo
- Down + closing
- —
- Monthly P&I
- —
- Monthly cashflow
- —
- DSCR
- —
- Eligible?
- —
Short-term bridge; refi at stabilization.
Rent comps 1 comps
| Address | Beds | Baths | Sqft | Rent | $/sqft | DOM | Units | Dist |
|---|---|---|---|---|---|---|---|---|
| 2975 Claremont Rd Shaker Heights, OH | 5.0 | 3.0 | 3241 | $3,200 | $0.99 | 12d | 1 | 0.80mi |
Listing history 18 events
-
2026-06-21days on market $259,900 Active 45 DOM
-
2026-06-18days on market $259,900 Active 42 DOM
-
2026-06-17pricedays on market $259,900 Active 41 DOM
-
2026-06-16days on market $268,900 Active 40 DOM
-
2026-06-15days on market $268,900 Active 39 DOM
-
2026-06-13days on market $268,900 Active 37 DOM
-
2026-06-13days on market $268,900 Active 36 DOM
-
2026-06-09days on market $268,900 Active 33 DOM
-
2026-06-08pricedays on market $268,900 Active 32 DOM
-
2026-06-07days on market $275,900 Active 31 DOM
-
2026-06-03days on market $275,900 Active 27 DOM
-
2026-06-02days on market $275,900 Active 26 DOM
-
2026-06-01days on market $275,900 Active 25 DOM
-
2026-05-31days on market $275,900 Active 24 DOM
-
2026-05-07$275,900 Active 535-char remark
-
1998-08-21soldstatus $133,000
-
1987-07-22soldstatus $122,000
-
1979-10-15soldstatus $81,000
ⓘ Source: listings_history table (triggers on properties + properties_extension) + one-shot
backfill from property_details.listing_events for pre-trigger history.
Tax reassessment forecast OH · Partial reset (capped growth)
- Current annual tax
- $9,194 · $766/mo
- Projected year-2 tax
- $9,194 · $766/mo
- Expected delta
- $0/yr ($0/mo · 0.0%)
ⓘ Screening estimate from a state-policy table — verify with the county assessor before closing.
Climate risk First Street
- Flood 1/10 Low FEMA zone X (unshaded) · 0% chance over 30 yrs
- Wildfire 1/10 Low
- Heat 2/10 Low 7 d/yr ≥95°F today · 16 d/yr by 30 yrs out
- Wind 1/10 Low
- Air quality 3/10 Moderate 3 unhealthy d/yr today · 5 by 30 yrs out
Nearby sold comps map
Loading sold comps map…
Walkable amenities ~0.75 mi
Loading nearby amenities…
Taxation est. · year 1
- Rental income
- $68,232
- − Mortgage interest
- −$14,558
- − Property taxes
- −$9,194
- − Insurance
- −$1,300
- − Repairs & maintenance
- −$5,459
- − Management
- −$5,459
- − Depreciation
- −$7,561
- Taxable income
- $24,702
- Est. tax owed @ 24.0%
- −$5,928
- After-tax cash flow
- $21,126/yr
For passive investors: Depreciation is non-cash, so a rental often shows a tax loss while cash-flowing — sheltering income. Rental losses are passive: they offset passive income freely, and up to $25,000/yr can offset ordinary (W-2) income if you actively participate and your MAGI is under $100k (phasing out to $0 by $150k); unused losses carry forward. On sale, claimed depreciation is recaptured at up to 25%, and gains may owe capital-gains tax (a 1031 exchange can defer both). Figures are a year-1 estimate at your 24.0% rate — not tax advice; consult a CPA.
Schools (NCES district)
- District
- Shaker Heights City
- NCES district ID
- 3904475
- Math proficiency
- 50% ▼ -16.00%
- Reading proficiency
- 63% ▼ -6.00%
- Median HH income
- $69,421
- Composite
- 49.98/100
- National rank
- #1928
- State rank
- #309 of 656 in OH
Livability — Shaker Heights
- Score
- 89/100
- State rank
- #15
- US rank
- #134
Category grades
Schools grade is shown separately in the Schools card above.
Census & demographics
- Census place
- Shaker Heights, OH
- County
- Cuyahoga County · 1,090,369 people
- City population
- 69,880
- Metro
- Cleveland-Elyria, OH
- Population (ZIP)
- 36,678
- Household income
- $101,230
- Rent vs Own
- Severe rent burden
- 1294.0
Population outlook (Cuyahoga County) Hauer SSP2
- Today (2025)
- 1,244,621 people
- By 2030
- 1,230,093 · -1.2%
- By 2040
- 1,189,108 · -4.5%
- By 2050
- 1,145,706 · -7.9%
- By 2075
- 1,076,557 · -13.5%
- By 2100
- 978,987 · -21.3%
Race, ethnicity, and origin ACS 2023
- Neighborhood character
- Diverse neighborhood (Simpson 0.59)
- Race & ethnicity
- White 56% Black 29% Asian 6% Two or more races 6% Hispanic / Latino 3%
- Common ancestry
- Romanian 6% Scotch-Irish 5% Italian 2%
- Foreign-born
- 12% · Canada, China
- Languages at home
- 85% English-only · Spanish 3% Other Indo-European 3% Chinese 2%
Political lean MEDSL · Cuyahoga
- 2024 margin
- Solid D (+31.5) · D 65.4% · R 33.9%
- 2008→2024 swing
- -7.4pp toward R · 2008: 38.9pp · 2024: 31.5pp
- All cycles
- 2024: D+31.5 2020: D+34.1 2016: D+35.0 2012: D+38.7 2008: D+38.9
Not yet ingested
- Civics
- —
Market trends
- HPI YoY
- ▼ -268.81%
- Current HPI
- 200.5087
- Rent YoY
- ▲ 1.15%
- Metro
- Cleveland-Elyria, OH
- State GDP YoY
- ▲ 1.98%
- F500 in state
- 48
Industry mix (Fortune 500 HQ in OH)
| Industry | F500 HQs | Revenue |
|---|---|---|
| Insurance | 3 | $145B |
|
||
| Industrial Machinery | 3 | $49B |
|
||
| Financial Services | 3 | $24B |
|
||
| Consumer Goods | 2 | $93B |
|
||
| Aerospace / Defense | 2 | $47B |
|
||
| Utilities | 2 | $33B |
|
||
Price history
+220.9% since first listed6 events — show timeline
- 2026-06-16 Price Changed $259,900 MLSNOW
- 2026-06-08 Price Changed $268,900 MLSNOW
- 2026-05-07 Listed $275,900 MLSNOW
- 1998-08-21 Sold (Public Records) $133,000 Public Records
- 1987-07-22 Sold (Public Records) $122,000 Public Records
- 1979-10-15 Sold (Public Records) $81,000 Public Records
Property tax history
+4.6%/yrLatest (2025): $9,194 · +13.2% YoY. Source: county tax records.
Cash-flow waterfall
monthlySold comps — $/sqft
last 12 mo · ≤1 miLoading sold comps…