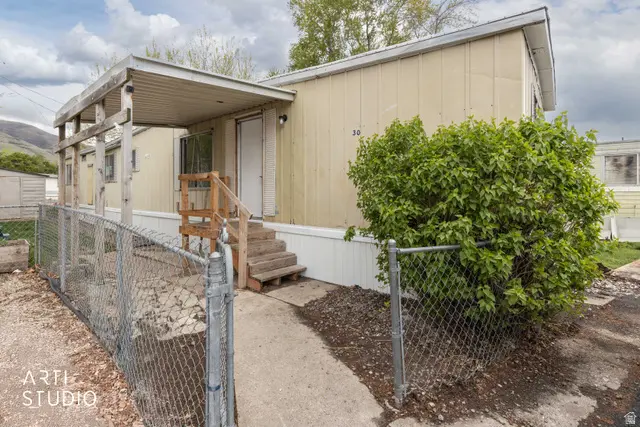
1060 S Main St #30 · Brigham City, UT
Flood risk 6/10 · Moderate
- FEMA flood zone
- X
- Chance of flooding over 30 yrs
- 0.97%
- Est. flood insurance / yr
- $435 – $905
Fire risk 5/10 · Moderate
- Est. fire insurance / yr
- $453 – $841
Heat risk 4/10 · Minor
- Hot days now (above threshold)
- 9 days/yr
- Hot days in 30 yrs
- 25 days/yr
Wind risk No data
- Chance of severe wind over 30 yrs
- —
Air-quality risk 3/10 · Minor
- Unhealthy air days now
- 3 days/yr
- Unhealthy air days in 30 yrs
- 3 days/yr
Risk factors via First Street. Map © Google.
Why this score? — see what drove the D+ grade
The composite is a weighted blend of 9 inputs, each scored 0–100. Each bar is that input's sub-score; the figure is the points it added to the 100-point composite (weight × sub-score).
- Cash flow +15.0/30.0
- ARV discount +7.5/15.0
- 1% rule +5.0/10.0
- DSCR +5.0/10.0
- Condition / age +3.8/5.0
- Schools +3.6/10.0
- Livability +3.4/5.0
- Rent growth +2.5/5.0
- Appreciation +0.0/10.0
$29,000
🖨 Deal sheet 📄 Offer letter ✓ Due diligence
Listing remarks
Motivated Seller and Priced to move at $29K. This Move-In Ready 3-Bedroom with Fresh Updates and Brand-New Roof Exciting opportunity to own an affordable, clean, and updated home in Brigham City. Located in the desirable Mountain View Manufactured Home Community, this bright 3-bedroom residence offers 1 full bath and 1 three-quarter bath, featuring all-new LVP flooring and fresh, neutral paint throughout-creating a low-maintenance space that's truly move-in ready. This manufactured home sits in a well-maintained community with a monthly lot rent of $700, making it an excellent option for first-time buyers, downsizers, or investors seeking value and convenience. Schedule your showing today t
Key facts
- All new lvp flooring
- Fresh updates
- Move in ready
Tags
Property features AI
Finance
- Other: Has view
- HOA & community: Homeowners association with a $700 monthly fee
Exterior
- Parking: Two open, uncovered parking spaces
- Utilities: Natural gas connected; Electricity connected; Water (culinary) connected; Public sewer connected
- Home design: Mobile home style; Single story; North-facing; Residential use
- Construction: Aluminum construction material; Aluminum and composition roof; Built in 1974; Built and standing condition
- Exterior features: Partially fenced lot; Covered deck; Mountain view; Near golf course; Storage shed(s)
Interior
- Bedrooms: Three main-level bedrooms; Primary bedroom on the first floor
- Bathrooms: One full bathroom; One three-quarter bathroom
- Heating & cooling: Forced air heating; Evaporative cooling
- Interior features: Primary bathroom with separate tub and shower; Ceiling fan; Single-level living
- Laundry & utility: Electric dryer hookup
Neighborhood map
What this means for you Summary
Snapshot
- This is a 3-bed/2.0-bath manufactured listed at $29k. Condition is rated good.
Deal economics
- At list price, monthly cash flow is $235 ($3k/yr) — positive.
- The deal already cash-flows at list — no discount required.
- Meets the 1% rule at list price ($1k rent vs $29k).
- Recommended offer: $27k (6.0% below list) — sets the bar for market timing.
Location & tenants
- Location reads 68/100 on livability (#115 in UT) — a middle-class / working-renter tenant base. Strengths: cost of living A+, housing A+; Watch: amenities F, commute F.
- Box Elder District (town): math 41% / reading 42% proficiency, ranked #38 of 80 in UT (top 48%) — families likely to look elsewhere, expect single-tenant / working-renter base with shorter leases.
- Zoned schools: Box Elder High (math 29% / reading 50%, grade F, #65 of 171 statewide, top 39%, 1,583 students, 23% FRL).
- Market conditions: 328 active listings in the ZIP; 2 comparable units currently listed for rent nearby; 461 units permitted in Box Elder County in 2024 (62 in 5+ unit buildings).
Forward outlook
- Local home prices are declining (-3.0%/yr); year-one equity from $200 of loan paydown is wiped out by about $870 of value loss. Plan a longer hold.
- Box Elder County population projected at +6% by 2050 — modest demand growth; plan on rents tracking national, not racing it.
- At projected returns (-3.0% appreciation + 3.0% rent growth), your $8k cash investment doubles in ~4 years — after that, you're playing with house money.
Negotiation context
- It's been on market 85 days — a 6% lower offer ($27k) is reasonable based on typical stale-listing flexibility.
Risks & watch-outs
- Watch-outs: HOA is 49% of rent.
- Climate carrying-cost: major flood risk; moderate wildfire risk — expect insurance premiums to compound above CPI over the hold.
Questions for the listing agent
- It's been on market 85 days. Have you received any prior offers? Is the seller open to a 6% concession, seller financing, or rate buy-down credit?
- Built in 1974 — when were the roof, HVAC, electrical panel, plumbing, and water heater last replaced?
- What does the HOA fee cover, when was the last increase, and are there any pending special assessments or reserve-fund shortfalls?
- Why hasn't it sold? Are there any deal-killer items the seller is aware of (foundation, flood, title, zoning, code violations)?
- Is there a deadline driving the sale (1031 exchange, divorce, estate, relocation)? That informs how much negotiation room exists.
- Schools are D-rated, which usually means shorter tenancies and higher turnover. Who's the typical renter profile here, and what's been the actual vacancy rate?
- The area grade is low — what's the realistic commute time and amenity access for the typical tenant pool here? Any planned neighborhood developments (good or bad) we should know about?
- What's the average days-on-market for RENTAL listings here right now (not sales)? A rising rental-DOM trend means longer vacancies and softer asking-rent achievability than the comps imply.
- What's the recent tenant-quality profile in this submarket — average credit score on applications, eviction rate, late-payment / NSF rate, and stable-employment percentage? A property-management company in the area should have these aggregated.
- How much new for-sale + rental construction is in the pipeline within 1–3 miles? Heavy new supply typically softens prices + rents 12–24 months out; constrained supply supports both.
Investment metrics
- 1% rule
- 4.96% ✓
- Cap rate
- 16.03%
- Cash-on-cash
- 34.76%
- DSCR
- 2.55
- GRM
- 1.7
CMA / ARV
No comps found within radius.
Projected returns pro-forma
-3.0% appreciation · 3.0% rent growth · sell at horizon
- IRR
- 31.2%
- Equity multiple
- 2.32×
- Total profit
- $10,735
- Equity at exit
- $4,324
- IRR
- 38.8%
- Equity multiple
- 4.75×
- Total profit
- $30,476
- Equity at exit
- $2,507
Cash invested: $8,120 (down + closing). Projections, not guarantees.
Landlord ↔ Tenant lean methodology
- Overall (STATE)
- 86 Strongly Landlord-Friendly
- State Utah
- 86 Strongly Landlord-Friendly · R+15
- County
- — inherits STATE
- City
- — inherits STATE
ZIP-level market 84302
- Active inventory
- 328
- Price-to-rent
- 1.7×
Monthly cashflow live
- Estimated rent
- $1,438 medium interval (Pro) →
- Mortgage (P&I)
- −$152
- Tax est. 1.5%
- −$36 /mo · $435/yr
- Insurance
- −$12
- HOA
- −$700
- Vacancy / Maint / Mgmt
- −$302
- Net cashflow
- $235
Break-even live
UW: 25.0% down · 7.5% · 30yr · 1.5% tax · 5.0% vac · 8.0% maint · 8.0% mgmt
Financing live
Cash to close
- Down payment
- $7,250
- Closing costs
- $870
- Reserves months
- —
- Total cash needed
- —
Loan-product check · same deal, 3 products live
Conventional
25% down · 7.5% · 30yr
- Down + closing
- —
- Monthly P&I
- —
- Monthly cashflow
- —
- DSCR
- —
- Eligible?
- —
Personal DTI + credit; lowest rate.
DSCR
20% down · 8.5% · 30yr
- Down + closing
- —
- Monthly P&I
- —
- Monthly cashflow
- —
- DSCR
- —
- Eligible?
- —
No personal income docs; deal must DSCR.
Hard money
10% down · 12.0% · 12mo
- Down + closing
- —
- Monthly P&I
- —
- Monthly cashflow
- —
- DSCR
- —
- Eligible?
- —
Short-term bridge; refi at stabilization.
Rent comps 2 comps
| Address | Beds | Baths | Sqft | Rent | $/sqft | DOM | Units | Dist |
|---|---|---|---|---|---|---|---|---|
| 747 S Main St Brigham City, UT | 1.0–2.0 | 1.0–2.0 | 860 | $1,600 | $1.86 | 23d | 4 | 0.56mi |
| 295 E 800 S Unit B405 Brigham City, UT | 2.0 | 1.0 | 947 | $1,250 | $1.32 | 23d | 1 | 0.62mi |
HOA detail
- Monthly dues
- $700 · $8,400/yr
Listing history 20 events
-
2026-06-18days on market $29,000 Active 85 DOM
-
2026-06-17days on market $29,000 Active 84 DOM
-
2026-06-16days on market $29,000 Active 83 DOM
-
2026-06-15days on market $29,000 Active 82 DOM
-
2026-06-14days on market $29,000 Active 80 DOM
-
2026-06-10days on market $29,000 Active 77 DOM
-
2026-06-09days on market $29,000 Active 76 DOM
-
2026-06-08days on market $29,000 Active 75 DOM
-
2026-06-07days on market $29,000 Active 74 DOM
-
2026-06-03days on market $29,000 Active 70 DOM
-
2026-06-02days on market $29,000 Active 69 DOM
-
2026-06-01days on market $29,000 Active 68 DOM
-
2026-05-31days on market $29,000 Active 67 DOM
-
2026-05-31pricedays on market $29,000 Active 66 DOM
-
2026-05-23price $25,000
-
2026-05-19price $27,000
-
2026-04-29price $29,000
-
2026-04-21price $32,000
-
2026-04-10price $35,000
-
2026-03-26$39,500 Active
ⓘ Source: listings_history table (triggers on properties + properties_extension) + one-shot
backfill from property_details.listing_events for pre-trigger history.
Climate risk First Street
- Flood 6/10 Major FEMA zone X · 97% chance over 30 yrs
- Wildfire 5/10 Major
- Heat 4/10 Moderate
- Air quality 3/10 Moderate 3 unhealthy d/yr today · 3 by 30 yrs out
Nearby sold comps map
Loading sold comps map…
Walkable amenities ~0.75 mi
Loading nearby amenities…
Taxation est. · year 1
- Rental income
- $17,250
- − Mortgage interest
- −$1,624
- − Property taxes
- −$435
- − Insurance
- −$145
- − Repairs & maintenance
- −$1,380
- − Management
- −$1,380
- − HOA
- −$8,400
- − Depreciation
- −$844
- Taxable income
- $3,042
- Est. tax owed @ 24.0%
- −$730
- After-tax cash flow
- $2,093/yr
For passive investors: Depreciation is non-cash, so a rental often shows a tax loss while cash-flowing — sheltering income. Rental losses are passive: they offset passive income freely, and up to $25,000/yr can offset ordinary (W-2) income if you actively participate and your MAGI is under $100k (phasing out to $0 by $150k); unused losses carry forward. On sale, claimed depreciation is recaptured at up to 25%, and gains may owe capital-gains tax (a 1031 exchange can defer both). Figures are a year-1 estimate at your 24.0% rate — not tax advice; consult a CPA.
Condition & rehab AI · 14 photos
This move-in ready 3-bedroom manufactured home in a well-maintained community has been updated with new flooring and paint, making it an excellent option for first-time buyers, downsizers, or investors seeking value and convenience.
Value-add opportunities
- Both Paint the exterior siding — Enhances curb appeal and value for both resale and rental.
Renovation cost estimate screening
Value-add ROI direction
- Both Paint the exterior siding — Enhances curb appeal and value for both resale and rental. ↑
ⓘ Cost ranges are severity-bucket heuristics (US national rule-of-thumb). Get contractor quotes + a written scope before underwriting a rehab budget.
Schools (NCES district)
- District
- Box Elder District
- NCES district ID
- 4900090
- Math proficiency
- 41% ▼ -4.00%
- Reading proficiency
- 42% ▼ -6.00%
- Median HH income
- $55,796
- Composite
- 36.3/100
- National rank
- #4698
- State rank
- #38 of 80 in UT
Livability — Brigham City
- Score
- 68/100
- State rank
- #115
- US rank
- #9530
Category grades
Schools grade is shown separately in the Schools card above.
Census & demographics
- Census place
- Brigham City, UT
- Population (ZIP)
- 26,711
Population outlook (Box Elder County) Hauer SSP2
- Today (2025)
- 55,528 people
- By 2030
- 56,848 · +2.4%
- By 2040
- 58,697 · +5.7%
- By 2050
- 59,164 · +6.5%
- By 2075
- 55,699 · +0.3%
- By 2100
- 45,932 · -17.3%
Race, ethnicity, and origin ACS 2023
- Neighborhood character
- Predominantly White (85%)
- Race & ethnicity
- White 85% Hispanic / Latino 10% Two or more races 8%
- Hispanic origin (detail)
- Mexican 7%
- Common ancestry
- Slovak 5% Italian 5% Portuguese 2%
- Foreign-born
- 3% · Canada
- Languages at home
- 93% English-only · Spanish 6%
Political lean MEDSL · Box Elder
- 2024 margin
- Solid R (+60.8) · D 18.2% · R 79.0% · Other 2.7%
- 2008→2024 swing
- +1.7pp toward D · 2008: -62.5pp · 2024: -60.8pp
- All cycles
- 2024: R+60.8 2020: R+63.2 2016: R+51.4 2012: R+78.2 2008: R+62.5
Not yet ingested
- Civics
- —
Market trends
- HPI YoY
- ▼ -256.79%
- Current HPI
- 259.4008
- Rent YoY
- —
- Metro
- —
- State GDP YoY
- ▲ 3.54%
- F500 in state
- 2
Industry mix (Fortune 500 HQ in UT)
| Industry | F500 HQs | Revenue |
|---|---|---|
| Financial Services | 1 | $3B |
|
||
Price history
-36.7% since first listed6 events — show timeline
- 2026-05-23 Price Changed $25,000 WFRMLS
- 2026-05-19 Price Changed $27,000 WFRMLS
- 2026-04-29 Price Changed $29,000 WFRMLS
- 2026-04-21 Price Changed $32,000 WFRMLS
- 2026-04-10 Price Changed $35,000 WFRMLS
- 2026-03-26 Listed $39,500 WFRMLS
Cash-flow waterfall
monthlySold comps — $/sqft
last 12 mo · ≤1 miLoading sold comps…