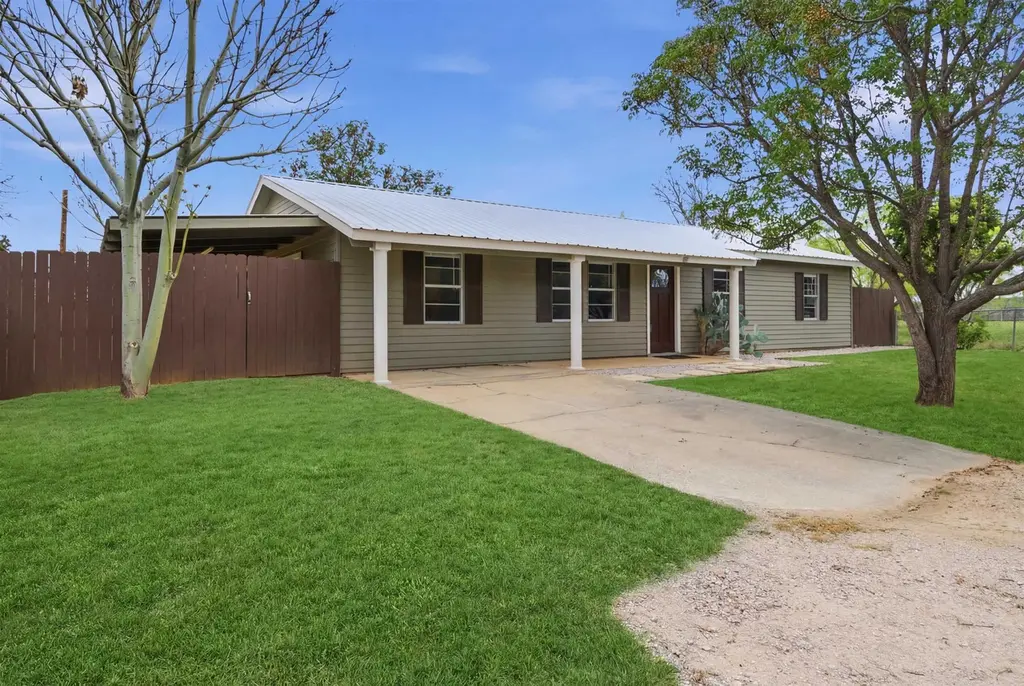
611 Pecan Ln · Cottonwood Shores, TX
Flood risk 1/10 · Minimal
- FEMA flood zone
- X (unshaded)
- Chance of flooding over 30 yrs
- 0.0%
- Est. flood insurance / yr
- $507 – $1,088
Fire risk 5/10 · Moderate
- Est. fire insurance / yr
- $1,222 – $2,270
Heat risk 8/10 · Major
- Hot days now (above 107°F)
- 7 days/yr
- Hot days in 30 yrs
- 23 days/yr
Wind risk 6/10 · Moderate
- Chance of severe wind over 30 yrs
- 58.0%
Air-quality risk 1/10 · Minimal
- Unhealthy air days now
- 0 days/yr
- Unhealthy air days in 30 yrs
- 0 days/yr
Risk factors via First Street. Map © Google.
Why this score? — see what drove the D+ grade
The composite is a weighted blend of 9 inputs, each scored 0–100. Each bar is that input's sub-score; the figure is the points it added to the 100-point composite (weight × sub-score).
- ARV discount +15.0/15.0
- Cash flow +10.5/30.0
- Appreciation +5.5/10.0
- 1% rule +3.5/10.0
- Livability +3.5/5.0
- DSCR +3.0/10.0
- Schools +3.0/10.0
- Rent growth +2.5/5.0
- Condition / age +2.5/5.0
$224,500
🖨 Deal sheet 📄 Offer letter ✓ Due diligence
Listing remarks MLS
Super Cute Move-In ready 3 bedroom 1 bath plus 12' X 17' bonus room!!!! All plumbing and electrical updated in the last 2 years along with tile flooring, Interior paint and lighting. Bathroom and Kitchen updated with tile and Granite. Big back yard with nice trees. This place is ready for you to call it HOME. Access to Lake Marble Falls just a few blocks away. Several great restaurants and amenities of Marble Falls near by. Just minutes from Lake LBJ.
Key facts
- Plumbing updated
- Electrical updated
- Lighting
Tags
Neighborhood map
What this means for you Summary
Snapshot
- This is a 3-bed/1.0-bath single-family listed at $224k.
Deal economics
- At list price, monthly cash flow is $-114 ($-1k/yr) — negative.
- To cash-flow at today's rent, offer at most $204k (9.0% below list).
- To meet the 1% rule (rent ≥ 1% of price), the offer needs to be $191k (14.9% below list).
- Recommended offer: $191k (14.9% below list) — sets the bar for 1% rule.
- Cap rate 5.7% vs local median 4.2% in Cottonwood Shores — top-decile yield for the area; either an underpriced asset or a hidden risk that comps aren't pricing in. Stress-test before assuming the spread holds.
Location & tenants
- Location reads 70/100 on livability (#385 in TX) — a middle-class / working-renter tenant base. Strengths: crime A+, cost of living A+, housing A+; Watch: schools F, amenities F, commute F.
- Marble Falls ISD (town): math 32% / reading 38% proficiency, ranked #511 of 826 in TX (top 62%) — families likely to look elsewhere, expect single-tenant / working-renter base with shorter leases.
- Market conditions: 1223 active listings in the ZIP; 5 comparable units currently listed for rent nearby; rentals at typical pace (median 24d on market — plan ~3-4 weeks tenant-placement turnaround); 40% of comp listings sitting > 30 days — soft ceiling on asking rent; solid renter incomes; 891 units permitted in Burnet County in 2024 (76 in 5+ unit buildings).
Forward outlook
- In year one you build about $4k of equity ($2k loan paydown + $2k appreciation (0.9% local appreciation)).
- Burnet County population projected at +22% by 2050 — long-run rental-demand tailwind backs the buy-and-hold thesis.
- By year 9, paydown + projected appreciation supports a ~$34k cash-out refi (75% LTV) — recoverable capital for the next deal without selling this one.
Negotiation context
- It's been on market 90 days — a 6% lower offer ($211k) is reasonable based on typical stale-listing flexibility.
- 2 sale attempts since 3y ago; this cycle's ask has dropped $16k (6%) from the opening price — seller is motivated, your offer sets the floor, not the list.
Risks & watch-outs
- Climate carrying-cost: major wind risk, 58% chance of damaging wind over 30y; moderate wildfire risk; extreme-heat days projected 7→23/yr by 2055 (HVAC capex compounding) — expect insurance premiums to compound above CPI over the hold.
Questions for the listing agent
- What do current leases actually rent for vs. the listed asking? Can we see a recent rent roll and the last 12 months of T-12 income?
- It's been on market 90 days. Have you received any prior offers? Is the seller open to a 15% concession, seller financing, or rate buy-down credit?
- Why hasn't it sold? Are there any deal-killer items the seller is aware of (foundation, flood, title, zoning, code violations)?
- Is there a deadline driving the sale (1031 exchange, divorce, estate, relocation)? That informs how much negotiation room exists.
- Schools are F-rated, which usually means shorter tenancies and higher turnover. Who's the typical renter profile here, and what's been the actual vacancy rate?
- The area grade is low — what's the realistic commute time and amenity access for the typical tenant pool here? Any planned neighborhood developments (good or bad) we should know about?
- What's the average days-on-market for RENTAL listings here right now (not sales)? A rising rental-DOM trend means longer vacancies and softer asking-rent achievability than the comps imply.
- What's the recent tenant-quality profile in this submarket — average credit score on applications, eviction rate, late-payment / NSF rate, and stable-employment percentage? A property-management company in the area should have these aggregated.
- How much new for-sale + rental construction is in the pipeline within 1–3 miles? Heavy new supply typically softens prices + rents 12–24 months out; constrained supply supports both.
Investment metrics
- 1% rule
- 0.85% ✗
- Cap rate
- 5.68%
- Cash-on-cash
- -2.19%
- DSCR
- 0.90
- GRM
- 9.8
CMA / ARV
- ARV (median comp)
- $308,694
- List price
- $224,500
- Delta
- -27.27%
- Verdict
- UNDERPRICED
- Comps
- 20 within 1.0 mi
Show comp detail 12 sales within ~0.75 mi
| Address | Dist | Beds/Ba | Sqft | Sold | Price | $/sf | Match |
|---|---|---|---|---|---|---|---|
| 600 Fir Ln | 0.12mi | 3/2.0 | 1,392 (-5%) | 2mo | $299,999 | $216 | 80 |
| 614 Maple Ln | 0.25mi | 3/2.0 | 1,492 (+2%) | 10mo | $344,900 | $231 | 73 |
| 802 Magnolia Ln | 0.54mi | 3/2.0 | 1,442 (-2%) | 2mo | $189,000 | $131 | 67 |
| 724 Cypress Ln | 0.35mi | 3/2.0 | 1,356 (-7%) | 3mo | $245,000 | $181 | 64 |
| 641 Magnolia Ln | 0.15mi | 3/2.0 | 1,350 (-8%) | 15mo | $314,900 | $233 | 63 |
| 3915 Willow Dr | 0.25mi | 2/1.5 (-1) | 1,320 (-10%) | 7mo | $224,999 | $170 | 59 |
| 650 Aspen Ln | 0.21mi | 3/2.0 | 1,253 (-14%) | 8mo | $274,900 | $219 | 56 |
| 652 Aspen Ln | 0.21mi | 3/2.0 | 1,253 (-14%) | 11mo | $315,000 | $251 | 53 |
| 651 Birch Ln | 0.23mi | 3/2.0 | 1,636 (+12%) | 16mo | $334,000 | $204 | 52 |
| 746 Pecan Ln | 0.45mi | 3/2.0 | 1,262 (-14%) | 4mo | $250,000 | $198 | 48 |
| 723 Driftwood Ln | 0.40mi | 3/2.0 | 1,265 (-14%) | 15mo | $265,000 | $209 | 42 |
| 833 Magnolia Ln | 0.69mi | 3/2.0 | 1,335 (-9%) | 13mo | $309,900 | $232 | 38 |
Match score weights: distance 35% · size 25% · config 20% · recency 20%. Top-matched comps best support the ARV.
Projected returns pro-forma
0.95% appreciation · 3.0% rent growth · sell at horizon
- IRR
- -1.1%
- Equity multiple
- 0.94×
- Total profit
- $-3,619
- Equity at exit
- $76,003
- IRR
- 3.8%
- Equity multiple
- 1.46×
- Total profit
- $29,180
- Equity at exit
- $100,509
Cash invested: $62,860 (down + closing). Projections, not guarantees.
Landlord ↔ Tenant lean methodology
- Overall (STATE)
- 87 Strongly Landlord-Friendly
- State Texas
- 87 Strongly Landlord-Friendly · R+5
- County
- — inherits STATE
- City
- — inherits STATE
ZIP-level market 78657
- Home prices YoY
- 0.4%
- Active inventory
- 1223
- Price-to-rent
- 9.8×
Monthly cashflow live
- Estimated rent
- $1,910 high interval (Pro) →
- Mortgage (P&I)
- −$1,177
- Tax from tax record
- −$353 /mo · $4,230/yr
- Insurance
- −$94
- HOA
- −$0
- Vacancy / Maint / Mgmt
- −$401
- Net cashflow
- $-114
Break-even live
UW: 25.0% down · 7.5% · 30yr · 1.5% tax · 5.0% vac · 8.0% maint · 8.0% mgmt
Financing live
Cash to close
- Down payment
- $56,125
- Closing costs
- $6,735
- Reserves months
- —
- Total cash needed
- —
Loan-product check · same deal, 3 products live
Conventional
25% down · 7.5% · 30yr
- Down + closing
- —
- Monthly P&I
- —
- Monthly cashflow
- —
- DSCR
- —
- Eligible?
- —
Personal DTI + credit; lowest rate.
DSCR
20% down · 8.5% · 30yr
- Down + closing
- —
- Monthly P&I
- —
- Monthly cashflow
- —
- DSCR
- —
- Eligible?
- —
No personal income docs; deal must DSCR.
Hard money
10% down · 12.0% · 12mo
- Down + closing
- —
- Monthly P&I
- —
- Monthly cashflow
- —
- DSCR
- —
- Eligible?
- —
Short-term bridge; refi at stabilization.
Rent comps 5 comps
| Address | Beds | Baths | Sqft | Rent | $/sqft | DOM | Units | Dist |
|---|---|---|---|---|---|---|---|---|
| 723 Pecan Ln Cottonwood Shores, TX | 2.0 | 1.0 | 1027 | $1,400 | $1.36 | 44d | 1 | 0.32mi |
| 851 Aspen Ln Cottonwood Shores, TX | 3.0 | 1.0 | 1440 | $1,692 | $1.18 | 43d | 1 | 0.76mi |
| 851 Aspen Ln Cottonwood Shores, TX | 3.0 | 1.0 | 1440 | $1,566 | $1.09 | 23d | 1 | 0.76mi |
| 201 36th St Horseshoe Bay, TX | 3.0 | 2.0 | 1650 | $2,300 | $1.39 | 20d | 1 | 1.44mi |
| 342 Columbine St Meadowlakes, TX | 3.0 | 2.0 | 1786 | $2,195 | $1.23 | 4d | 1 | 1.48mi |
Listing history 23 events
-
2026-06-16days on market $224,500 Active 90 DOM
-
2026-06-15days on market $224,500 Active 89 DOM
-
2026-06-13days on market $224,500 Active 87 DOM
-
2026-06-13days on market $224,500 Active 86 DOM
-
2026-06-09days on market $224,500 Active 83 DOM
-
2026-06-08days on market $224,500 Active 82 DOM
-
2026-06-07days on market $224,500 Active 81 DOM
-
2026-06-05days on market $224,500 Active 78 DOM
-
2026-06-03days on market $224,500 Active 77 DOM
-
2026-06-01days on market $224,500 Active 75 DOM
-
2026-05-31days on market $224,500 Active 74 DOM
-
2026-05-08price $224,500 455-char remark
Show marketing remark (455 chars)
Super Cute Move-In ready 3 bedroom 1 bath plus 12' X 17' bonus room!!!! All plumbing and electrical updated in the last 2 years along with tile flooring, Interior paint and lighting. Bathroom and Kitchen updated with tile and Granite. Big back yard with nice trees. This place is ready for you to call it HOME. Access to Lake Marble Falls just a few blocks away. Several great restaurants and amenities of Marble Falls near by. Just minutes from Lake LBJ.
-
2026-04-14price $229,000 455-char remark
Show marketing remark (455 chars)
Super Cute Move-In ready 3 bedroom 1 bath plus 12' X 17' bonus room!!!! All plumbing and electrical updated in the last 2 years along with tile flooring, Interior paint and lighting. Bathroom and Kitchen updated with tile and Granite. Big back yard with nice trees. This place is ready for you to call it HOME. Access to Lake Marble Falls just a few blocks away. Several great restaurants and amenities of Marble Falls near by. Just minutes from Lake LBJ.
-
2026-04-02price $235,000 455-char remark
Show marketing remark (455 chars)
Super Cute Move-In ready 3 bedroom 1 bath plus 12' X 17' bonus room!!!! All plumbing and electrical updated in the last 2 years along with tile flooring, Interior paint and lighting. Bathroom and Kitchen updated with tile and Granite. Big back yard with nice trees. This place is ready for you to call it HOME. Access to Lake Marble Falls just a few blocks away. Several great restaurants and amenities of Marble Falls near by. Just minutes from Lake LBJ.
-
2026-03-18$240,000 Active 455-char remark
Show marketing remark (455 chars)
Super Cute Move-In ready 3 bedroom 1 bath plus 12' X 17' bonus room!!!! All plumbing and electrical updated in the last 2 years along with tile flooring, Interior paint and lighting. Bathroom and Kitchen updated with tile and Granite. Big back yard with nice trees. This place is ready for you to call it HOME. Access to Lake Marble Falls just a few blocks away. Several great restaurants and amenities of Marble Falls near by. Just minutes from Lake LBJ.
-
2024-11-05price $260,000
-
2024-08-05price $270,000
-
2024-07-05price $280,000
-
2023-03-16soldstatus
-
2023-03-15soldstatus
-
2023-01-10$199,000
-
2021-03-16soldstatus
-
2002-09-17soldstatus
ⓘ Source: listings_history table (triggers on properties + properties_extension) + one-shot
backfill from property_details.listing_events for pre-trigger history.
Tax reassessment forecast TX · Resets to sale price
- Current annual tax
- $4,230 · $353/mo
- Projected year-2 tax
- $4,230 · $353/mo
- Expected delta
- $0/yr ($0/mo · 0.0%)
ⓘ Screening estimate from a state-policy table — verify with the county assessor before closing.
Climate risk First Street
- Flood 1/10 Low FEMA zone X (unshaded) · 0% chance over 30 yrs
- Wildfire 5/10 Major
- Heat 8/10 Severe 7 d/yr ≥107°F today · 23 d/yr by 30 yrs out
- Wind 6/10 Major 58% chance of damaging wind over 30 yrs
- Air quality 1/10 Low 0 unhealthy d/yr today · 0 by 30 yrs out
Nearby sold comps map
Loading sold comps map…
Walkable amenities ~0.75 mi
Loading nearby amenities…
Taxation est. · year 1
- Rental income
- $22,920
- − Mortgage interest
- −$12,575
- − Property taxes
- −$4,230
- − Insurance
- −$1,122
- − Repairs & maintenance
- −$1,834
- − Management
- −$1,834
- − Depreciation
- −$6,531
- Taxable loss
- −$5,206
- Est. tax savings @ 24.0%
- +$1,250
- After-tax cash flow
- $-124/yr
For passive investors: Depreciation is non-cash, so a rental often shows a tax loss while cash-flowing — sheltering income. Rental losses are passive: they offset passive income freely, and up to $25,000/yr can offset ordinary (W-2) income if you actively participate and your MAGI is under $100k (phasing out to $0 by $150k); unused losses carry forward. On sale, claimed depreciation is recaptured at up to 25%, and gains may owe capital-gains tax (a 1031 exchange can defer both). Figures are a year-1 estimate at your 24.0% rate — not tax advice; consult a CPA.
Schools (NCES district)
- District
- Marble Falls ISD
- NCES district ID
- 4829010
- Math proficiency
- 32% ▼ -8.00%
- Reading proficiency
- 38% ▼ -4.00%
- Median HH income
- $49,663
- Composite
- 30.3/100
- National rank
- #6278
- State rank
- #511 of 826 in TX
Livability — Cottonwood Shores
- Score
- 70/100
- State rank
- #385
- US rank
- #8036
Category grades
Schools grade is shown separately in the Schools card above.
Census & demographics
- Census place
- Cottonwood Shores, TX
- County
- Llano County · 16,310 people
- Metro
- nan
- Population (ZIP)
- 7,591
- Household income
- $91,452
- Rent vs Own
- Severe rent burden
- 45.0
Population outlook (Burnet County) Hauer SSP2
- Today (2025)
- 50,492 people
- By 2030
- 52,995 · +5.0%
- By 2040
- 57,528 · +13.9%
- By 2050
- 61,444 · +21.7%
- By 2075
- 71,098 · +40.8%
- By 2100
- 74,634 · +47.8%
Race, ethnicity, and origin ACS 2023
- Neighborhood character
- Predominantly White (80%)
- Race & ethnicity
- White 80% Hispanic / Latino 16% Two or more races 8% Asian 1%
- Hispanic origin (detail)
- Mexican 14%
- Common ancestry
- Slovak 3% Portuguese 3% Italian 2%
- Foreign-born
- 8% · Canada
- Languages at home
- 87% English-only · Spanish 12% Other Indo-European 1%
Political lean MEDSL · Burnet
- 2024 margin
- Solid R (+55.7) · D 21.7% · R 77.4%
- 2008→2024 swing
- -11.6pp toward R · 2008: -44.1pp · 2024: -55.7pp
- All cycles
- 2024: R+55.7 2020: R+53.1 2016: R+56.8 2012: R+54.6 2008: R+44.1
Not yet ingested
- Civics
- —
Market trends
- HPI YoY
- ▲ 0.95%
- Current HPI
- 229.9918
- Rent YoY
- —
- Metro
- nan
- State GDP YoY
- ▲ 3.95%
- F500 in state
- 110
Industry mix (Fortune 500 HQ in TX)
| Industry | F500 HQs | Revenue |
|---|---|---|
| Energy | 16 | $1,198B |
|
||
| Technology | 5 | $198B |
|
||
| Engineering / Construction | 4 | $72B |
|
||
| Energy Services | 3 | $60B |
|
||
| Utilities | 3 | $41B |
|
||
| Healthcare | 2 | $330B |
|
||
Price history
+12.8% since first listed12 events — show timeline
- 2026-05-08 Price Changed $224,500 HLMLS as distributed by MLS GRID
- 2026-04-14 Price Changed $229,000 HLMLS as distributed by MLS GRID
- 2026-04-02 Price Changed $235,000 HLMLS as distributed by MLS GRID
- 2026-03-18 Listed $240,000 HLMLS as distributed by MLS GRID
- 2024-11-05 Price Changed $260,000 HLMLS as distributed by MLS GRID
- 2024-08-05 Price Changed $270,000 HLMLS as distributed by MLS GRID
- 2024-07-05 Price Changed $280,000 HLMLS as distributed by MLS GRID
- 2023-03-16 Sold (Public Records) — Public Records
- 2023-03-15 Sold (MLS) — HLMLS as distributed by MLS GRID
- 2023-01-10 Listed $199,000 HLMLS as distributed by MLS GRID
- 2021-03-16 Sold (Public Records) — Public Records
- 2002-09-17 Sold (Public Records) — Public Records
Property tax history
+8.3%/yrLatest (2026): $4,230 · +0.0% YoY. Source: county tax records.
Cash-flow waterfall
monthlySold comps — $/sqft
last 12 mo · ≤1 miLoading sold comps…