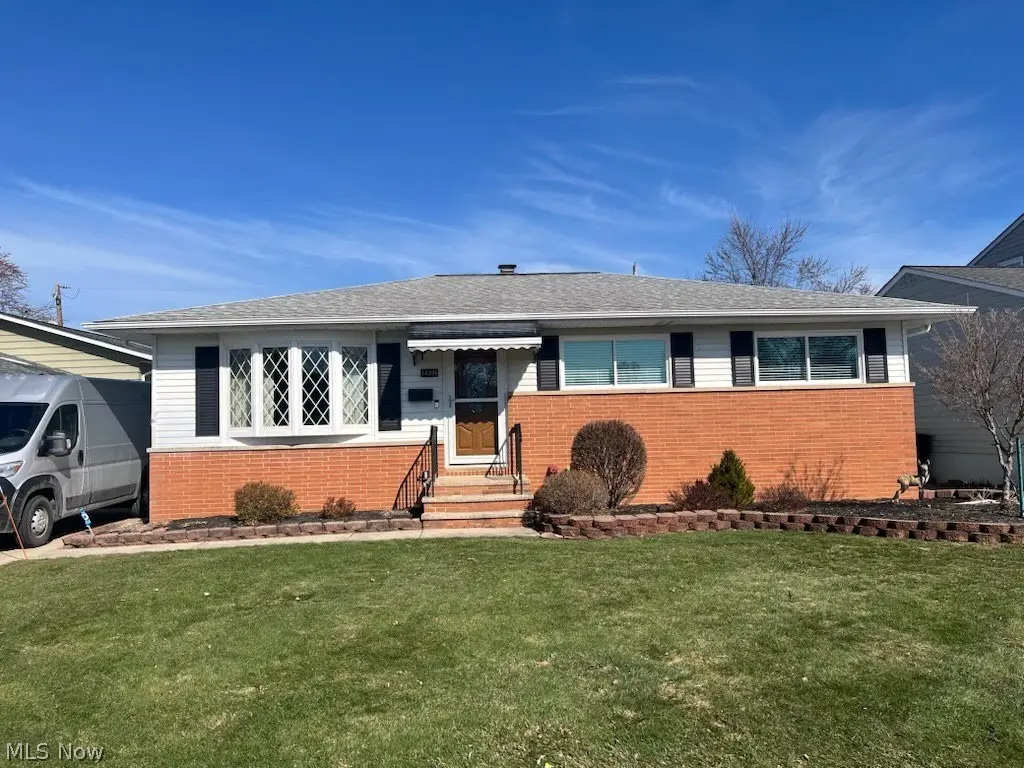
14396 Park Dr · Brook Park, OH
Flood risk 1/10 · Minimal
- FEMA flood zone
- X (unshaded)
- Chance of flooding over 30 yrs
- 0.0%
- Est. flood insurance / yr
- $473 – $860
Fire risk 1/10 · Minimal
- Est. fire insurance / yr
- $713 – $1,323
Heat risk 3/10 · Minor
- Hot days now (above 95°F)
- 7 days/yr
- Hot days in 30 yrs
- 17 days/yr
Wind risk 1/10 · Minimal
- Chance of severe wind over 30 yrs
- —
Air-quality risk 2/10 · Minimal
- Unhealthy air days now
- 1 days/yr
- Unhealthy air days in 30 yrs
- 3 days/yr
Risk factors via First Street. Map © Google.
Why this score? — see what drove the C grade
The composite is a weighted blend of 9 inputs, each scored 0–100. Each bar is that input's sub-score; the figure is the points it added to the 100-point composite (weight × sub-score).
- Cash flow +19.8/30.0
- ARV discount +15.0/15.0
- DSCR +6.3/10.0
- 1% rule +5.0/10.0
- Schools +4.4/10.0
- Livability +3.7/5.0
- Rent growth +2.5/5.0
- Condition / age +2.5/5.0
- Appreciation +0.0/10.0
$215,000
🖨 Deal sheet (PDF) 📄 Offer letter ✓ Due diligence
Listing remarks
Prepare to be moved! Welcome to 14396 Park Drive, a charming home nestled in the heart of Brook Park, Ohio. This inviting 3-bedroom, 2-bath residence offers 1,140 square feet of comfortable living space, perfect for both relaxing and entertaining. Bright, well-proportioned rooms and a functional layout create a warm, welcoming feel, while the cozy bedrooms provide the perfect retreat at the end of the day. Whether you're a first-time buyer or looking to downsize, this home blends comfort, convenience, and classic appeal.
Key facts
- 7,405 sq ft lot
- 2 garage spots
- Built 1965
Neighborhood map
What this means for you Summary
Snapshot
- This is a 3-bed/1.5-bath single-family listed at $215k.
Deal economics
- At list price, monthly cash flow is $256 ($3k/yr) — positive.
- The deal already cash-flows at list — no discount required.
- To meet the 1% rule (rent ≥ 1% of price), the offer needs to be $214k (0.4% below list).
- Recommended offer: $214k (0.4% below list) — sets the bar for 1% rule.
- Cap rate 7.7% vs local median 5.2% in Brook Park — top-decile yield for the area; either an underpriced asset or a hidden risk that comps aren't pricing in. Stress-test before assuming the spread holds.
Location & tenants
- Location reads 74/100 on livability (#273 in OH, #4,475 nationally) — a middle-class / working-renter tenant base. Strengths: crime A+, cost of living A+, housing A+; Watch: employment D+, health & safety D, amenities F.
- Berea City (suburban): math 47% / reading 56% proficiency, ranked #414 of 656 in OH (top 63%) — acceptable for families but not a draw, mixed tenant base, ~2y average lease.
- Market conditions: 44 active listings in the ZIP; 8 comparable units currently listed for rent nearby; rentals leasing fast (median 5d on market — plan ~1-2 weeks tenant-placement turnaround); 1,441 units permitted in Cuyahoga County in 2024 (700 in 5+ unit buildings).
- This rent runs 36% of the median local income ($71k/yr) — at the standard rent-burdened threshold; future hikes will face affordability resistance.
Forward outlook
- Local home prices are declining (-3.0%/yr); year-one equity from $1k of loan paydown is wiped out by about $6k of value loss. Plan a longer hold.
- Cuyahoga County population projected to shrink 8% by 2050 — rents likely to lag national; underwrite the cash flow, not the appreciation.
Negotiation context
- Only 1 days on market — expect competitive offers; lowballing is unlikely to land.
Questions for the listing agent
- Built in 1965 — when were the roof, HVAC, electrical panel, plumbing, and water heater last replaced?
- Is there a deadline driving the sale (1031 exchange, divorce, estate, relocation)? That informs how much negotiation room exists.
- Schools are B-rated — typically a magnet for longer-tenancy family renters. What's the average tenant stay here, and is there a school-zone premium baked into asking?
- What's the average days-on-market for RENTAL listings here right now (not sales)? A rising rental-DOM trend means longer vacancies and softer asking-rent achievability than the comps imply.
- What's the recent tenant-quality profile in this submarket — average credit score on applications, eviction rate, late-payment / NSF rate, and stable-employment percentage? A property-management company in the area should have these aggregated.
- How much new for-sale + rental construction is in the pipeline within 1–3 miles? Heavy new supply typically softens prices + rents 12–24 months out; constrained supply supports both.
Investment metrics
- 1% rule
- 1.00% ✗
- Cap rate
- 7.72%
- Cash-on-cash
- 5.09%
- DSCR
- 1.23
- GRM
- 8.4
CMA / ARV
- ARV (on-the-fly)
- $258,780
- Comps found
- 12
Show comp detail 12 sales within ~0.75 mi
| Address | Dist | Beds/Ba | Sqft | Sold | Price | $/sf | Match |
|---|---|---|---|---|---|---|---|
| 14396 Park Dr | 0.00mi | 3/1.5 | 1,140 (0%) | 1mo | $212,000 | $186 | 99 |
| 6103 Westbrook Dr | 0.45mi | 3/2.0 | 1,132 (-1%) | 1mo | $212,450 | $188 | 75 |
| 13984 Settlement Acres Dr | 0.29mi | 3/1.5 | 1,230 (+8%) | 4mo | $265,000 | $215 | 70 |
| 14398 Sheldon Rd | 0.29mi | 3/2.0 | 1,034 (-9%) | 3mo | $240,000 | $232 | 66 |
| 6014 Westbrook Dr | 0.58mi | 4/1.5 (+1) | 1,131 (-1%) | 2mo | $229,900 | $203 | 65 |
| 14811 Sylvia Dr | 0.40mi | 3/2.5 | 1,040 (-9%) | 6mo | $259,999 | $250 | 58 |
| 6361 Smith Rd | 0.35mi | 3/2.0 | 1,000 (-12%) | 5mo | $206,000 | $206 | 57 |
| 13375 Kathleen Dr | 0.69mi | 3/2.5 | 1,176 (+3%) | 2mo | $256,000 | $218 | 57 |
| 15472 Meigs Blvd | 0.72mi | 4/2.0 (+1) | 1,107 (-3%) | 4mo | $266,000 | $240 | 51 |
| 15425 Richard Dr | 0.47mi | 3/2.0 | 972 (-15%) | 0mo | $245,000 | $252 | 51 |
| 6131 Hardin Dr | 0.42mi | 3/2.0 | 972 (-15%) | 4mo | $230,000 | $237 | 51 |
| 6333 W 130th St | 0.71mi | 3/2.0 | 1,031 (-10%) | 3mo | $233,800 | $227 | 46 |
Match score weights: distance 35% · size 25% · config 20% · recency 20%. Top-matched comps best support the ARV.
Projected returns pro-forma
-3.0% appreciation · 3.0% rent growth · sell at horizon
- IRR
- -8.4%
- Equity multiple
- 0.69×
- Total profit
- $-18,561
- Equity at exit
- $32,057
- IRR
- 1.1%
- Equity multiple
- 1.08×
- Total profit
- $4,804
- Equity at exit
- $18,589
Cash invested: $60,200 (down + closing). Projections, not guarantees.
Landlord ↔ Tenant lean methodology
- Overall (STATE)
- 73 Landlord-Friendly
- State Ohio
- 73 Landlord-Friendly · R+6
- County
- — inherits STATE
- City
- — inherits STATE
ZIP-level market 44142
- Active inventory
- 44
- Price-to-rent
- 8.4×
Monthly cashflow live
- Estimated rent
- $2,142 high interval (Pro) →
- Mortgage (P&I)
- −$1,127
- Tax from tax record
- −$220 /mo · $2,639/yr
- Insurance
- −$90
- HOA
- −$0
- Vacancy / Maint / Mgmt
- −$450
- Net cashflow
- $256
Break-even live
Sensitivity live
| Price | -10% $377 | -5% $316 | +0% $256 | +5% $195 | +10% $134 |
|---|---|---|---|---|---|
| Rent | -10% $86 | -5% $171 | +0% $256 | +5% $340 | +10% $425 |
| Rate | -1.0pp $364 | -0.5pp $310 | base $256 | +0.5pp $200 | +1.0pp $143 |
UW: 25.0% down · 7.5% · 30yr · 1.5% tax · 5.0% vac · 8.0% maint · 8.0% mgmt
Financing live
Cash to close
- Down payment
- $53,750
- Closing costs
- $6,450
- Reserves months
- —
- Total cash needed
- —
Loan-product check · same deal, 3 products live
Conventional
25% down · 7.5% · 30yr
- Down + closing
- —
- Monthly P&I
- —
- Monthly cashflow
- —
- DSCR
- —
- Eligible?
- —
Personal DTI + credit; lowest rate.
DSCR
20% down · 8.5% · 30yr
- Down + closing
- —
- Monthly P&I
- —
- Monthly cashflow
- —
- DSCR
- —
- Eligible?
- —
No personal income docs; deal must DSCR.
Hard money
10% down · 12.0% · 12mo
- Down + closing
- —
- Monthly P&I
- —
- Monthly cashflow
- —
- DSCR
- —
- Eligible?
- —
Short-term bridge; refi at stabilization.
Rent comps 8 comps
| Address | Beds | Baths | Sqft | Rent | $/sqft | DOM | Units | Dist |
|---|---|---|---|---|---|---|---|---|
| 6333 W 130th St Cleveland, OH | 3.0 | 2.0 | 1020 | $2,000 | $1.96 | 45d | 1 | 0.74mi |
| 6536 Lawnwood Ave Unit 1496105P Parma Heights, OH | 3.0 | 2.0 | 1087 | $6,186 | $5.69 | 3d | 1 | 0.90mi |
| 6558 Lawnwood Ave Cleveland, OH | 3.0 | 2.0 | 1331 | $2,100 | $1.58 | 3d | 1 | 0.92mi |
| 16261 Remora Blvd Brook Park, OH | 3.0 | 1.0 | 936 | $1,750 | $1.87 | 45d | 1 | 1.12mi |
| 6500 Beverly Dr Cleveland, OH | 3.0 | 1.5 | 1341 | $2,300 | $1.72 | 24d | 1 | 1.19mi |
| 6240 Stumph Rd Parma Heights, OH | 2.0 | 1.0 | 622 | $1,310 | $2.10 | 4d | 9 | 1.40mi |
| 6771 Greenleaf Ave Unit 1496046P Parma Heights, OH | 3.0 | 2.0 | 1323 | $4,874 | $3.68 | 3d | 1 | 1.42mi |
| 6128 Stumph Rd Cleveland, OH | 2.0 | 2.0 | 1075 | $1,832 | $1.70 | 3d | 8 | 1.43mi |
Listing history 2 events
-
2026-03-04status Pending
-
2026-03-04$215,000 Active
ⓘ Source: listings_history table (triggers on properties + properties_extension) + one-shot
backfill from property_details.listing_events for pre-trigger history.
Tax reassessment forecast OH · Partial reset (capped growth)
- Current annual tax
- $2,639 · $220/mo
- Projected year-2 tax
- $2,996 · $250/mo
- Expected delta
- +$358/yr (+$30/mo · 13.5%)
ⓘ Screening estimate from a state-policy table — verify with the county assessor before closing.
Climate risk First Street
- Flood 1/10 Low FEMA zone X (unshaded) · 0% chance over 30 yrs
- Wildfire 1/10 Low
- Heat 3/10 Moderate 7 d/yr ≥95°F today · 17 d/yr by 30 yrs out
- Wind 1/10 Low
- Air quality 2/10 Low 1 unhealthy d/yr today · 3 by 30 yrs out
Nearby sold comps map
Loading sold comps map…
Walkable amenities ~0.75 mi
Loading nearby amenities…
Taxation est. · year 1
- Rental income
- $25,709
- − Mortgage interest
- −$12,043
- − Property taxes
- −$2,639
- − Insurance
- −$1,075
- − Repairs & maintenance
- −$2,057
- − Management
- −$2,057
- − Depreciation
- −$6,255
- Taxable loss
- −$416
- Est. tax savings @ 24.0%
- +$100
- After-tax cash flow
- $3,166/yr
For passive investors: Depreciation is non-cash, so a rental often shows a tax loss while cash-flowing — sheltering income. Rental losses are passive: they offset passive income freely, and up to $25,000/yr can offset ordinary (W-2) income if you actively participate and your MAGI is under $100k (phasing out to $0 by $150k); unused losses carry forward. On sale, claimed depreciation is recaptured at up to 25%, and gains may owe capital-gains tax (a 1031 exchange can defer both). Figures are a year-1 estimate at your 24.0% rate — not tax advice; consult a CPA.
Schools (NCES district)
- District
- Berea City
- NCES district ID
- 3904360
- Math proficiency
- 47% ▼ -17.00%
- Reading proficiency
- 56% ▼ -7.00%
- Median HH income
- $51,921
- Composite
- 44.18/100
- National rank
- #2856
- State rank
- #414 of 656 in OH
Livability — Brook Park
- Score
- 74/100
- State rank
- #273
- US rank
- #4475
Category grades
Schools grade is shown separately in the Schools card above.
Census & demographics
- Census place
- Brook Park, OH
- County
- Cuyahoga County · 1,090,369 people
- City population
- 18,359
- Metro
- Cleveland-Elyria, OH
- Population (ZIP)
- 18,284
- Household income
- $71,332
- Rent vs Own
- Severe rent burden
- 275.0
Population outlook (Cuyahoga County) Hauer SSP2
- Today (2025)
- 1,244,621 people
- By 2030
- 1,230,093 · -1.2%
- By 2040
- 1,189,108 · -4.5%
- By 2050
- 1,145,706 · -7.9%
- By 2075
- 1,076,557 · -13.5%
- By 2100
- 978,987 · -21.3%
Race, ethnicity, and origin ACS 2023
- Neighborhood character
- Predominantly White (83%)
- Race & ethnicity
- White 83% Hispanic / Latino 6% Black 6% Two or more races 5% Asian 2%
- Hispanic origin (detail)
- Mexican 2% Puerto Rican 2%
- Common ancestry
- Romanian 11% Subsaharan African 2% Scotch-Irish 1%
- Foreign-born
- 5% · Canada, India, China
- Languages at home
- 93% English-only · Spanish 2% Other Indo-European 2% Russian/Polish/Slavic 1%
Political lean MEDSL · Cuyahoga
- 2024 margin
- Solid D (+31.5) · D 65.4% · R 33.9%
- 2008→2024 swing
- -7.4pp toward R · 2008: 38.9pp · 2024: 31.5pp
- All cycles
- 2024: D+31.5 2020: D+34.1 2016: D+35.0 2012: D+38.7 2008: D+38.9
Not yet ingested
- Civics
- —
Market trends
- HPI YoY
- ▼ -177.54%
- Current HPI
- 193.7004
- Rent YoY
- —
- Metro
- Cleveland-Elyria, OH
- State GDP YoY
- ▲ 1.98%
- F500 in state
- 48
Industry mix (Fortune 500 HQ in OH)
| Industry | F500 HQs | Revenue |
|---|---|---|
| Insurance | 3 | $145B |
|
||
| Industrial Machinery | 3 | $49B |
|
||
| Financial Services | 3 | $24B |
|
||
| Consumer Goods | 2 | $93B |
|
||
| Aerospace / Defense | 2 | $47B |
|
||
| Utilities | 2 | $33B |
|
||
Price history
2 events — show timeline
- 2026-03-04 Pending — MLSNOW
- 2026-03-04 Listed $215,000 MLSNOW
Property tax history
+3.0%/yrLatest (2025): $2,639 · -1.3% YoY. Source: county tax records.
Cash-flow waterfall
monthlySold comps — $/sqft
last 12 mo · ≤1 miLoading sold comps…