1297 1/2 Mabry St · Bolivar Peninsula, TX
Flood risk 10/10 · Severe
- FEMA flood zone
- VE
- Chance of flooding over 30 yrs
- 0.99%
- Est. flood insurance / yr
- $5,013 – $11,043
Fire risk 10/10 · Severe
- Est. fire insurance / yr
- $1,222 – $2,270
Heat risk 10/10 · Severe
- Hot days now (above 109°F)
- 7 days/yr
- Hot days in 30 yrs
- 26 days/yr
Wind risk 10/10 · Severe
- Chance of severe wind over 30 yrs
- 99.0%
Air-quality risk 2/10 · Minimal
- Unhealthy air days now
- 1 days/yr
- Unhealthy air days in 30 yrs
- 1 days/yr
Risk factors via First Street. Map © Google.
Why this score? — see what drove the D+ grade
The composite is a weighted blend of 9 inputs, each scored 0–100. Each bar is that input's sub-score; the figure is the points it added to the 100-point composite (weight × sub-score).
- ARV discount +15.0/15.0
- Cash flow +7.6/30.0
- Schools +5.1/10.0
- Appreciation +5.0/10.0
- Livability +3.2/5.0
- 1% rule +2.6/10.0
- Rent growth +2.5/5.0
- Condition / age +2.5/5.0
- DSCR +1.7/10.0
$489,700
🖨 Deal sheet (PDF) 📄 Offer letter ✓ Due diligence
Listing remarks MLS
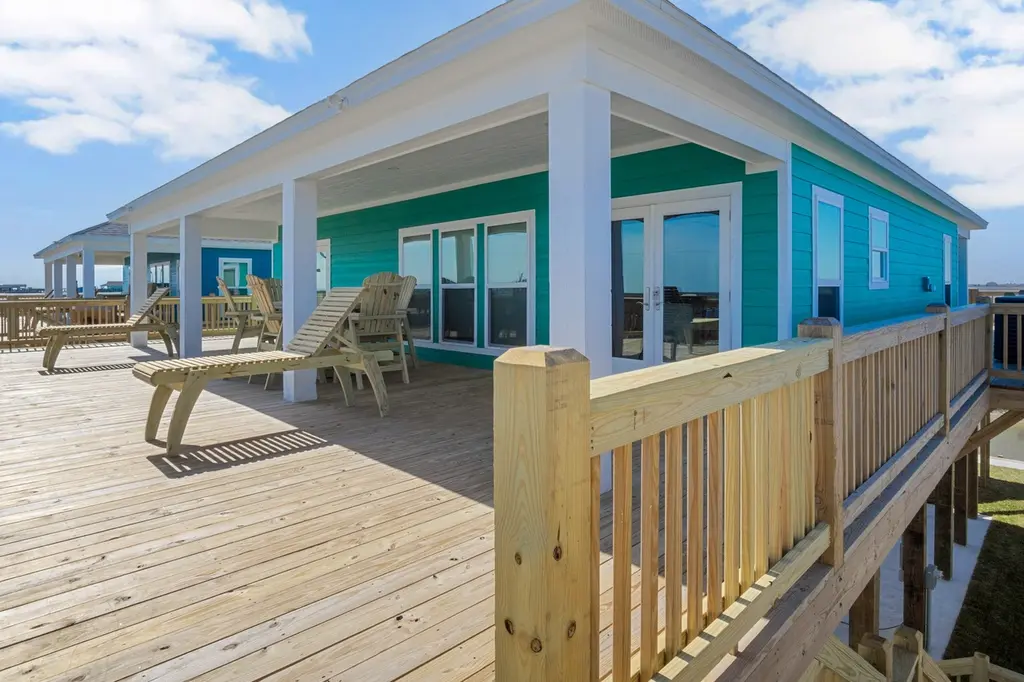
New construction canal-front home a 360 degree deck providing a variety of incredible views - if you enjoy a quiet morning sunrise with a cup of coffee or a glass of wine watching a stunning sunset. This home is located on the canal and comes with a boat slip with lift making it a breeze to get out on the water for the day! 4 bedrooms and 2 bathrooms, with an airy beach decor ensure there is plenty of space and an inviting atmosphere for your family and friends both old and new!! -You and your guests can fish & crab right out the back door - Entertain on either the wrap-around deck or the expansive covered patio. Drop the boat lift and head to the bay for a day of fishing, or simply take long walks on the beach and collect seashells. This home comes fully furnished, is an active income generating vacation rental and is sure to provide many happy and lasting memories for your immediate and extended family!
Key facts
- Canal front home
- Wrap around deck
- Boat slip with lift
Tags
Neighborhood map
What this means for you Summary
Snapshot
- This is a 4-bed/2.0-bath single-family listed at $490k.
Deal economics
- At list price, monthly cash flow is $-1k ($-15k/yr) — negative.
- To cash-flow at today's rent, offer at most $268k (45.2% below list).
- To meet the 1% rule (rent ≥ 1% of price), the offer needs to be $372k (24.1% below list).
- Recommended offer: $268k (45.2% below list) — sets the bar for cash-flow.
- Cap rate 4.9% vs local median 2.1% in Bolivar Peninsula — top-decile yield for the area; either an underpriced asset or a hidden risk that comps aren't pricing in. Stress-test before assuming the spread holds.
Location & tenants
- Location reads 65/100 on livability (#719 in TX) — a middle-class / working-renter tenant base. Strengths: crime A+, cost of living A+, housing A+; Watch: amenities F, commute F, health & safety F.
- High Island ISD (rural): math 65% / reading 50% proficiency, ranked #177 of 1,141 in TX (top 16%) — acceptable for families but not a draw, mixed tenant base, ~2y average lease.
- Zoned schools: High Island School (math 42% / reading 42%, 151 students, 60% FRL).
- Zoned-school proficiency averages 42% at this address vs 58% district-wide (-16 pts) — the specific schools serving this property underperform the High Island ISD average; the district grade overstates school quality for this exact location.
- Market conditions: 228 active listings in the ZIP; 3,258 units permitted in Galveston County in 2024 (0 in 5+ unit buildings).
Forward outlook
- In year one you build about $18k of equity ($3k loan paydown + $15k appreciation (3.0% local appreciation)).
- Galveston County population projected at +43% by 2050 — long-run rental-demand tailwind backs the buy-and-hold thesis.
- By year 3, paydown + projected appreciation supports a ~$45k cash-out refi (75% LTV) — recoverable capital for the next deal without selling this one.
Negotiation context
- It's been on market 481 days — a 12% lower offer ($431k) is reasonable based on typical stale-listing flexibility.
- 2 sale attempts since 3y ago with the ask held roughly flat each time — persistent listings suggest the price (not the market) is what's stuck; bring a comps-based counter.
Risks & watch-outs
- Watch-outs: flood insurance adds $669/mo.
- Climate carrying-cost: in FEMA flood zone VE (mandatory federal flood insurance); severe wind risk, 99% chance of damaging wind over 30y; severe wildfire risk; extreme-heat days projected 7→26/yr by 2055 (HVAC capex compounding) — expect insurance premiums to compound above CPI over the hold.
Questions for the listing agent
- What do current leases actually rent for vs. the listed asking? Can we see a recent rent roll and the last 12 months of T-12 income?
- It's been on market 481 days. Have you received any prior offers? Is the seller open to a 45% concession, seller financing, or rate buy-down credit?
- What's the actual annual flood-insurance premium (NFIP or private), and is the property in a SFHA with mandatory coverage?
- What does the HOA fee cover, when was the last increase, and are there any pending special assessments or reserve-fund shortfalls?
- Why hasn't it sold? Are there any deal-killer items the seller is aware of (foundation, flood, title, zoning, code violations)?
- Is there a deadline driving the sale (1031 exchange, divorce, estate, relocation)? That informs how much negotiation room exists.
- Schools are D-rated, which usually means shorter tenancies and higher turnover. Who's the typical renter profile here, and what's been the actual vacancy rate?
- The area grade is low — what's the realistic commute time and amenity access for the typical tenant pool here? Any planned neighborhood developments (good or bad) we should know about?
- What's the average days-on-market for RENTAL listings here right now (not sales)? A rising rental-DOM trend means longer vacancies and softer asking-rent achievability than the comps imply.
- What's the recent tenant-quality profile in this submarket — average credit score on applications, eviction rate, late-payment / NSF rate, and stable-employment percentage? A property-management company in the area should have these aggregated.
- How much new for-sale + rental construction is in the pipeline within 1–3 miles? Heavy new supply typically softens prices + rents 12–24 months out; constrained supply supports both.
Investment metrics
- 1% rule
- 0.76% ✗
- Cap rate
- 4.86%
- Cash-on-cash
- -5.12%
- DSCR
- 0.77
- GRM
- 11.0
CMA / ARV
- ARV (median comp)
- $595,818
- List price
- $489,700
- Delta
- -17.81%
- Verdict
- UNDERPRICED
- Comps
- 7 within 1.0 mi
Projected returns pro-forma
3.0% appreciation · 3.0% rent growth · sell at horizon
- IRR
- -2.6%
- Equity multiple
- 0.85×
- Total profit
- $-20,310
- Equity at exit
- $220,190
- IRR
- 1.9%
- Equity multiple
- 1.29×
- Total profit
- $40,443
- Equity at exit
- $339,340
Cash invested: $137,116 (down + closing). Projections, not guarantees.
Landlord ↔ Tenant lean methodology
- Overall (STATE)
- 87 Strongly Landlord-Friendly
- State Texas
- 87 Strongly Landlord-Friendly · R+5
- County
- — inherits STATE
- City
- — inherits STATE
ZIP-level market 77617
- Active inventory
- 228
- Price-to-rent
- 11.0×
Monthly cashflow live
- Estimated rent
- $3,717 medium interval (Pro) →
- Mortgage (P&I)
- −$2,568
- Tax from tax record
- −$716 /mo · $8,597/yr
- Insurance
- −$204
- Flood insurance flood zone
- −$669 /mo · $8,028/yr
- HOA
- −$33
- Vacancy / Maint / Mgmt
- −$781
- Net cashflow
- $-1,254
Break-even live
Sensitivity live
| Price | -10% $-977 | -5% $-1,115 | +0% $-1,254 | +5% $-1,392 | +10% $-1,531 |
|---|---|---|---|---|---|
| Rent | -10% $-1,547 | -5% $-1,401 | +0% $-1,254 | +5% $-1,107 | +10% $-960 |
| Rate | -1.0pp $-1,007 | -0.5pp $-1,129 | base $-1,254 | +0.5pp $-1,381 | +1.0pp $-1,510 |
UW: 25.0% down · 7.5% · 30yr · 1.5% tax · 5.0% vac · 8.0% maint · 8.0% mgmt
Financing live
Cash to close
- Down payment
- $122,425
- Closing costs
- $14,691
- Reserves months
- —
- Total cash needed
- —
Loan-product check · same deal, 3 products live
Conventional
25% down · 7.5% · 30yr
- Down + closing
- —
- Monthly P&I
- —
- Monthly cashflow
- —
- DSCR
- —
- Eligible?
- —
Personal DTI + credit; lowest rate.
DSCR
20% down · 8.5% · 30yr
- Down + closing
- —
- Monthly P&I
- —
- Monthly cashflow
- —
- DSCR
- —
- Eligible?
- —
No personal income docs; deal must DSCR.
Hard money
10% down · 12.0% · 12mo
- Down + closing
- —
- Monthly P&I
- —
- Monthly cashflow
- —
- DSCR
- —
- Eligible?
- —
Short-term bridge; refi at stabilization.
HOA detail
- Monthly dues
- $33 · $396/yr
- Likely covers
- water
Listing history 22 events
-
2026-06-21days on market $489,700 Active 481 DOM
-
2026-06-21days on market $489,700 Active 480 DOM
-
2026-06-18days on market $489,700 Active 478 DOM
-
2026-06-17days on market $489,700 Active 477 DOM
-
2026-06-16days on market $489,700 Active 476 DOM
-
2026-06-15days on market $489,700 Active 475 DOM
-
2026-06-13days on market $489,700 Active 473 DOM
-
2026-06-12days on market $489,700 Active 472 DOM
-
2026-06-10days on market $489,700 Active 469 DOM
-
2026-06-08days on market $489,700 Active 468 DOM
-
2026-06-08days on market $489,700 Active 467 DOM
-
2026-06-07days on market $489,700 Active 466 DOM
-
2026-06-03days on market $489,700 Active 463 DOM
-
2026-06-02days on market $489,700 Active 462 DOM
-
2026-06-01days on market $489,700 Active 461 DOM
-
2026-05-31days on market $489,700 Active 460 DOM
-
2025-02-25$489,700 Active 925-char remark
Show marketing remark (925 chars)
New construction canal-front home a 360 degree deck providing a variety of incredible views - if you enjoy a quiet morning sunrise with a cup of coffee or a glass of wine watching a stunning sunset. This home is located on the canal and comes with a boat slip with lift making it a breeze to get out on the water for the day! 4 bedrooms and 2 bathrooms, with an airy beach decor ensure there is plenty of space and an inviting atmosphere for your family and friends both old and new!! -You and your guests can fish & crab right out the back door - Entertain on either the wrap-around deck or the expansive covered patio. Drop the boat lift and head to the bay for a day of fishing, or simply take long walks on the beach and collect seashells. This home comes fully furnished, is an active income generating vacation rental and is sure to provide many happy and lasting memories for your immediate and extended family!
-
2024-01-22soldstatus
-
2024-01-19soldstatus Sold 139-char remark
Show marketing remark (139 chars)
Boat ramp and private beach access. Per seller: Unrestricted canal lot with access to the ICW, Water and electricity available at the road.
-
2024-01-01status Pending 139-char remark
Show marketing remark (139 chars)
Boat ramp and private beach access. Per seller: Unrestricted canal lot with access to the ICW, Water and electricity available at the road.
-
2023-12-11price $56,500 139-char remark
Show marketing remark (139 chars)
Boat ramp and private beach access. Per seller: Unrestricted canal lot with access to the ICW, Water and electricity available at the road.
-
2023-10-07$59,999 Active 139-char remark
Show marketing remark (139 chars)
Boat ramp and private beach access. Per seller: Unrestricted canal lot with access to the ICW, Water and electricity available at the road.
ⓘ Source: listings_history table (triggers on properties + properties_extension) + one-shot
backfill from property_details.listing_events for pre-trigger history.
Tax reassessment forecast TX · Resets to sale price
- Current annual tax
- $8,597 · $716/mo
- Projected year-2 tax
- $8,962 · $747/mo
- Expected delta
- +$365/yr (+$30/mo · 4.2%)
ⓘ Screening estimate from a state-policy table — verify with the county assessor before closing.
Climate risk First Street
- Flood 10/10 Extreme FEMA zone VE · 99% chance over 30 yrs
- Wildfire 10/10 Extreme
- Heat 10/10 Extreme 7 d/yr ≥109°F today · 26 d/yr by 30 yrs out
- Wind 10/10 Extreme 99% chance of damaging wind over 30 yrs
- Air quality 2/10 Low 1 unhealthy d/yr today · 1 by 30 yrs out
Nearby sold comps map
Loading sold comps map…
Walkable amenities ~0.75 mi
Loading nearby amenities…
Taxation est. · year 1
- Rental income
- $44,608
- − Mortgage interest
- −$27,431
- − Property taxes
- −$8,597
- − Insurance
- −$10,476
- − Repairs & maintenance
- −$3,569
- − Management
- −$3,569
- − HOA
- −$396
- − Depreciation
- −$14,246
- Taxable loss
- −$23,675
- Est. tax savings @ 24.0%
- +$5,682
- After-tax cash flow
- $-9,363/yr
For passive investors: Depreciation is non-cash, so a rental often shows a tax loss while cash-flowing — sheltering income. Rental losses are passive: they offset passive income freely, and up to $25,000/yr can offset ordinary (W-2) income if you actively participate and your MAGI is under $100k (phasing out to $0 by $150k); unused losses carry forward. On sale, claimed depreciation is recaptured at up to 25%, and gains may owe capital-gains tax (a 1031 exchange can defer both). Figures are a year-1 estimate at your 24.0% rate — not tax advice; consult a CPA.
Schools (NCES district)
- District
- High Island ISD
- NCES district ID
- 4823160
- Math proficiency
- 65% ▲ 30.00%
- Reading proficiency
- 50% ▲ 15.00%
- Median HH income
- $49,447
- Composite
- 50.69/100
- National rank
- #3933
- State rank
- #177 of 1141 in TX
Livability — Bolivar Peninsula
- Score
- 65/100
- State rank
- #719
- US rank
- #13437
Category grades
Schools grade is shown separately in the Schools card above.
Census & demographics
- Census place
- Bolivar Peninsula, TX
- City population
- 2,957
- Population (ZIP)
- 38
Population outlook (Galveston County) Hauer SSP2
- Today (2025)
- 390,640 people
- By 2030
- 425,226 · +8.9%
- By 2040
- 493,765 · +26.4%
- By 2050
- 559,698 · +43.3%
- By 2075
- 719,260 · +84.1%
- By 2100
- 819,628 · +109.8%
Race, ethnicity, and origin ACS 2023
- Neighborhood character
- Predominantly White (100%)
- Race & ethnicity
- White 100%
- Common ancestry
- Lithuanian 18% Serbian 18%
- Languages at home
- 84% English-only · Spanish 16%
Political lean MEDSL · Galveston
- 2024 margin
- Strong R (+27.4) · D 35.7% · R 63.1% · Other 1.2%
- 2008→2024 swing
- -7.9pp toward R · 2008: -19.5pp · 2024: -27.4pp
- All cycles
- 2024: R+27.4 2020: R+22.6 2016: R+22.6 2012: R+26.9 2008: R+19.5
Not yet ingested
- Civics
- —
Market trends
- HPI YoY
- —
- Current HPI
- —
- Rent YoY
- —
- Metro
- —
- State GDP YoY
- ▲ 3.95%
- F500 in state
- 110
Industry mix (Fortune 500 HQ in TX)
| Industry | F500 HQs | Revenue |
|---|---|---|
| Energy | 16 | $1,198B |
|
||
| Technology | 5 | $198B |
|
||
| Engineering / Construction | 4 | $72B |
|
||
| Energy Services | 3 | $60B |
|
||
| Utilities | 3 | $41B |
|
||
| Healthcare | 2 | $330B |
|
||
Price history
+716.2% since first listed6 events — show timeline
- 2025-02-25 Listed $489,700 HARMLS
- 2024-01-22 Sold (Public Records) — Public Records
- 2024-01-19 Sold (MLS) — HARMLS
- 2024-01-01 Pending — HARMLS
- 2023-12-11 Price Changed $56,500 HARMLS
- 2023-10-07 Listed $59,999 HARMLS
Property tax history
+71.3%/yrLatest (2025): $8,597 · +1013.5% YoY. Source: county tax records.
Cash-flow waterfall
monthlySold comps — $/sqft
last 12 mo · ≤1 miLoading sold comps…