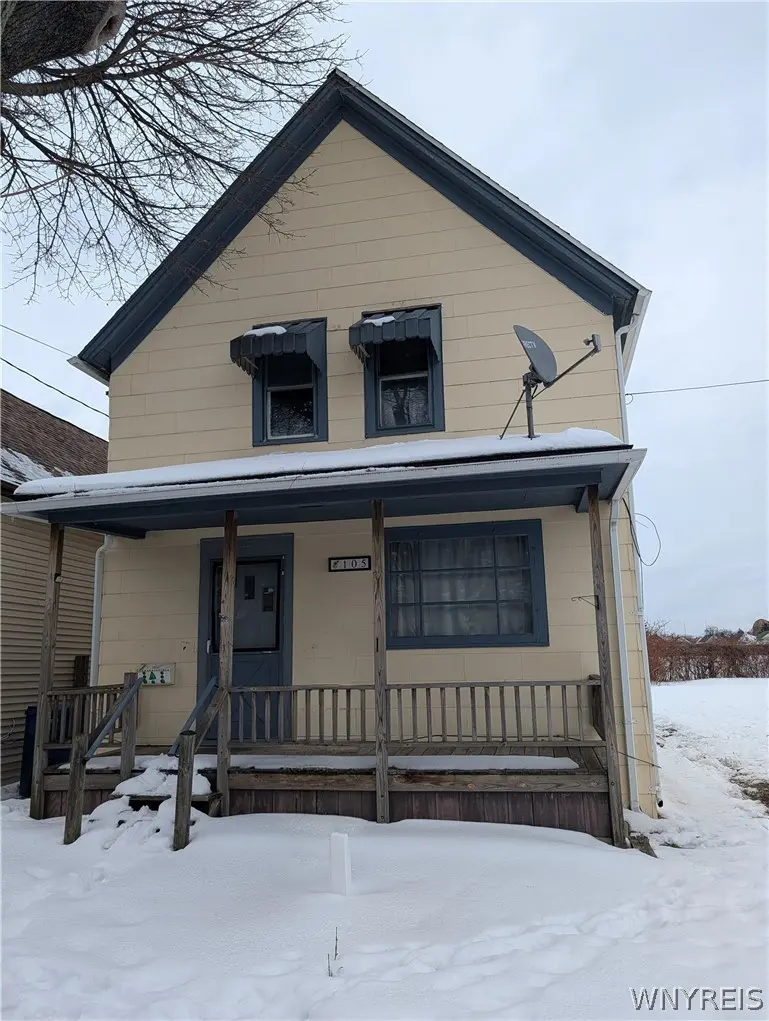
105 Kelburn St · Buffalo, NY
Flood risk 4/10 · Minor
- FEMA flood zone
- X (unshaded)
- Chance of flooding over 30 yrs
- 0.22%
- Est. flood insurance / yr
- $473 – $860
Fire risk 1/10 · Minimal
- Est. fire insurance / yr
- $691 – $1,283
Heat risk 3/10 · Minor
- Hot days now (above 92°F)
- 7 days/yr
- Hot days in 30 yrs
- 15 days/yr
Wind risk 1/10 · Minimal
- Chance of severe wind over 30 yrs
- —
Air-quality risk 3/10 · Minor
- Unhealthy air days now
- 2 days/yr
- Unhealthy air days in 30 yrs
- 3 days/yr
Risk factors via First Street. Map © Google.
Why this score? — see what drove the A- grade
The composite is a weighted blend of 9 inputs, each scored 0–100. Each bar is that input's sub-score; the figure is the points it added to the 100-point composite (weight × sub-score).
- Cash flow +29.8/30.0
- ARV discount +15.0/15.0
- DSCR +10.0/10.0
- Appreciation +9.0/10.0
- 1% rule +7.3/10.0
- Livability +3.9/5.0
- Schools +3.3/10.0
- Rent growth +2.5/5.0
- Condition / age +2.5/5.0
$104,900
🖨 Deal sheet 📄 Offer letter ✓ Due diligence
Listing remarks MLS
Kaisertown beauty! Located on a quiet, tree-lined street, this updated 3-bedroom, 1-bath home offers comfort and convenience. Features include off-street parking and a storage shed. The first floor offers a bright living room, formal dining room, and a large eat-in kitchen with plenty of space to gather. A full bath, convenient first-floor laundry, and a versatile bonus room off the back—ideal for a home office, mudroom, or playroom—complete the main level. Upstairs you’ll find three generously sized bedrooms with ample closet space. Additional features include a partial basement with glass block windows and covered front and rear porches perfect for relaxing outdoors.
Key facts
- Large eat-in kitchen
- Formal dining room
- Storage shed
Tags
Neighborhood map
What this means for you Summary
Snapshot
- This is a 3-bed/1.0-bath single-family listed at $105k.
Deal economics
- At list price, monthly cash flow is $386 ($5k/yr) — positive.
- The deal already cash-flows at list — no discount required.
- Meets the 1% rule at list price ($1k rent vs $105k).
- Recommended offer: $92k (12.0% below list) — sets the bar for market timing.
- Cap rate 10.7% vs local median 8.0% in Buffalo — top-decile yield for the area; either an underpriced asset or a hidden risk that comps aren't pricing in. Stress-test before assuming the spread holds.
Location & tenants
- Location reads 77/100 on livability (#195 in NY, #3,011 nationally) — a middle-class / working-renter tenant base. Strengths: commute A+, housing A+, health & safety A+; Watch: crime F, employment D-.
- Buffalo City School District (urban): math 41% / reading 40% proficiency, ranked #535 of 590 in NY (top 91%) — families likely to look elsewhere, expect single-tenant / working-renter base with shorter leases; 75% free/reduced lunch — lower-income household profile, screen leases tightly.
- Market conditions: 169 active listings in the ZIP; 14 comparable units currently listed for rent nearby; rentals at typical pace (median 24d on market — plan ~3-4 weeks tenant-placement turnaround); 1,244 units permitted in Erie County in 2024 (563 in 5+ unit buildings).
- This rent runs 31% of the median local income ($50k/yr) — at the standard rent-burdened threshold; future hikes will face affordability resistance.
Forward outlook
- In year one you build about $9k of equity ($725 loan paydown + $8k appreciation (8.1% local appreciation)).
- At projected returns (8.1% appreciation + 3.0% rent growth), your $29k cash investment doubles in ~3 years — after that, you're playing with house money.
- By year 4, paydown + projected appreciation supports a ~$32k cash-out refi (75% LTV) — recoverable capital for the next deal without selling this one.
Negotiation context
- It's been on market 122 days — a 12% lower offer ($92k) is reasonable based on typical stale-listing flexibility.
- 3 sale attempts since 9y ago with the ask held roughly flat each time — persistent listings suggest the price (not the market) is what's stuck; bring a comps-based counter.
- Current owner paid $80k; 31% above their basis — modest negotiation headroom, anchor on the comps not their cost.
Risks & watch-outs
- Watch-outs: built in 1900 — expect roof / HVAC / electrical / plumbing capex.
Questions for the listing agent
- It's been on market 122 days. Have you received any prior offers? Is the seller open to a 12% concession, seller financing, or rate buy-down credit?
- Built in 1900 — when were the roof, HVAC, electrical panel, plumbing, and water heater last replaced?
- Why hasn't it sold? Are there any deal-killer items the seller is aware of (foundation, flood, title, zoning, code violations)?
- Is there a deadline driving the sale (1031 exchange, divorce, estate, relocation)? That informs how much negotiation room exists.
- Crime grade is F in this area — have there been break-ins, vandalism, or insurance claims at this property in the last 3 years? What carrier currently insures it and at what premium?
- What's the average days-on-market for RENTAL listings here right now (not sales)? A rising rental-DOM trend means longer vacancies and softer asking-rent achievability than the comps imply.
- What's the recent tenant-quality profile in this submarket — average credit score on applications, eviction rate, late-payment / NSF rate, and stable-employment percentage? A property-management company in the area should have these aggregated.
- How much new for-sale + rental construction is in the pipeline within 1–3 miles? Heavy new supply typically softens prices + rents 12–24 months out; constrained supply supports both.
Investment metrics
- 1% rule
- 1.23% ✓
- Cap rate
- 10.70%
- Cash-on-cash
- 15.75%
- DSCR
- 1.70
- GRM
- 6.8
CMA / ARV
- ARV (median comp)
- $160,272
- List price
- $104,900
- Delta
- -34.55%
- Verdict
- UNDERPRICED
- Comps
- 20 within 1.0 mi
Show comp detail 12 sales within ~0.75 mi
| Address | Dist | Beds/Ba | Sqft | Sold | Price | $/sf | Match |
|---|---|---|---|---|---|---|---|
| 21 Glenn St | 0.17mi | 3/1.0 | 1,153 (+6%) | 3mo | $15,000 | $13 | 80 |
| 19 Spann St | 0.23mi | 2/1.0 (-1) | 1,026 (-6%) | 8mo | $170,000 | $166 | 68 |
| 358 Weimar St | 0.44mi | 2/1.0 (-1) | 1,050 (-4%) | 2mo | $200,000 | $190 | 66 |
| 217 Weiss St | 0.36mi | 3/1.0 | 993 (-9%) | 3mo | $160,000 | $161 | 65 |
| 295 Weimar St | 0.40mi | 3/1.5 | 1,194 (+9%) | 0mo | $209,000 | $175 | 64 |
| 396 Weimar St | 0.49mi | 3/1.0 | 1,038 (-5%) | 10mo | $205,000 | $197 | 61 |
| 405 Weimar St | 0.51mi | 3/1.0 | 1,188 (+9%) | 4mo | $197,500 | $166 | 58 |
| 72 Weaver St | 0.58mi | 3/1.0 | 1,176 (+8%) | 4mo | $91,000 | $77 | 57 |
| 286 Barnard St | 0.47mi | 3/1.5 | 1,201 (+10%) | 6mo | $185,000 | $154 | 54 |
| 287 Fenton St | 0.51mi | 4/1.0 (+1) | 1,170 (+7%) | 6mo | $235,000 | $201 | 54 |
| 55 Avondale Pl | 0.53mi | 3/2.0 | 1,183 (+8%) | 9mo | $175,000 | $148 | 50 |
| 102 Pomona Pl | 0.57mi | 4/1.0 (+1) | 1,232 (+13%) | 2mo | $81,000 | $66 | 45 |
Match score weights: distance 35% · size 25% · config 20% · recency 20%. Top-matched comps best support the ARV.
Projected returns pro-forma
8.06% appreciation · 3.0% rent growth · sell at horizon
- IRR
- 32.4%
- Equity multiple
- 3.32×
- Total profit
- $68,127
- Equity at exit
- $80,112
- IRR
- 28.8%
- Equity multiple
- 7.11×
- Total profit
- $179,361
- Equity at exit
- $159,421
Cash invested: $29,372 (down + closing). Projections, not guarantees.
Landlord ↔ Tenant lean methodology
- Overall (STATE)
- 15 Strongly Tenant-Friendly
- State New York
- 15 Strongly Tenant-Friendly · D+10
- County
- — inherits STATE
- City
- — inherits STATE
ZIP-level market 14206
- Home prices YoY
- 1.8%
- Active inventory
- 169
- Price-to-rent
- 6.8×
Monthly cashflow live
- Estimated rent
- $1,294 high interval (Pro) →
- Mortgage (P&I)
- −$550
- Tax from tax record
- −$43 /mo · $510/yr
- Insurance
- −$44
- HOA
- −$0
- Vacancy / Maint / Mgmt
- −$272
- Net cashflow
- $386
Break-even live
UW: 25.0% down · 7.5% · 30yr · 1.5% tax · 5.0% vac · 8.0% maint · 8.0% mgmt
Financing live
Cash to close
- Down payment
- $26,225
- Closing costs
- $3,147
- Reserves months
- —
- Total cash needed
- —
Loan-product check · same deal, 3 products live
Conventional
25% down · 7.5% · 30yr
- Down + closing
- —
- Monthly P&I
- —
- Monthly cashflow
- —
- DSCR
- —
- Eligible?
- —
Personal DTI + credit; lowest rate.
DSCR
20% down · 8.5% · 30yr
- Down + closing
- —
- Monthly P&I
- —
- Monthly cashflow
- —
- DSCR
- —
- Eligible?
- —
No personal income docs; deal must DSCR.
Hard money
10% down · 12.0% · 12mo
- Down + closing
- —
- Monthly P&I
- —
- Monthly cashflow
- —
- DSCR
- —
- Eligible?
- —
Short-term bridge; refi at stabilization.
Rent comps 14 comps
| Address | Beds | Baths | Sqft | Rent | $/sqft | DOM | Units | Dist |
|---|---|---|---|---|---|---|---|---|
| 47 Lester St Unit Main Floor Buffalo, NY | 3.0 | 1.0 | 900 | $1,000 | $1.11 | 43d | 1 | 0.67mi |
| 1899 Seneca St Buffalo, NY | 3.0 | 1.0 | 1134 | $1,075 | $0.95 | 14d | 1 | 0.83mi |
| 76 Hammerschmidt Ave Buffalo, NY | 3.0 | 1.0 | 1200 | $1,275 | $1.06 | 2d | 1 | 0.84mi |
| 1927 Seneca St Buffalo, NY | 3.0 | 1.0 | 1196 | $1,250 | $1.05 | 23d | 1 | 0.88mi |
| 34 Hayden St Unit Back Buffalo, NY | 3.0 | 1.0 | 1200 | $1,600 | $1.33 | 43d | 1 | 0.91mi |
| 1150 Bailey Ave Buffalo, NY | 4.0 | 1.5 | 1100 | $1,200 | $1.09 | 23d | 1 | 1.01mi |
| 214 Abbott Rd Unit 2 Buffalo, NY | 2.0 | 1.0 | 945 | $1,200 | $1.27 | 14d | 1 | 1.13mi |
| 2111 Seneca St #3 Buffalo, NY | 2.0 | 1.0 | 937 | $1,150 | $1.23 | 43d | 1 | 1.17mi |
| 61 Princeton Pl Buffalo, NY | 2.0 | 1.0 | 820 | $1,300 | $1.59 | 2d | 1 | 1.21mi |
| 298 Cumberland Ave Buffalo, NY | 3.0 | 1.5 | 1208 | $2,200 | $1.82 | 1d | 1 | 1.26mi |
| 23 Indian Orchard Pl Unit Lower Buffalo, NY | 3.0 | 1.0 | 1200 | $1,250 | $1.04 | 43d | 1 | 1.31mi |
| 700 Hopkins St Buffalo, NY | 3.0 | 1.0 | 1100 | $1,225 | $1.11 | 14d | 1 | 1.33mi |
| 696 Hopkins St Unit 2 Buffalo, NY | 2.0 | 1.0 | 750 | $950 | $1.27 | 43d | 1 | 1.34mi |
| 89 Macamley St #2 Buffalo, NY | 3.0 | 1.0 | 1274 | $1,100 | $0.86 | 10d | 1 | 1.34mi |
Listing history 25 events
-
2026-06-18days on market $104,900 Active 122 DOM
-
2026-06-17days on market $104,900 Active 121 DOM
-
2026-06-16days on market $104,900 Active 120 DOM
-
2026-06-15days on market $104,900 Active 119 DOM
-
2026-06-13days on market $104,900 Active 117 DOM
-
2026-06-13days on market $104,900 Active 116 DOM
-
2026-06-10days on market $104,900 Active 114 DOM
-
2026-06-09days on market $104,900 Active 113 DOM
-
2026-06-08days on market $104,900 Active 112 DOM
-
2026-06-07days on market $104,900 Active 111 DOM
-
2026-06-03days on market $104,900 Active 107 DOM
-
2026-06-02days on market $104,900 Active 106 DOM
-
2026-06-01days on market $104,900 Active 105 DOM
-
2026-05-31days on market $104,900 Active 104 DOM
-
2026-02-16$109,900 Active 695-char remark
Show marketing remark (695 chars)
Kaisertown beauty! Located on a quiet, tree-lined street, this updated 3-bedroom, 1-bath home offers comfort and convenience. Features include off-street parking and a storage shed. The first floor offers a bright living room, formal dining room, and a large eat-in kitchen with plenty of space to gather. A full bath, convenient first-floor laundry, and a versatile bonus room off the back—ideal for a home office, mudroom, or playroom—complete the main level. Upstairs you’ll find three generously sized bedrooms with ample closet space. Additional features include a partial basement with glass block windows and covered front and rear porches perfect for relaxing outdoors.
-
2026-02-11historical
-
2025-11-06price $109,900
-
2025-09-16price $129,900
-
2025-08-11$149,900 Active
-
2025-07-22soldstatus $80,000
-
2019-06-28soldstatus $55,000
-
2017-05-09soldstatus $40,000 Closed Sale or Rented
-
2017-04-07status Pending Sale
-
2017-03-29historical Under Contract- Do Not Show
-
2017-03-27$39,900 Active
ⓘ Source: listings_history table (triggers on properties + properties_extension) + one-shot
backfill from property_details.listing_events for pre-trigger history.
Tax reassessment forecast NY · Partial reset (capped growth)
- Current annual tax
- $510 · $43/mo
- Projected year-2 tax
- $1,141 · $95/mo
- Expected delta
- +$631/yr (+$53/mo · 123.8%)
ⓘ Screening estimate from a state-policy table — verify with the county assessor before closing.
Climate risk First Street
- Flood 4/10 Moderate FEMA zone X (unshaded) · 22% chance over 30 yrs
- Wildfire 1/10 Low
- Heat 3/10 Moderate 7 d/yr ≥92°F today · 15 d/yr by 30 yrs out
- Wind 1/10 Low
- Air quality 3/10 Moderate 2 unhealthy d/yr today · 3 by 30 yrs out
Nearby sold comps map
Loading sold comps map…
Walkable amenities ~0.75 mi
Loading nearby amenities…
Taxation est. · year 1
- Rental income
- $15,522
- − Mortgage interest
- −$5,876
- − Property taxes
- −$510
- − Insurance
- −$524
- − Repairs & maintenance
- −$1,242
- − Management
- −$1,242
- − Depreciation
- −$3,052
- Taxable income
- $3,076
- Est. tax owed @ 24.0%
- −$738
- After-tax cash flow
- $3,888/yr
For passive investors: Depreciation is non-cash, so a rental often shows a tax loss while cash-flowing — sheltering income. Rental losses are passive: they offset passive income freely, and up to $25,000/yr can offset ordinary (W-2) income if you actively participate and your MAGI is under $100k (phasing out to $0 by $150k); unused losses carry forward. On sale, claimed depreciation is recaptured at up to 25%, and gains may owe capital-gains tax (a 1031 exchange can defer both). Figures are a year-1 estimate at your 24.0% rate — not tax advice; consult a CPA.
Schools (NCES district)
- District
- Buffalo City School District
- NCES district ID
- 3605850
- Math proficiency
- 41% ▲ 11.00%
- Reading proficiency
- 40% ▲ 7.00%
- Median HH income
- $31,665
- Composite
- 33.17/100
- National rank
- #5544
- State rank
- #535 of 590 in NY
Livability — Buffalo
- Score
- 77/100
- State rank
- #195
- US rank
- #3011
Category grades
Schools grade is shown separately in the Schools card above.
Census & demographics
- Census place
- Buffalo, NY
- County
- Erie County · 714,559 people
- City population
- 440,021
- Metro
- Buffalo-Cheektowaga, NY
- Population (ZIP)
- 21,631
- Household income
- $50,450
- Rent vs Own
- Severe rent burden
- 841.0
Population outlook (Erie County) Hauer SSP2
- Today (2025)
- 933,037 people
- By 2030
- 935,181 · +0.2%
- By 2040
- 928,531 · -0.5%
- By 2050
- 905,725 · -2.9%
- By 2075
- 834,037 · -10.6%
- By 2100
- 708,033 · -24.1%
Race, ethnicity, and origin ACS 2023
- Neighborhood character
- Majority White (65%)
- Race & ethnicity
- White 65% Hispanic / Latino 13% Black 12% Two or more races 8% Asian 4%
- Hispanic origin (detail)
- Mexican 2% Puerto Rican 10%
- Common ancestry
- Romanian 25% Lithuanian 1% Italian 1%
- Foreign-born
- 6% · Canada, China
- Languages at home
- 88% English-only · Spanish 5% Other Indo-European 3% Arabic 2%
Political lean MEDSL · Erie
- 2024 margin
- Lean D (+9.7) · D 54.8% · R 45.2%
- 2008→2024 swing
- -7.9pp toward R · 2008: 17.5pp · 2024: 9.7pp
- All cycles
- 2024: D+9.7 2020: D+14.7 2016: D+4.8 2012: D+15.6 2008: D+17.5
Not yet ingested
- Civics
- —
Market trends
- HPI YoY
- ▲ 8.06%
- Current HPI
- 457.3935
- Rent YoY
- —
- Metro
- Buffalo-Cheektowaga, NY
- State GDP YoY
- ▲ 2.60%
- F500 in state
- 92
Industry mix (Fortune 500 HQ in NY)
| Industry | F500 HQs | Revenue |
|---|---|---|
| Financial Services | 10 | $950B |
|
||
| Consumer Goods | 9 | $162B |
|
||
| Insurance | 4 | $225B |
|
||
| Telecommunications | 2 | $144B |
|
||
| Pharmaceuticals | 2 | $112B |
|
||
| Media / Entertainment | 2 | $69B |
|
||
Price history
+175.4% since first listed11 events — show timeline
- 2026-02-16 Listed $109,900 WNYREIS
- 2026-02-11 Listing Removed — WNYREIS
- 2025-11-06 Price Changed $109,900 WNYREIS
- 2025-09-16 Price Changed $129,900 WNYREIS
- 2025-08-11 Listed $149,900 WNYREIS
- 2025-07-22 Sold (Public Records) $80,000 Public Records
- 2019-06-28 Sold (Public Records) $55,000 Public Records
- 2017-05-09 Sold (MLS) $40,000 WNYREIS
- 2017-04-07 Pending — WNYREIS
- 2017-03-29 Contingent — WNYREIS
- 2017-03-27 Listed $39,900 WNYREIS
Property tax history
+7.8%/yrLatest (2025): $510 · +0.0% YoY. Source: county tax records.
Cash-flow waterfall
monthlySold comps — $/sqft
last 12 mo · ≤1 miLoading sold comps…