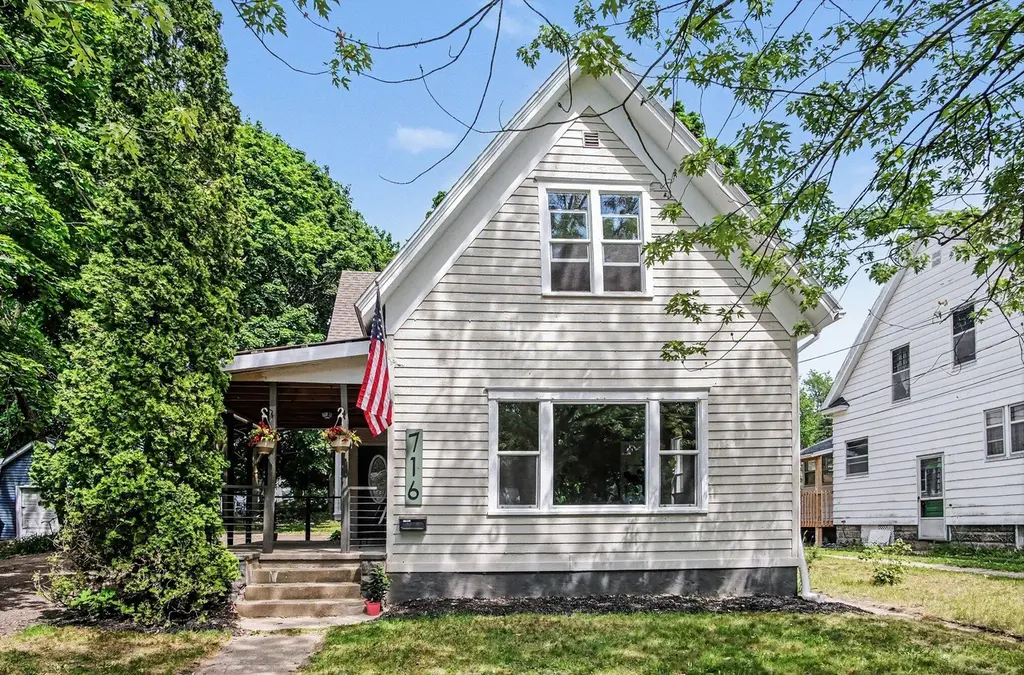
716 S Broas St · Belding, MI
Flood risk 1/10 · Minimal
- FEMA flood zone
- X (unshaded)
- Chance of flooding over 30 yrs
- 0.0%
- Est. flood insurance / yr
- $473 – $860
Fire risk 1/10 · Minimal
- Est. fire insurance / yr
- $784 – $1,456
Heat risk 3/10 · Minor
- Hot days now (above 98°F)
- 7 days/yr
- Hot days in 30 yrs
- 15 days/yr
Wind risk 2/10 · Minimal
- Chance of severe wind over 30 yrs
- —
Air-quality risk 2/10 · Minimal
- Unhealthy air days now
- 1 days/yr
- Unhealthy air days in 30 yrs
- 2 days/yr
Risk factors via First Street. Map © Google.
Why this score? — see what drove the C grade
The composite is a weighted blend of 9 inputs, each scored 0–100. Each bar is that input's sub-score; the figure is the points it added to the 100-point composite (weight × sub-score).
- Cash flow +18.6/30.0
- Appreciation +10.0/10.0
- ARV discount +9.6/15.0
- DSCR +5.8/10.0
- 1% rule +4.6/10.0
- Livability +3.7/5.0
- Rent growth +2.5/5.0
- Condition / age +2.5/5.0
- Schools +2.3/10.0
$239,900
🖨 Deal sheet 📄 Offer letter ✓ Due diligence
Listing remarks MLS
Welcome to 716 S Broas, where timeless character meets modern convenience. This beautifully renovated 3-bedroom, 1.5-bath home has been thoughtfully updated from top to bottom while preserving the charm that makes it truly special. Step inside and be greeted by stunning hardwood floors, abundant natural light, and impressive 10-foot ceilings that create a bright, open feel throughout the main level. The brand-new kitchen features stylish finishes, updated cabinetry, and modern functionality, making it the perfect space for everyday living and entertaining. Work from home with ease in the dedicated office area, and enjoy the flexibility of the spacious mudroom/den/flex space, ideal for a second living area, playroom, hobby room, or additional workspace. Major updates including brand-new windows throughout, a new furnace, and a new water heater provide peace of mind and energy efficiency for years to come. Outside, you'll find a private backyard surrounded by mature trees, creating aa peaceful setting for relaxing, gardening, or entertaining guests. With its blend of historic charm, modern updates, and versatile living spaces, this fully renovated home is truly move-in ready. Schedule your private showing today! Offer deadline is Monday, June 8th at 10am.
Key facts
- 10-foot ceilings
- Natural light
- Spacious mudroom
Tags
Property features AI
Exterior
- Utilities: Public water
- Home design: Traditional-style single-family home; Built in 1900
- Construction: Aluminum siding; Wood siding; Composition roof; Partial Michigan-style basement
- Exterior features: Pond on the property; Shed(s); Paved road access
Interior
- Kitchen: Dishwasher; Microwave; Oven; Refrigerator
- Bathrooms: 1 full bathroom; 1 half bathroom
- Heating & cooling: Forced air heating
- Interior features: Fireplace; Replacement windows; 11 total rooms
- Laundry & utility: Washer; Dryer
Neighborhood map
What this means for you Summary
Snapshot
- This is a 3-bed/1.5-bath single-family listed at $240k.
Deal economics
- At list price, monthly cash flow is $232 ($3k/yr) — positive.
- The deal already cash-flows at list — no discount required.
- To meet the 1% rule (rent ≥ 1% of price), the offer needs to be $230k (4.3% below list).
- Recommended offer: $230k (4.3% below list) — sets the bar for 1% rule.
- Cap rate 7.5% vs local median 4.5% in Belding — top-decile yield for the area; either an underpriced asset or a hidden risk that comps aren't pricing in. Stress-test before assuming the spread holds.
Location & tenants
- Location reads 74/100 on livability (#169 in MI, #4,436 nationally) — a middle-class / working-renter tenant base. Strengths: cost of living A+, housing A+, health & safety A+; Watch: employment D, schools D-, amenities F.
- Belding Area School District (town): math 23% / reading 31% proficiency, ranked #398 of 540 in MI (top 74%) — low school quality limits family demand, transient renter base, plan for 1-2y turnover.
- Market conditions: 72 active listings in the ZIP; 1 comparable units currently listed for rent nearby; 94 units permitted in Ionia County in 2024 (0 in 5+ unit buildings).
Forward outlook
- In year one you build about $26k of equity ($2k loan paydown + $24k appreciation (10.0% local appreciation)).
- Ionia County population projected to shrink 8% by 2050 — rents likely to lag national; underwrite the cash flow, not the appreciation.
- At projected returns (10.0% appreciation + 3.0% rent growth), your $67k cash investment doubles in ~3 years — after that, you're playing with house money.
- By year 2, paydown + projected appreciation supports a ~$41k cash-out refi (75% LTV) — recoverable capital for the next deal without selling this one.
Negotiation context
- Only 11 days on market — expect competitive offers; lowballing is unlikely to land.
- 3 sale attempts with the ask held roughly flat each time — persistent listings suggest the price (not the market) is what's stuck; bring a comps-based counter.
Risks & watch-outs
- Watch-outs: built in 1900 — expect roof / HVAC / electrical / plumbing capex.
Questions for the listing agent
- Built in 1900 — when were the roof, HVAC, electrical panel, plumbing, and water heater last replaced?
- Is there a deadline driving the sale (1031 exchange, divorce, estate, relocation)? That informs how much negotiation room exists.
- Schools are D-rated, which usually means shorter tenancies and higher turnover. Who's the typical renter profile here, and what's been the actual vacancy rate?
- What's the average days-on-market for RENTAL listings here right now (not sales)? A rising rental-DOM trend means longer vacancies and softer asking-rent achievability than the comps imply.
- What's the recent tenant-quality profile in this submarket — average credit score on applications, eviction rate, late-payment / NSF rate, and stable-employment percentage? A property-management company in the area should have these aggregated.
- How much new for-sale + rental construction is in the pipeline within 1–3 miles? Heavy new supply typically softens prices + rents 12–24 months out; constrained supply supports both.
Investment metrics
- 1% rule
- 0.96% ✗
- Cap rate
- 7.45%
- Cash-on-cash
- 4.15%
- DSCR
- 1.18
- GRM
- 8.7
CMA / ARV
- ARV (on-the-fly)
- $251,748
- Comps found
- 12
Show comp detail 12 sales within ~0.75 mi
| Address | Dist | Beds/Ba | Sqft | Sold | Price | $/sf | Match |
|---|---|---|---|---|---|---|---|
| 918 S Broas St | 0.14mi | 4/1.5 (+1) | 2,082 (+4%) | 4mo | $250,000 | $120 | 78 |
| 714 W State St | 0.31mi | 3/2.0 | 1,914 (-4%) | 4mo | $312,000 | $163 | 73 |
| 304 S Front St | 0.29mi | 3/1.5 | 2,043 (+2%) | 12mo | $236,000 | $116 | 73 |
| 710 James St | 0.31mi | 3/1.0 | 1,899 (-5%) | 7mo | $157,000 | $83 | 70 |
| 516 S Front St | 0.14mi | 4/3.5 (+1) | 1,869 (-6%) | 2mo | $235,000 | $126 | 68 |
| 322 Alderman St | 0.35mi | 3/2.0 | 1,810 (-9%) | 3mo | $220,000 | $122 | 64 |
| 917 S Bridge St | 0.21mi | 4/2.0 (+1) | 1,768 (-12%) | 3mo | $223,000 | $126 | 61 |
| 434 Birch St | 0.24mi | 4/2.0 (+1) | 1,787 (-11%) | 15mo | $250,000 | $140 | 52 |
| 1323 S Bridge St | 0.54mi | 3/2.0 | 1,816 (-9%) | 8mo | $232,500 | $128 | 51 |
| 924 S Bridge St | 0.24mi | 4/2.0 (+1) | 1,746 (-13%) | 13mo | $251,000 | $144 | 50 |
| 825 Morgan Dr | 0.55mi | 4/3.0 (+1) | 2,042 (+2%) | 13mo | $350,000 | $171 | 48 |
| 414 Woodland St | 0.73mi | 3/1.0 | 2,086 (+4%) | 13mo | $210,000 | $101 | 46 |
Match score weights: distance 35% · size 25% · config 20% · recency 20%. Top-matched comps best support the ARV.
Projected returns pro-forma
10.0% appreciation · 3.0% rent growth · sell at horizon
- IRR
- 27.3%
- Equity multiple
- 3.16×
- Total profit
- $145,423
- Equity at exit
- $216,121
- IRR
- 23.8%
- Equity multiple
- 7.20×
- Total profit
- $416,599
- Equity at exit
- $466,073
Cash invested: $67,172 (down + closing). Projections, not guarantees.
Landlord ↔ Tenant lean methodology
- Overall (STATE)
- 62 Landlord-Friendly
- State Michigan
- 62 Landlord-Friendly · EVEN
- County
- — inherits STATE
- City
- — inherits STATE
ZIP-level market 48809
- Home prices YoY
- 3.3%
- Active inventory
- 72
- Price-to-rent
- 8.7×
Monthly cashflow live
- Estimated rent
- $2,295 medium interval (Pro) →
- Mortgage (P&I)
- −$1,258
- Tax from tax record
- −$223 /mo · $2,676/yr
- Insurance
- −$100
- HOA
- −$0
- Vacancy / Maint / Mgmt
- −$482
- Net cashflow
- $232
Break-even live
UW: 25.0% down · 7.5% · 30yr · 1.5% tax · 5.0% vac · 8.0% maint · 8.0% mgmt
Financing live
Cash to close
- Down payment
- $59,975
- Closing costs
- $7,197
- Reserves months
- —
- Total cash needed
- —
Loan-product check · same deal, 3 products live
Conventional
25% down · 7.5% · 30yr
- Down + closing
- —
- Monthly P&I
- —
- Monthly cashflow
- —
- DSCR
- —
- Eligible?
- —
Personal DTI + credit; lowest rate.
DSCR
20% down · 8.5% · 30yr
- Down + closing
- —
- Monthly P&I
- —
- Monthly cashflow
- —
- DSCR
- —
- Eligible?
- —
No personal income docs; deal must DSCR.
Hard money
10% down · 12.0% · 12mo
- Down + closing
- —
- Monthly P&I
- —
- Monthly cashflow
- —
- DSCR
- —
- Eligible?
- —
Short-term bridge; refi at stabilization.
Rent comps 1 comps
| Address | Beds | Baths | Sqft | Rent | $/sqft | DOM | Units | Dist |
|---|---|---|---|---|---|---|---|---|
| 372 White Pine Ct Belding, MI | 4.0 | 2.5 | 1750 | $2,295 | $1.31 | 10d | 1 | 0.99mi |
Listing history 8 events
-
2026-06-15status $239,900 Pending 11 DOM
-
2026-06-15days on market $239,900 Active 11 DOM
-
2026-06-14days on market $239,900 Active 9 DOM
-
2026-06-10days on market $239,900 Active 6 DOM
-
2026-06-09days on market $239,900 Active 5 DOM
-
2026-06-08days on market $239,900 Active 4 DOM
-
2026-06-07remarks 699-char remark
-
2026-06-07$239,900 Active 3 DOM
ⓘ Source: listings_history table (triggers on properties + properties_extension) + one-shot
backfill from property_details.listing_events for pre-trigger history.
Tax reassessment forecast MI · Partial reset (capped growth)
- Current annual tax
- $2,676 · $223/mo
- Projected year-2 tax
- $3,185 · $265/mo
- Expected delta
- +$509/yr (+$42/mo · 19.0%)
ⓘ Screening estimate from a state-policy table — verify with the county assessor before closing.
Climate risk First Street
- Flood 1/10 Low FEMA zone X (unshaded) · 0% chance over 30 yrs
- Wildfire 1/10 Low
- Heat 3/10 Moderate 7 d/yr ≥98°F today · 15 d/yr by 30 yrs out
- Wind 2/10 Low
- Air quality 2/10 Low 1 unhealthy d/yr today · 2 by 30 yrs out
Nearby sold comps map
Loading sold comps map…
Walkable amenities ~0.75 mi
Loading nearby amenities…
Taxation est. · year 1
- Rental income
- $27,540
- − Mortgage interest
- −$13,438
- − Property taxes
- −$2,676
- − Insurance
- −$1,200
- − Repairs & maintenance
- −$2,203
- − Management
- −$2,203
- − Depreciation
- −$6,979
- Taxable loss
- −$1,159
- Est. tax savings @ 24.0%
- +$278
- After-tax cash flow
- $3,063/yr
For passive investors: Depreciation is non-cash, so a rental often shows a tax loss while cash-flowing — sheltering income. Rental losses are passive: they offset passive income freely, and up to $25,000/yr can offset ordinary (W-2) income if you actively participate and your MAGI is under $100k (phasing out to $0 by $150k); unused losses carry forward. On sale, claimed depreciation is recaptured at up to 25%, and gains may owe capital-gains tax (a 1031 exchange can defer both). Figures are a year-1 estimate at your 24.0% rate — not tax advice; consult a CPA.
Schools (NCES district)
- District
- Belding Area School District
- NCES district ID
- 2604530
- Math proficiency
- 23% ▼ -9.00%
- Reading proficiency
- 31% ▼ -8.00%
- Median HH income
- $46,310
- Composite
- 23.33/100
- National rank
- #7915
- State rank
- #398 of 540 in MI
Livability — Belding
- Score
- 74/100
- State rank
- #169
- US rank
- #4436
Category grades
Schools grade is shown separately in the Schools card above.
Census & demographics
- Census place
- Belding, MI
- Population (ZIP)
- 11,292
Population outlook (Ionia County) Hauer SSP2
- Today (2025)
- 63,958 people
- By 2030
- 63,321 · -1.0%
- By 2040
- 61,544 · -3.8%
- By 2050
- 58,682 · -8.2%
- By 2075
- 48,909 · -23.5%
- By 2100
- 35,867 · -43.9%
Race, ethnicity, and origin ACS 2023
- Neighborhood character
- Predominantly White (91%)
- Race & ethnicity
- White 91% Hispanic / Latino 4% Two or more races 4%
- Common ancestry
- Iranian 7% Romanian 4% Lithuanian 3%
- Foreign-born
- 1% · Canada, China
- Languages at home
- 95% English-only · Spanish 3% Russian/Polish/Slavic 1%
Political lean MEDSL · Ionia
- 2024 margin
- Solid R (+31.9) · D 33.3% · R 65.2% · Other 1.5%
- 2008→2024 swing
- -26.0pp toward R · 2008: -5.8pp · 2024: -31.9pp
- All cycles
- 2024: R+31.9 2020: R+30.3 2016: R+31.0 2012: R+12.8 2008: R+5.8
Not yet ingested
- Civics
- —
Market trends
- HPI YoY
- ▲ 13.30%
- Current HPI
- 412.5108
- Rent YoY
- —
- Metro
- —
- State GDP YoY
- ▲ 1.37%
- F500 in state
- 28
Industry mix (Fortune 500 HQ in MI)
| Industry | F500 HQs | Revenue |
|---|---|---|
| Automotive Parts | 3 | $48B |
|
||
| Automotive | 2 | $372B |
|
||
| Chemicals | 1 | $45B |
|
||
| Automotive Retail | 1 | $29B |
|
||
| Healthcare / Medical Devices | 1 | $23B |
|
||
| Automotive Technology | 1 | $20B |
|
||
Price history
+0.0% since first listed3 events — show timeline
- 2026-06-04 Listed $239,900 MiRealSource-MiMLS
- 2026-06-04 Listed $239,900 REALCOMP
- 2026-06-04 Listed $239,900 SW Michigan MLS
Property tax history
+7.7%/yrLatest (2025): $2,676 · +2.7% YoY. Source: county tax records.
Cash-flow waterfall
monthlySold comps — $/sqft
last 12 mo · ≤1 miLoading sold comps…