9 Van Ct · Overlea, MD
Flood risk 1/10 · Minimal
- FEMA flood zone
- X (unshaded)
- Chance of flooding over 30 yrs
- 0.0%
- Est. flood insurance / yr
- $473 – $860
Fire risk 1/10 · Minimal
- Est. fire insurance / yr
- $755 – $1,403
Heat risk 7/10 · Major
- Hot days now (above 103°F)
- 7 days/yr
- Hot days in 30 yrs
- 15 days/yr
Wind risk 6/10 · Moderate
- Chance of severe wind over 30 yrs
- 27.0%
Air-quality risk 5/10 · Moderate
- Unhealthy air days now
- 6 days/yr
- Unhealthy air days in 30 yrs
- 8 days/yr
Risk factors via First Street. Map © Google.
Why this score? — see what drove the F grade
The composite is a weighted blend of 9 inputs, each scored 0–100. Each bar is that input's sub-score; the figure is the points it added to the 100-point composite (weight × sub-score).
- Cash flow +13.6/30.0
- DSCR +4.1/10.0
- Livability +4.0/5.0
- Rent growth +3.6/5.0
- 1% rule +3.5/10.0
- Condition / age +2.5/5.0
- Schools +2.3/10.0
- ARV discount +0.0/15.0
- Appreciation +0.0/10.0
$245,000
🖨 Deal sheet 📄 Offer letter ✓ Due diligence
Listing remarks MLS
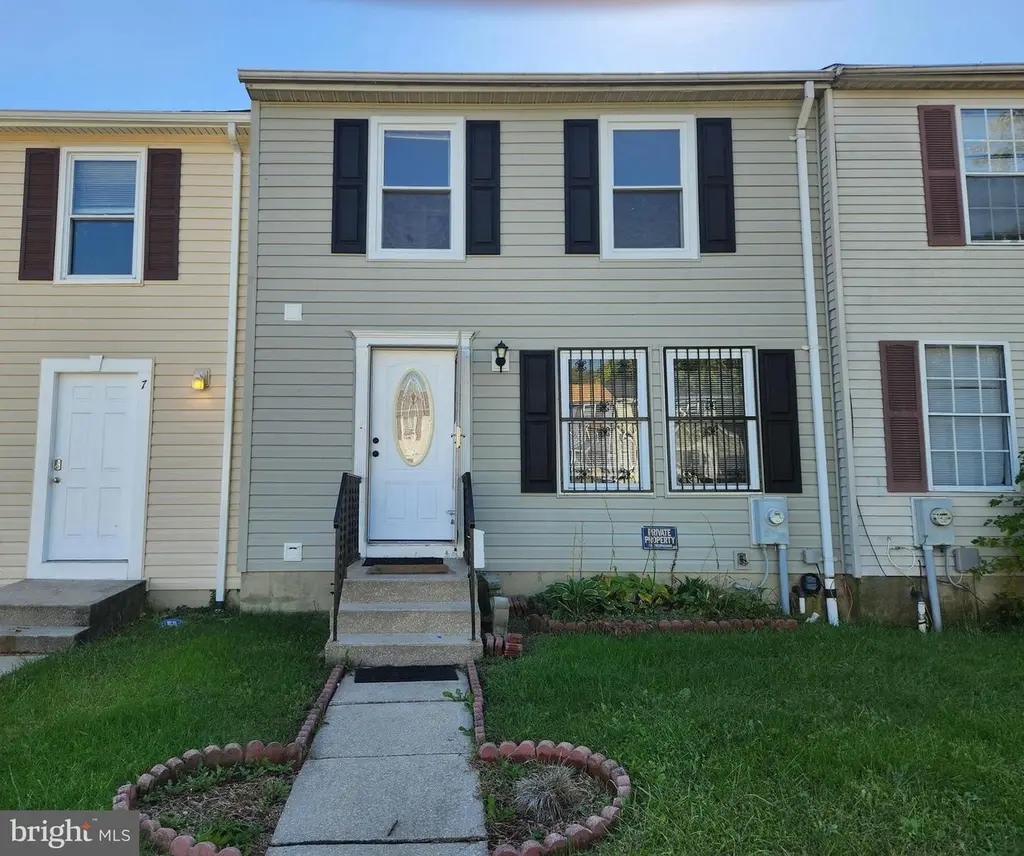
This home is back on the market!! Previous buyer struggled with financing. Stop what you are doing and come see this home. FHA appraisal was completed and appraised over list price! Empty and ready to settle. Stop paying your landlords mortgage! Here is your chance to own your own home in Baltimore County for less than most pay in rent. Paint the walls the colors you like and get that puppy you always wanted! This home offers 3 bedroom 1.5 baths with a full basement. Main level has family room, kitchen, and half bath with sliding glass doors leading to the back deck. Second floor has 3 bedrooms and full bath. Basement has large room used as bedroom but has unlimited potential use and utility room. Fully fenced rear yard gives privacy. In a quite community with NO rear neighbors. Move on in and make it your forever home!
Key facts
- Fenced backyard
- Built 1984
- Listed 3 days
Tags
Property features AI
Exterior
- Parking: Parking lot
- Utilities: Public water; Public sewer; Electric service
- Home design: Interior townhouse/rowhouse; Frame construction
- Construction: Frame construction; Concrete perimeter foundation; Above-grade and below-grade structures
- Exterior features: Not in a federal flood zone; Ground rent due annually
Interior
- Bedrooms: Three bedrooms on the upper level
- Bathrooms: One full bathroom (upper level); One half bathroom (main level)
- Heating & cooling: Forced air heating (electric); Central air conditioning (electric); Electric hot water
- Interior features: Finished basement with connecting stairway
Neighborhood map
What this means for you Summary
Snapshot
- This is a 3-bed/1.5-bath townhouse listed at $245k.
Deal economics
- At list price, monthly cash flow is $15 ($180/yr) — positive.
- The deal already cash-flows at list — no discount required.
- To meet the 1% rule (rent ≥ 1% of price), the offer needs to be $208k (15.2% below list).
- Recommended offer: $208k (15.2% below list) — sets the bar for 1% rule.
Location & tenants
- Location reads 81/100 on livability (#38 in MD, #1,418 nationally) — a professional / high-income tenant draw. Strengths: amenities A+, commute A+, housing A+; Watch: crime F.
- Baltimore County Public Schools (suburban): math 15% / reading 34% proficiency, ranked #11 of 24 in MD (top 46%) — low school quality limits family demand, transient renter base, plan for 1-2y turnover.
- Market conditions: Rents rising fast (+4.4%/yr); 173 active listings in the ZIP; 37 comparable units currently listed for rent nearby; rentals at typical pace (median 24d on market — plan ~3-4 weeks tenant-placement turnaround); 41% of comp listings sitting > 30 days — soft ceiling on asking rent; 1,511 units permitted in Baltimore County in 2024 (643 in 5+ unit buildings).
- This rent runs 39% of the median local income ($65k/yr) — at the standard rent-burdened threshold; future hikes will face affordability resistance.
Forward outlook
- Local home prices are declining (-3.0%/yr); year-one equity from $2k of loan paydown is wiped out by about $7k of value loss. Plan a longer hold.
- Baltimore County population projected at +12% by 2050 — modest demand growth; plan on rents tracking national, not racing it.
Negotiation context
- Only 3 days on market — expect competitive offers; lowballing is unlikely to land.
- 10 sale attempts since 33y ago; this cycle's ask is 12795% above the opening price — seller raised mid-cycle; expect resistance to lowballs.
- Current owner paid $180k; 36% above their basis — modest negotiation headroom, anchor on the comps not their cost.
Risks & watch-outs
- Climate carrying-cost: major wind risk, 27% chance of damaging wind over 30y; extreme-heat days projected 7→15/yr by 2055 (HVAC capex compounding) — expect insurance premiums to compound above CPI over the hold.
Questions for the listing agent
- Is there a deadline driving the sale (1031 exchange, divorce, estate, relocation)? That informs how much negotiation room exists.
- Crime grade is F in this area — have there been break-ins, vandalism, or insurance claims at this property in the last 3 years? What carrier currently insures it and at what premium?
- The area grade is low — what's the realistic commute time and amenity access for the typical tenant pool here? Any planned neighborhood developments (good or bad) we should know about?
- What's the average days-on-market for RENTAL listings here right now (not sales)? A rising rental-DOM trend means longer vacancies and softer asking-rent achievability than the comps imply.
- What's the recent tenant-quality profile in this submarket — average credit score on applications, eviction rate, late-payment / NSF rate, and stable-employment percentage? A property-management company in the area should have these aggregated.
- How much new for-sale + rental construction is in the pipeline within 1–3 miles? Heavy new supply typically softens prices + rents 12–24 months out; constrained supply supports both.
Investment metrics
- 1% rule
- 0.85% ✗
- Cap rate
- 6.37%
- Cash-on-cash
- 0.26%
- DSCR
- 1.01
- GRM
- 9.8
CMA / ARV
- ARV (on-the-fly)
- $188,045
- Comps found
- 12
Show comp detail 12 sales within ~0.75 mi
| Address | Dist | Beds/Ba | Sqft | Sold | Price | $/sf | Match |
|---|---|---|---|---|---|---|---|
| 5663 Whitby Rd | 0.15mi | 3/1.5 | 1,334 (+1%) | 1mo | $204,000 | $153 | 90 |
| 5552 Whitby Rd | 0.32mi | 3/1.5 | 1,440 (+10%) | 2mo | $183,800 | $128 | 67 |
| 5528 Whitby Rd | 0.38mi | 3/1.5 | 1,440 (+10%) | 1mo | $185,000 | $128 | 65 |
| 5904 Willet Ave | 0.40mi | 2/1.0 (-1) | 1,258 (-4%) | 5mo | $180,000 | $143 | 63 |
| 5538 Whitwood Rd | 0.46mi | 3/1.5 | 1,452 (+10%) | 1mo | $195,000 | $134 | 60 |
| 5637 Utrecht Rd | 0.31mi | 3/1.5 | 1,480 (+12%) | 6mo | $193,980 | $131 | 60 |
| 6021 Arizona Ave | 0.33mi | 3/1.5 | 1,152 (-12%) | 6mo | $164,900 | $143 | 60 |
| 5536 Whitby Rd | 0.36mi | 3/1.5 | 1,152 (-12%) | 6mo | $137,500 | $119 | 58 |
| 5631 Utrecht Rd | 0.32mi | 3/1.5 | 1,484 (+13%) | 9mo | $249,999 | $168 | 56 |
| 5454 Cedonia Ave | 0.57mi | 4/2.0 (+1) | 1,152 (-12%) | 1mo | $215,000 | $187 | 45 |
| 8124 Bartholomew Ct | 0.58mi | 3/2.5 | 1,148 (-13%) | 6mo | $330,900 | $288 | 43 |
| 5529 Todd Ave | 0.64mi | 3/1.5 | 1,500 (+14%) | 8mo | $195,000 | $130 | 40 |
Match score weights: distance 35% · size 25% · config 20% · recency 20%. Top-matched comps best support the ARV.
Projected returns pro-forma
-3.0% appreciation · 4.43% rent growth · sell at horizon
- IRR
- -14.4%
- Equity multiple
- 0.48×
- Total profit
- $-35,724
- Equity at exit
- $36,530
- IRR
- -3.5%
- Equity multiple
- 0.75×
- Total profit
- $-17,112
- Equity at exit
- $21,183
Cash invested: $68,600 (down + closing). Projections, not guarantees.
Landlord ↔ Tenant lean methodology
- Overall (STATE)
- 27 Tenant-Leaning
- State Maryland
- 27 Tenant-Leaning · D+14
- County
- — inherits STATE
- City
- — inherits STATE
ZIP-level market 21206
- Rents YoY
- 4.4%
- Active inventory
- 173
- Price-to-rent
- 9.8×
Monthly cashflow live
- Estimated rent
- $2,077 high interval (Pro) →
- Mortgage (P&I)
- −$1,285
- Tax from tax record
- −$239 /mo · $2,869/yr
- Insurance
- −$102
- HOA
- −$0
- Vacancy / Maint / Mgmt
- −$436
- Net cashflow
- $15
Break-even live
UW: 25.0% down · 7.5% · 30yr · 1.5% tax · 5.0% vac · 8.0% maint · 8.0% mgmt
Financing live
Cash to close
- Down payment
- $61,250
- Closing costs
- $7,350
- Reserves months
- —
- Total cash needed
- —
Loan-product check · same deal, 3 products live
Conventional
25% down · 7.5% · 30yr
- Down + closing
- —
- Monthly P&I
- —
- Monthly cashflow
- —
- DSCR
- —
- Eligible?
- —
Personal DTI + credit; lowest rate.
DSCR
20% down · 8.5% · 30yr
- Down + closing
- —
- Monthly P&I
- —
- Monthly cashflow
- —
- DSCR
- —
- Eligible?
- —
No personal income docs; deal must DSCR.
Hard money
10% down · 12.0% · 12mo
- Down + closing
- —
- Monthly P&I
- —
- Monthly cashflow
- —
- DSCR
- —
- Eligible?
- —
Short-term bridge; refi at stabilization.
Rent comps 37 comps
| Address | Beds | Baths | Sqft | Rent | $/sqft | DOM | Units | Dist |
|---|---|---|---|---|---|---|---|---|
| 5307 Valiquet Ave Unit A Baltimore, MD | 2.0 | 1.0 | 1672 | $1,375 | $0.82 | 43d | 1 | 0.23mi |
| 4909 Hamilton Ave Baltimore, MD | 2.0–3.0 | 2.0 | 862 | $1,550 | $1.80 | 3d | 5 | 0.39mi |
| 4907 Hamilton Ave Unit B Baltimore, MD | 3.0 | 2.0 | 925 | $1,699 | $1.84 | 43d | 1 | 0.39mi |
| 4905 Hamilton Ave Apt B Baltimore, MD | 3.0 | 2.0 | 925 | $1,550 | $1.68 | 24d | 1 | 0.39mi |
| 5904 Arizona Ave Unit B Baltimore, MD | 3.0 | 2.0 | 925 | $1,550 | $1.68 | 24d | 1 | 0.40mi |
| 4903 1/2 Hamilton Ave Apt B Baltimore, MD | 3.0 | 2.0 | 925 | $1,550 | $1.68 | 24d | 1 | 0.40mi |
| 5938 Clayton Ave Baltimore, MD | 4.0 | 2.0 | 1296 | $2,872 | $2.22 | 16d | 1 | 0.46mi |
| 8133 Bartholomew Ct Baltimore, MD | 3.0 | 2.5 | 1600 | $2,700 | $1.69 | 24d | 1 | 0.62mi |
| 6042 Barstow Rd Baltimore, MD | 1.0–3.0 | 1.0 | 736 | $1,527 | $2.07 | 2d | 1 | 0.62mi |
| 4308 Hamilton Ave Baltimore, MD | 2.0 | 1.0 | 1110 | $1,416 | $1.28 | 24d | 1 | 0.78mi |
| 4111 Century Rd Baltimore, MD | 3.0 | 1.5 | 1432 | $2,500 | $1.75 | 43d | 1 | 0.79mi |
| 5248 Darien Rd Baltimore, MD | 3.0 | 1.0 | 1584 | $2,100 | $1.33 | 43d | 1 | 0.85mi |
| 5253 Cedgate Rd Unit 1 Baltimore, MD | 3.0 | 1.5 | 1152 | $2,200 | $1.91 | 43d | 1 | 0.85mi |
| 1732 Chesaco Ave Rosedale, MD | 3.0 | 1.0 | 1260 | $2,295 | $1.82 | 43d | 1 | 0.89mi |
| 5313 Todd Ave Baltimore, MD | 3.0 | 1.5 | 1280 | $1,800 | $1.41 | 16d | 1 | 0.95mi |
| 5632 Belair Rd Baltimore, MD | 3.0 | 1.5 | 1260 | $2,100 | $1.67 | 24d | 1 | 0.96mi |
| 4924 Frankford Ave Baltimore, MD | 4.0 | 2.0 | 1176 | $2,600 | $2.21 | 24d | 1 | 0.98mi |
| 8212 Dorset Ave Rosedale, MD | 4.0 | 1.5 | 1479 | $2,250 | $1.52 | 43d | 1 | 1.17mi |
| 3807 Fleetwood Ave Unit 2 Baltimore, MD | 3.0 | 1.0 | 937 | $1,550 | $1.65 | 4d | 1 | 1.21mi |
| 3807 Fleetwood Ave Unit 1 Baltimore, MD | 2.0 | 1.0 | 969 | $1,490 | $1.54 | 4d | 1 | 1.21mi |
| 5424 Belle Vista Ave Baltimore, MD | 2.0 | 1.0 | 932 | $1,300 | $1.39 | 43d | 1 | 1.21mi |
| 4905 Greencrest Rd Baltimore, MD | 3.0 | 1.5 | 1536 | $1,950 | $1.27 | 43d | 1 | 1.21mi |
| 8006 Woodhaven Ct Rosedale, MD | 4.0 | 3.0 | 1680 | $3,200 | $1.90 | 24d | 1 | 1.27mi |
| 5110 Kenwood Ave Baltimore, MD | 3.0 | 1.5 | 1406 | $2,500 | $1.78 | 43d | 1 | 1.33mi |
| 6410 Walther Ave Baltimore, MD | 2.0 | 1.0–2.0 | 1195 | $1,995 | $1.67 | 43d | 7 | 1.33mi |
| 5611 Force Rd Baltimore, MD | 3.0 | 1.5 | 1296 | $1,850 | $1.43 | 43d | 1 | 1.33mi |
| 3607 Bayonne Ave Unit 2 Baltimore, MD | 2.0 | 1.0 | 900 | $1,300 | $1.44 | 24d | 1 | 1.35mi |
| 3721 Frankford Ave Baltimore, MD | 3.0 | 2.0 | 1600 | $2,050 | $1.28 | 43d | 1 | 1.38mi |
| 4007 Biddison Ln Apt 1 Baltimore, MD | 2.0 | 1.0 | 1000 | $1,279 | $1.28 | 18d | 1 | 1.38mi |
| 4023 Belwood Ave Baltimore, MD | 3.0 | 1.0 | 1080 | $1,995 | $1.85 | 43d | 1 | 1.40mi |
| 4517 Woodlea Ave Baltimore, MD | 2.0 | 2.0 | 1326 | $1,900 | $1.43 | 2d | 1 | 1.44mi |
| 4104 Parkwood Ave Baltimore, MD | 3.0 | 1.0 | 1224 | $2,800 | $2.29 | 24d | 1 | 1.44mi |
| 3802 Biddison Ln Baltimore, MD | 4.0 | 1.5 | 1443 | $2,024 | $1.40 | 11d | 1 | 1.47mi |
| 6512 Golden Ring Rd Rosedale, MD | 4.0 | 3.0 | 1089 | $2,800 | $2.57 | 16d | 1 | 1.48mi |
| 100 Elinor Ave Nottingham, MD | 4.0 | 2.5 | 1800 | $2,800 | $1.56 | 24d | 1 | 1.49mi |
| 101 Elinor Ave Nottingham, MD | 4.0 | 2.0 | 1476 | $2,900 | $1.96 | 43d | 1 | 1.49mi |
| 2009 Longview Ave Rosedale, MD | 3.0 | 2.0 | 1062 | $2,500 | $2.35 | 15d | 1 | 1.50mi |
Listing history 4 events
-
2026-06-18days on market $245,000 Coming Soon 3 DOM
-
2026-06-17days on market $245,000 Coming Soon 2 DOM
-
2026-06-15remarks 133-char remark
-
2026-06-15$245,000 Coming Soon 1 DOM
ⓘ Source: listings_history table (triggers on properties + properties_extension) + one-shot
backfill from property_details.listing_events for pre-trigger history.
Tax reassessment forecast MD · Partial reset (capped growth)
- Current annual tax
- $2,869 · $239/mo
- Projected year-2 tax
- $2,869 · $239/mo
- Expected delta
- $0/yr ($0/mo · 0.0%)
ⓘ Screening estimate from a state-policy table — verify with the county assessor before closing.
Climate risk First Street
- Flood 1/10 Low FEMA zone X (unshaded) · 0% chance over 30 yrs
- Wildfire 1/10 Low
- Heat 7/10 Severe 7 d/yr ≥103°F today · 15 d/yr by 30 yrs out
- Wind 6/10 Major 27% chance of damaging wind over 30 yrs
- Air quality 5/10 Major 6 unhealthy d/yr today · 8 by 30 yrs out
Nearby sold comps map
Loading sold comps map…
Walkable amenities ~0.75 mi
Loading nearby amenities…
Taxation est. · year 1
- Rental income
- $24,926
- − Mortgage interest
- −$13,724
- − Property taxes
- −$2,869
- − Insurance
- −$1,225
- − Repairs & maintenance
- −$1,994
- − Management
- −$1,994
- − Depreciation
- −$7,127
- Taxable loss
- −$4,007
- Est. tax savings @ 24.0%
- +$962
- After-tax cash flow
- $1,142/yr
For passive investors: Depreciation is non-cash, so a rental often shows a tax loss while cash-flowing — sheltering income. Rental losses are passive: they offset passive income freely, and up to $25,000/yr can offset ordinary (W-2) income if you actively participate and your MAGI is under $100k (phasing out to $0 by $150k); unused losses carry forward. On sale, claimed depreciation is recaptured at up to 25%, and gains may owe capital-gains tax (a 1031 exchange can defer both). Figures are a year-1 estimate at your 24.0% rate — not tax advice; consult a CPA.
Schools (NCES district)
- District
- Baltimore County Public Schools
- NCES district ID
- 2400120
- Math proficiency
- 15% ▼ -16.00%
- Reading proficiency
- 34% ▼ -5.00%
- Median HH income
- $66,746
- Composite
- 23.17/100
- National rank
- #7948
- State rank
- #11 of 24 in MD
Livability — Overlea
- Score
- 81/100
- State rank
- #38
- US rank
- #1418
Category grades
Schools grade is shown separately in the Schools card above.
Census & demographics
- Census place
- Overlea, MD
- County
- Baltimore City · 558,601 people
- Metro
- Baltimore-Columbia-Towson, MD
- Population (ZIP)
- 48,902
- Household income
- $64,531
- Rent vs Own
- Severe rent burden
- 2317.0
Population outlook (Baltimore County) Hauer SSP2
- Today (2025)
- 885,518 people
- By 2030
- 909,272 · +2.7%
- By 2040
- 951,547 · +7.5%
- By 2050
- 990,955 · +11.9%
- By 2075
- 1,086,411 · +22.7%
- By 2100
- 1,135,078 · +28.2%
Race, ethnicity, and origin ACS 2023
- Neighborhood character
- Predominantly Black (73%)
- Race & ethnicity
- Black 73% White 20% Two or more races 3% Hispanic / Latino 3% Asian 2%
- Common ancestry
- Romanian 3% Ukrainian 1%
- Foreign-born
- 8% · Canada
- Languages at home
- 92% English-only · Spanish 2% Arabic 2% Other Indo-European 1%
Political lean MEDSL · Baltimore
- 2024 margin
- Strong D (+24.5) · D 61.0% · R 36.5% · Other 2.5%
- 2008→2024 swing
- +9.9pp toward D · 2008: 14.6pp · 2024: 24.5pp
- All cycles
- 2024: D+24.5 2020: D+27.0 2016: D+17.4 2012: D+16.4 2008: D+14.6
Not yet ingested
- Civics
- —
Market trends
- HPI YoY
- ▼ -191.83%
- Current HPI
- 284.5645
- Rent YoY
- ▲ 4.43%
- Metro
- Baltimore-Columbia-Towson, MD
- State GDP YoY
- ▲ 2.97%
- F500 in state
- 12
Industry mix (Fortune 500 HQ in MD)
| Industry | F500 HQs | Revenue |
|---|---|---|
| Aerospace / Defense | 1 | $71B |
|
||
| Utilities | 1 | $25B |
|
||
| Hotels | 1 | $24B |
|
||
| Consumer Goods | 1 | $7B |
|
||
| Real Estate | 1 | $6B |
|
||
| Chemicals | 1 | $2B |
|
||
Price history
+250.5% since first listed38 events — show timeline
- 2026-06-15 Coming Soon $245,000 BRIGHT MLS
- 2024-04-10 Rental Removed $1,900 BRIGHTMLS
- 2024-02-22 Listed for Rent $1,900 BRIGHTMLS
- 2022-09-02 Sold (MLS) $180,000 BRIGHT MLS
- 2022-08-31 Pending — BRIGHT MLS
- 2022-08-03 Listing Removed — BRIGHT MLS
- 2022-07-19 Price Changed $174,996 BRIGHT MLS
- 2022-07-15 Relisted — BRIGHT MLS
- 2022-06-23 Pending — BRIGHT MLS
- 2022-05-20 Relisted — BRIGHT MLS
- 2022-05-16 Listing Removed — BRIGHT MLS
- 2022-05-14 Price Changed $174,997 BRIGHT MLS
- 2022-05-13 Price Changed $174,998 BRIGHT MLS
- 2022-05-09 Price Changed $174,999 BRIGHT MLS
- 2022-05-04 Listed $175,000 BRIGHT MLS
- 2010-05-13 Sold (Public Records) $120,000 Public Records
- 2010-04-23 Sold (MLS) $120,000 MRIS
- 2010-04-23 Sold (MLS) $120,000 BRIGHT MLS
- 2009-10-28 Pending — MRIS
- 2009-09-01 Delisted — MRIS
- 2009-08-30 Listing Removed — BRIGHT MLS
- 2009-08-05 Price Changed $120,000 MRIS
- 2009-07-09 Price Changed $126,900 MRIS
- 2009-06-15 Price Changed $130,000 MRIS
- 2009-05-21 Price Changed $140,000 MRIS
- 2009-03-09 Listed $165,000 MRIS
- 2009-03-09 Listed $120,000 BRIGHT MLS
- 2007-11-26 Delisted — MRIS
- 2007-08-26 Listed — MRIS
- 2000-06-12 Sold (Public Records) $80,000 Public Records
- 2000-05-31 Sold (MLS) $80,000 MRIS
- 2000-03-19 Delisted — MRIS
- 1999-08-29 Listed $78,000 MRIS
- 1996-06-06 Sold (Public Records) $69,900 Public Records
- 1996-05-23 Delisted — MRIS
- 1995-11-24 Listed — MRIS
- 1994-02-10 Delisted — MRIS
- 1993-08-10 Listed — MRIS
Property tax history
+1.8%/yrLatest (2025): $2,869 · -24.1% YoY. Source: county tax records.
Cash-flow waterfall
monthlySold comps — $/sqft
last 12 mo · ≤1 miLoading sold comps…