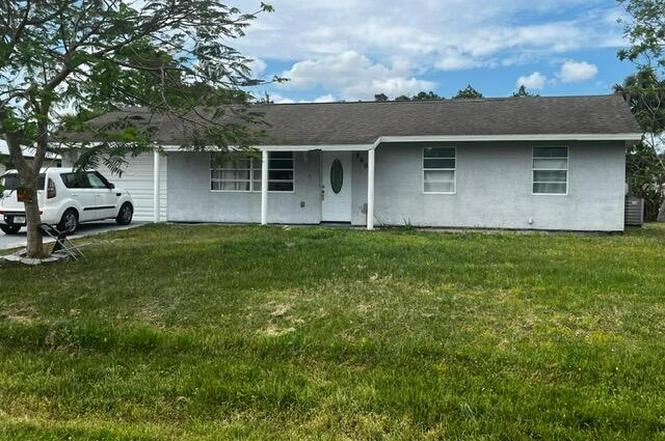
8602 Lakeland Blvd · Lakewood Park, FL
Flood risk 1/10 · Minimal
- FEMA flood zone
- X (unshaded)
- Chance of flooding over 30 yrs
- 0.0%
- Est. flood insurance / yr
- $507 – $1,088
Fire risk 2/10 · Minimal
- Est. fire insurance / yr
- $947 – $1,759
Heat risk 10/10 · Severe
- Hot days now (above 107°F)
- 7 days/yr
- Hot days in 30 yrs
- 25 days/yr
Wind risk 10/10 · Severe
- Chance of severe wind over 30 yrs
- 99.0%
Air-quality risk 1/10 · Minimal
- Unhealthy air days now
- 0 days/yr
- Unhealthy air days in 30 yrs
- 0 days/yr
Risk factors via First Street. Map © Google.
Why this score? — see what drove the D grade
The composite is a weighted blend of 9 inputs, each scored 0–100. Each bar is that input's sub-score; the figure is the points it added to the 100-point composite (weight × sub-score).
- Cash flow +14.7/30.0
- ARV discount +7.6/15.0
- 1% rule +4.5/10.0
- DSCR +4.5/10.0
- Schools +3.7/10.0
- Livability +3.2/5.0
- Rent growth +2.5/5.0
- Condition / age +2.5/5.0
- Appreciation +0.0/10.0
$250,000
🖨 Deal sheet (PDF) 📄 Offer letter ✓ Due diligence
Listing remarks MLS
Come take a look at this Super Cute home that's centrally located in the Desirable Lakewood park neighborhood. The Area is mins from highways, Beach's and downtown Fort pierce. The home offers tile throughout along with an updated White kitchen. Call to book your appointment today!
Key facts
- Centrally located
- Remodeled property
- Close to beaches
Tags
Property features AI
Finance
- Other: Pets allowed
- HOA & community: Association fee $6.25 per month; Association amenities: None
Exterior
- Parking: Attached garage (1 covered space, 1 garage space)
- Utilities: Well water; Septic tank; Three-phase electric; Cable available; Water available
- Home design: Single-family residence; One-story; Entry level living area; Faces south; Resale condition
- Construction: Frame and stucco construction; Composition/shingle roof
- Exterior features: Covered patio; Open patio; Screened patio; Porch; Room for pool
Interior
- Kitchen: Dishwasher; Electric range; Microwave; Refrigerator
- Bedrooms: 3 bedrooms on the main level
- Bathrooms: 2 full bathrooms on the main level
- Heating & cooling: Central heating (electric); Central air conditioning (electric)
- Interior features: Water softener (owned); Unfurnished
- Laundry & utility: Laundry area in garage; Electric water heater
Neighborhood map
What this means for you Summary
Snapshot
- This is a 3-bed/2.0-bath single-family listed at $250k.
Deal economics
- At list price, monthly cash flow is $65 ($775/yr) — positive.
- The deal already cash-flows at list — no discount required.
- To meet the 1% rule (rent ≥ 1% of price), the offer needs to be $237k (5.3% below list).
- Recommended offer: $220k (12.0% below list) — sets the bar for market timing.
Location & tenants
- Location reads 63/100 on livability (#719 in FL) — a middle-class / working-renter tenant base. Strengths: cost of living A+, housing A+; Watch: amenities F, commute F, health & safety D-.
- St. Lucie (urban): math 40% / reading 48% proficiency, ranked #51 of 73 in FL (top 70%) — families likely to look elsewhere, expect single-tenant / working-renter base with shorter leases.
- Zoned schools: Manatee Academy K-8 (math 53% / reading 51%, grade C-, #990 of 2,144 statewide, top 48%, 1,664 students, 65% FRL); Southern Oaks Middle School (math 39% / reading 43%, grade F, #353 of 571 statewide, top 63%, 894 students, 76% FRL); Fort Pierce Central High School (math 15% / reading 45%, grade F, #441 of 667 statewide, top 67%, 3,091 students, 62% FRL).
- Market conditions: 296 active listings in the ZIP; 6 comparable units currently listed for rent nearby; rentals at typical pace (median 23d on market — plan ~3-4 weeks tenant-placement turnaround); 4,868 units permitted in St. Lucie County in 2024 (268 in 5+ unit buildings).
- At $2,368/mo this rent would consume 45% of the median local household income ($63k/yr) (locally 140% of renters already pay >50% of income on rent) — very limited rent-growth headroom before tenants either downsize or default.
Forward outlook
- Local home prices are declining (-3.0%/yr); year-one equity from $2k of loan paydown is wiped out by about $8k of value loss. Plan a longer hold.
- St. Lucie County population projected at +20% by 2050 — long-run rental-demand tailwind backs the buy-and-hold thesis.
Negotiation context
- It's been on market 392 days — a 12% lower offer ($220k) is reasonable based on typical stale-listing flexibility.
- 11 sale attempts since 24y ago; this cycle's ask has dropped $19k (7%) from the opening price — seller is motivated, your offer sets the floor, not the list.
- Current owner paid $215k; 16% above their basis — modest negotiation headroom, anchor on the comps not their cost.
Risks & watch-outs
- Climate carrying-cost: severe wind risk, 99% chance of damaging wind over 30y; extreme-heat days projected 7→25/yr by 2055 (HVAC capex compounding) — expect insurance premiums to compound above CPI over the hold.
Questions for the listing agent
- It's been on market 392 days. Have you received any prior offers? Is the seller open to a 12% concession, seller financing, or rate buy-down credit?
- What does the HOA fee cover, when was the last increase, and are there any pending special assessments or reserve-fund shortfalls?
- Why hasn't it sold? Are there any deal-killer items the seller is aware of (foundation, flood, title, zoning, code violations)?
- Is there a deadline driving the sale (1031 exchange, divorce, estate, relocation)? That informs how much negotiation room exists.
- Schools are F-rated, which usually means shorter tenancies and higher turnover. Who's the typical renter profile here, and what's been the actual vacancy rate?
- The area grade is low — what's the realistic commute time and amenity access for the typical tenant pool here? Any planned neighborhood developments (good or bad) we should know about?
- What's the average days-on-market for RENTAL listings here right now (not sales)? A rising rental-DOM trend means longer vacancies and softer asking-rent achievability than the comps imply.
- What's the recent tenant-quality profile in this submarket — average credit score on applications, eviction rate, late-payment / NSF rate, and stable-employment percentage? A property-management company in the area should have these aggregated.
- How much new for-sale + rental construction is in the pipeline within 1–3 miles? Heavy new supply typically softens prices + rents 12–24 months out; constrained supply supports both.
Investment metrics
- 1% rule
- 0.95% ✗
- Cap rate
- 6.60%
- Cash-on-cash
- 1.11%
- DSCR
- 1.05
- GRM
- 8.8
CMA / ARV
- ARV (on-the-fly)
- $250,640
- Comps found
- 3
Show comp detail 3 sales within ~0.75 mi
| Address | Dist | Beds/Ba | Sqft | Sold | Price | $/sf | Match |
|---|---|---|---|---|---|---|---|
| 8206 Bayard Rd | 0.39mi | 2/1.0 (-1) | 1,130 (+9%) | 10mo | $215,000 | $190 | 50 |
| 1746 25th St SW | 0.71mi | 3/2.0 | 996 (-4%) | 13mo | $240,000 | $241 | 48 |
| 7908 Kenwood Rd | 0.60mi | 3/2.0 | 1,140 (+10%) | 17mo | $300,000 | $263 | 42 |
Match score weights: distance 35% · size 25% · config 20% · recency 20%. Top-matched comps best support the ARV.
Projected returns pro-forma
-3.0% appreciation · 3.0% rent growth · sell at horizon
- IRR
- -14.5%
- Equity multiple
- 0.48×
- Total profit
- $-36,311
- Equity at exit
- $37,276
- IRR
- -5.7%
- Equity multiple
- 0.63×
- Total profit
- $-25,979
- Equity at exit
- $21,615
Cash invested: $70,000 (down + closing). Projections, not guarantees.
Landlord ↔ Tenant lean methodology
- Overall (STATE)
- 87 Strongly Landlord-Friendly
- State Florida
- 87 Strongly Landlord-Friendly · R+3
- County
- — inherits STATE
- City
- — inherits STATE
ZIP-level market 34951
- Home prices YoY
- -23.6%
- Active inventory
- 296
- Price-to-rent
- 8.8×
Monthly cashflow live
- Estimated rent
- $2,368 high interval (Pro) →
- Mortgage (P&I)
- −$1,311
- Tax from tax record
- −$385 /mo · $4,619/yr
- Insurance
- −$104
- HOA
- −$6
- Vacancy / Maint / Mgmt
- −$497
- Net cashflow
- $65
Break-even live
Sensitivity live
| Price | -10% $206 | -5% $135 | +0% $65 | +5% $-6 | +10% $-77 |
|---|---|---|---|---|---|
| Rent | -10% $-122 | -5% $-29 | +0% $65 | +5% $158 | +10% $252 |
| Rate | -1.0pp $191 | -0.5pp $128 | base $65 | +0.5pp $0 | +1.0pp $-66 |
UW: 25.0% down · 7.5% · 30yr · 1.5% tax · 5.0% vac · 8.0% maint · 8.0% mgmt
Financing live
Cash to close
- Down payment
- $62,500
- Closing costs
- $7,500
- Reserves months
- —
- Total cash needed
- —
Loan-product check · same deal, 3 products live
Conventional
25% down · 7.5% · 30yr
- Down + closing
- —
- Monthly P&I
- —
- Monthly cashflow
- —
- DSCR
- —
- Eligible?
- —
Personal DTI + credit; lowest rate.
DSCR
20% down · 8.5% · 30yr
- Down + closing
- —
- Monthly P&I
- —
- Monthly cashflow
- —
- DSCR
- —
- Eligible?
- —
No personal income docs; deal must DSCR.
Hard money
10% down · 12.0% · 12mo
- Down + closing
- —
- Monthly P&I
- —
- Monthly cashflow
- —
- DSCR
- —
- Eligible?
- —
Short-term bridge; refi at stabilization.
Rent comps 6 comps
| Address | Beds | Baths | Sqft | Rent | $/sqft | DOM | Units | Dist |
|---|---|---|---|---|---|---|---|---|
| 7503 Paso Robles Blvd Fort Pierce, FL | 3.0 | 2.0 | 1260 | $2,000 | $1.59 | 25d | 1 | 0.72mi |
| 7500 Pensacola Rd Fort Pierce, FL | 3.0 | 2.0 | 1125 | $2,150 | $1.91 | 15d | 1 | 0.75mi |
| 7403 Winter Garden Pkwy Fort Pierce, FL | 3.0 | 2.0 | 1372 | $2,200 | $1.60 | 23d | 1 | 1.00mi |
| 6906 Ocala Ave Fort Pierce, FL | 3.0 | 2.0 | 1175 | $1,955 | $1.66 | 15d | 1 | 1.13mi |
| 985 23rd Pl SW Vero Beach, FL | 3.0 | 2.0 | 1176 | $2,200 | $1.87 | 23d | 1 | 1.29mi |
| 2450 8th Ave SW Vero Beach, FL | 3.0 | 2.0 | 1388 | $2,100 | $1.51 | 23d | 1 | 1.48mi |
HOA detail
- Monthly dues
- $6 · $72/yr
Listing history 50 events
-
2026-06-21days on market $250,000 Active 392 DOM
-
2026-06-18days on market $250,000 Active 389 DOM
-
2026-06-17days on market $250,000 Active 388 DOM
-
2026-06-16days on market $250,000 Active 387 DOM
-
2026-06-15days on market $250,000 Active 386 DOM
-
2026-06-14days on market $250,000 Active 384 DOM
-
2026-06-13days on market $250,000 Active 383 DOM
-
2026-06-10days on market $250,000 Active 381 DOM
-
2026-06-09days on market $250,000 Active 380 DOM
-
2026-06-08days on market $250,000 Active 379 DOM
-
2026-06-07days on market $250,000 Active 378 DOM
-
2026-06-05days on market $250,000 Active 375 DOM
-
2026-06-03days on market $250,000 Active 374 DOM
-
2026-06-02days on market $250,000 Active 373 DOM
-
2026-06-01days on market $250,000 Active 372 DOM
-
2026-05-31days on market $250,000 Active 371 DOM
-
2026-05-30days on market $250,000 Active 370 DOM
-
2026-05-21status Active
-
2026-04-30historical
-
2025-11-21price $250,000
-
2025-05-01$269,000 Active
-
2025-01-15soldstatus $215,000
-
2025-01-14soldstatus $215,000 Closed 282-char remark
Show marketing remark (282 chars)
Come take a look at this Super Cute home that's centrally located in the Desirable Lakewood park neighborhood. The Area is mins from highways, Beach's and downtown Fort pierce. The home offers tile throughout along with an updated White kitchen. Call to book your appointment today!
-
2025-01-09status Pending 282-char remark
Show marketing remark (282 chars)
Come take a look at this Super Cute home that's centrally located in the Desirable Lakewood park neighborhood. The Area is mins from highways, Beach's and downtown Fort pierce. The home offers tile throughout along with an updated White kitchen. Call to book your appointment today!
-
2024-12-05status Active 282-char remark
Show marketing remark (282 chars)
Come take a look at this Super Cute home that's centrally located in the Desirable Lakewood park neighborhood. The Area is mins from highways, Beach's and downtown Fort pierce. The home offers tile throughout along with an updated White kitchen. Call to book your appointment today!
-
2024-12-05historical 282-char remark
Show marketing remark (282 chars)
Come take a look at this Super Cute home that's centrally located in the Desirable Lakewood park neighborhood. The Area is mins from highways, Beach's and downtown Fort pierce. The home offers tile throughout along with an updated White kitchen. Call to book your appointment today!
-
2024-11-25status Active 282-char remark
Show marketing remark (282 chars)
Come take a look at this Super Cute home that's centrally located in the Desirable Lakewood park neighborhood. The Area is mins from highways, Beach's and downtown Fort pierce. The home offers tile throughout along with an updated White kitchen. Call to book your appointment today!
-
2024-10-25historical Active Under Contract 282-char remark
Show marketing remark (282 chars)
Come take a look at this Super Cute home that's centrally located in the Desirable Lakewood park neighborhood. The Area is mins from highways, Beach's and downtown Fort pierce. The home offers tile throughout along with an updated White kitchen. Call to book your appointment today!
-
2024-10-18status Active 282-char remark
Show marketing remark (282 chars)
Come take a look at this Super Cute home that's centrally located in the Desirable Lakewood park neighborhood. The Area is mins from highways, Beach's and downtown Fort pierce. The home offers tile throughout along with an updated White kitchen. Call to book your appointment today!
-
2024-10-07historical Active Under Contract 282-char remark
Show marketing remark (282 chars)
Come take a look at this Super Cute home that's centrally located in the Desirable Lakewood park neighborhood. The Area is mins from highways, Beach's and downtown Fort pierce. The home offers tile throughout along with an updated White kitchen. Call to book your appointment today!
-
2024-09-30$235,000 Active 282-char remark
Show marketing remark (282 chars)
Come take a look at this Super Cute home that's centrally located in the Desirable Lakewood park neighborhood. The Area is mins from highways, Beach's and downtown Fort pierce. The home offers tile throughout along with an updated White kitchen. Call to book your appointment today!
-
2024-09-28historical
-
2024-08-19price $254,900
-
2024-06-19$259,900 Active
-
2020-01-17soldstatus $171,500
-
2020-01-16soldstatus $171,500 Closed
-
2019-12-17historical Active Under Contract
-
2019-12-06price $173,000
-
2019-11-07price $179,000
-
2019-10-08$185,000 Active
-
2018-11-29soldstatus $115,000
-
2018-10-25soldstatus $93,000
-
2018-10-15soldstatus $93,000 Closed
-
2018-09-27status Pending
-
2018-09-26soldstatus $75,000
-
2018-09-22$109,000 Active
-
2013-09-21historical
-
2008-03-20$119,500
-
2002-12-02soldstatus $75,000
-
2002-11-15soldstatus $75,000
ⓘ Source: listings_history table (triggers on properties + properties_extension) + one-shot
backfill from property_details.listing_events for pre-trigger history.
Tax reassessment forecast FL · Resets to sale price
- Current annual tax
- $4,619 · $385/mo
- Projected year-2 tax
- $4,619 · $385/mo
- Expected delta
- $0/yr ($0/mo · 0.0%)
ⓘ Screening estimate from a state-policy table — verify with the county assessor before closing.
Climate risk First Street
- Flood 1/10 Low FEMA zone X (unshaded) · 0% chance over 30 yrs
- Wildfire 2/10 Low
- Heat 10/10 Extreme 7 d/yr ≥107°F today · 25 d/yr by 30 yrs out
- Wind 10/10 Extreme 99% chance of damaging wind over 30 yrs
- Air quality 1/10 Low 0 unhealthy d/yr today · 0 by 30 yrs out
Nearby sold comps map
Loading sold comps map…
Walkable amenities ~0.75 mi
Loading nearby amenities…
Taxation est. · year 1
- Rental income
- $28,417
- − Mortgage interest
- −$14,004
- − Property taxes
- −$4,619
- − Insurance
- −$1,250
- − Repairs & maintenance
- −$2,273
- − Management
- −$2,273
- − HOA
- −$72
- − Depreciation
- −$7,273
- Taxable loss
- −$3,348
- Est. tax savings @ 24.0%
- +$804
- After-tax cash flow
- $1,579/yr
For passive investors: Depreciation is non-cash, so a rental often shows a tax loss while cash-flowing — sheltering income. Rental losses are passive: they offset passive income freely, and up to $25,000/yr can offset ordinary (W-2) income if you actively participate and your MAGI is under $100k (phasing out to $0 by $150k); unused losses carry forward. On sale, claimed depreciation is recaptured at up to 25%, and gains may owe capital-gains tax (a 1031 exchange can defer both). Figures are a year-1 estimate at your 24.0% rate — not tax advice; consult a CPA.
Schools (NCES district)
- District
- St. Lucie
- NCES district ID
- 1201770
- Math proficiency
- 40% ▼ -11.00%
- Reading proficiency
- 48% ▼ -4.00%
- Median HH income
- $44,737
- Composite
- 37.28/100
- National rank
- #4449
- State rank
- #51 of 73 in FL
Livability — Lakewood Park
- Score
- 63/100
- State rank
- #719
- US rank
- #15407
Category grades
Schools grade is shown separately in the Schools card above.
Census & demographics
- Census place
- Lakewood Park, FL
- County
- Saint Lucie County · 337,150 people
- Metro
- Port St. Lucie, FL
- Population (ZIP)
- 17,148
- Household income
- $63,122
- Rent vs Own
- Severe rent burden
- 140.0
Population outlook (St. Lucie County) Hauer SSP2
- Today (2025)
- 338,016 people
- By 2030
- 355,687 · +5.2%
- By 2040
- 385,521 · +14.1%
- By 2050
- 406,106 · +20.1%
- By 2075
- 441,054 · +30.5%
- By 2100
- 436,885 · +29.2%
Race, ethnicity, and origin ACS 2023
- Neighborhood character
- Predominantly White (74%)
- Race & ethnicity
- White 74% Black 13% Hispanic / Latino 8% Two or more races 7% Asian 2%
- Hispanic origin (detail)
- Mexican 2% Puerto Rican 2% Cuban 2%
- Common ancestry
- Romanian 3% Italian 2% Lithuanian 2%
- Foreign-born
- 10% · Canada, Jamaica, Vietnam
- Languages at home
- 88% English-only · Spanish 7% French/Haitian/Cajun 3% Vietnamese 1%
Political lean MEDSL · St. Lucie
- 2024 margin
- Lean R (+9.1) · D 45.1% · R 54.2%
- 2008→2024 swing
- -21.2pp toward R · 2008: 12.1pp · 2024: -9.1pp
- All cycles
- 2024: R+9.1 2020: R+1.6 2016: R+2.5 2012: D+7.9 2008: D+12.1
Not yet ingested
- Civics
- —
Market trends
- HPI YoY
- ▼ -106.06%
- Current HPI
- 343.1376
- Rent YoY
- —
- Metro
- Port St. Lucie, FL
- State GDP YoY
- ▲ 3.28%
- F500 in state
- 36
Industry mix (Fortune 500 HQ in FL)
| Industry | F500 HQs | Revenue |
|---|---|---|
| Industrial Technology | 2 | $29B |
|
||
| Insurance | 2 | $17B |
|
||
| Retail | 1 | $60B |
|
||
| Technology Distribution | 1 | $58B |
|
||
| Homebuilding | 1 | $35B |
|
||
| Technology Manufacturing | 1 | $35B |
|
||
Price history
+400.0% since first listed36 events — show timeline
- 2026-05-21 Relisted — Beaches MLS
- 2026-04-30 Listing Removed — Beaches MLS
- 2025-11-21 Price Changed $250,000 Beaches MLS
- 2025-05-01 Listed $269,000 Beaches MLS
- 2025-01-15 Sold (Public Records) $215,000 Public Records
- 2025-01-14 Sold (MLS) $215,000 Beaches MLS
- 2025-01-09 Pending — Beaches MLS
- 2024-12-05 Relisted — Beaches MLS
- 2024-12-05 Listing Removed — Beaches MLS
- 2024-11-25 Relisted — Beaches MLS
- 2024-10-25 Contingent — Beaches MLS
- 2024-10-18 Relisted — Beaches MLS
- 2024-10-07 Contingent — Beaches MLS
- 2024-09-30 Listed $235,000 Beaches MLS
- 2024-09-28 Listing Removed — Beaches MLS
- 2024-08-19 Price Changed $254,900 Beaches MLS
- 2024-06-19 Listed $259,900 Beaches MLS
- 2020-01-17 Sold (Public Records) $171,500 Public Records
- 2020-01-16 Sold (MLS) $171,500 Beaches MLS
- 2019-12-17 Contingent — Beaches MLS
- 2019-12-06 Price Changed $173,000 Beaches MLS
- 2019-11-07 Price Changed $179,000 Beaches MLS
- 2019-10-08 Listed $185,000 Beaches MLS
- 2018-11-29 Sold (Public Records) $115,000 Public Records
- 2018-10-25 Sold (Public Records) $93,000 Public Records
- 2018-10-15 Sold (MLS) $93,000 Beaches MLS
- 2018-09-27 Pending — Beaches MLS
- 2018-09-26 Sold (Public Records) $75,000 Public Records
- 2018-09-22 Listed $109,000 Beaches MLS
- 2013-09-21 Listing Removed — Beaches MLS
- 2008-03-20 Listed $119,500 Beaches MLS
- 2002-12-02 Sold (Public Records) $75,000 Public Records
- 2002-11-15 Sold (MLS) $75,000 Beaches MLS
- 2002-10-10 Listing Removed — Beaches MLS
- 2002-09-17 Listed $79,900 Beaches MLS
- 1991-01-22 Sold (Public Records) $50,000 Public Records
Property tax history
+21.4%/yrLatest (2025): $4,619 · +73.1% YoY. Source: county tax records.
Cash-flow waterfall
monthlySold comps — $/sqft
last 12 mo · ≤1 miLoading sold comps…