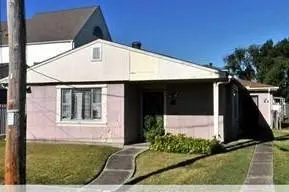
3704 Cherry St · New Orleans, LA
Flood risk 8/10 · Major
- FEMA flood zone
- X (shaded)
- Chance of flooding over 30 yrs
- 0.6%
- Est. flood insurance / yr
- $507 – $1,088
Fire risk 1/10 · Minimal
- Est. fire insurance / yr
- $1,269 – $2,357
Heat risk 10/10 · Severe
- Hot days now (above 108°F)
- 7 days/yr
- Hot days in 30 yrs
- 21 days/yr
Wind risk 10/10 · Severe
- Chance of severe wind over 30 yrs
- 99.0%
Air-quality risk 4/10 · Minor
- Unhealthy air days now
- 4 days/yr
- Unhealthy air days in 30 yrs
- 4 days/yr
Risk factors via First Street. Map © Google.
Why this score? — see what drove the B- grade
The composite is a weighted blend of 9 inputs, each scored 0–100. Each bar is that input's sub-score; the figure is the points it added to the 100-point composite (weight × sub-score).
- Cash flow +26.3/30.0
- ARV discount +14.9/15.0
- DSCR +8.9/10.0
- 1% rule +7.0/10.0
- Livability +4.0/5.0
- Rent growth +2.7/5.0
- Condition / age +2.5/5.0
- Schools +1.6/10.0
- Appreciation +0.0/10.0
$148,000
🖨 Deal sheet 📄 Offer letter ✓ Due diligence
Listing remarks MLS
Best Price in Area. .. .. .$148,000.. .. .Unique property nestled in well established neighborhood. Central unit less than two years old. Some TLC needed. .. .. walking distance to New Orleans Country Club and Longue Vue House & Gardens. Also in area of International School of La. , Xavier University, I-10 and bus transportation. near Orleans/Metairie line. .. .Hurry!!!!! Priced to Sell!!!!!!
Key facts
- Unique property
- 2 parking spots
- Built 1948
Tags
Neighborhood map
What this means for you Summary
Snapshot
- This is a 2-bed/2.0-bath single-family listed at $148k.
Deal economics
- At list price, monthly cash flow is $318 ($4k/yr) — positive.
- The deal already cash-flows at list — no discount required.
- Meets the 1% rule at list price ($2k rent vs $148k).
- Recommended offer: $130k (12.0% below list) — sets the bar for market timing.
- Cap rate 9.4% vs local median 4.4% in New Orleans — top-decile yield for the area; either an underpriced asset or a hidden risk that comps aren't pricing in. Stress-test before assuming the spread holds.
Location & tenants
- Location reads 81/100 on livability (#3 in LA, #1,383 nationally) — a professional / high-income tenant draw. Strengths: amenities A+, commute A+, health & safety A+; Watch: crime C-, employment D.
- Orleans Parish (urban): math 11% / reading 27% proficiency, ranked #69 of 98 in LA (top 70%) — low school quality limits family demand, transient renter base, plan for 1-2y turnover; 68% free/reduced lunch — lower-income household profile, screen leases tightly.
- Market conditions: Rents flat; 279 active listings in the ZIP; 40 comparable units currently listed for rent nearby; rentals at typical pace (median 21d on market — plan ~3-4 weeks tenant-placement turnaround); 710 units permitted in Orleans Parish in 2024 (244 in 5+ unit buildings).
- This rent runs 34% of the median local income ($64k/yr) — at the standard rent-burdened threshold; future hikes will face affordability resistance.
Forward outlook
- Local home prices are declining (-3.0%/yr); year-one equity from $1k of loan paydown is wiped out by about $4k of value loss. Plan a longer hold.
- Orleans County population projected at +61% by 2050 — long-run rental-demand tailwind backs the buy-and-hold thesis.
Negotiation context
- It's been on market 352 days — a 12% lower offer ($130k) is reasonable based on typical stale-listing flexibility.
- 6 sale attempts since 29y ago with the ask held roughly flat each time — persistent listings suggest the price (not the market) is what's stuck; bring a comps-based counter.
- Current owner paid $62k; list at $148k implies a 139% gain — meaningful room to come down on a strong offer.
Risks & watch-outs
- Watch-outs: flood insurance adds $66/mo; built in 1948 — expect roof / HVAC / electrical / plumbing capex.
- Climate carrying-cost: severe flood risk; severe wind risk, 99% chance of damaging wind over 30y; extreme-heat days projected 7→21/yr by 2055 (HVAC capex compounding) — expect insurance premiums to compound above CPI over the hold.
Questions for the listing agent
- It's been on market 352 days. Have you received any prior offers? Is the seller open to a 12% concession, seller financing, or rate buy-down credit?
- Built in 1948 — when were the roof, HVAC, electrical panel, plumbing, and water heater last replaced?
- What's the actual annual flood-insurance premium (NFIP or private), and is the property in a SFHA with mandatory coverage?
- Why hasn't it sold? Are there any deal-killer items the seller is aware of (foundation, flood, title, zoning, code violations)?
- Is there a deadline driving the sale (1031 exchange, divorce, estate, relocation)? That informs how much negotiation room exists.
- What's the average days-on-market for RENTAL listings here right now (not sales)? A rising rental-DOM trend means longer vacancies and softer asking-rent achievability than the comps imply.
- What's the recent tenant-quality profile in this submarket — average credit score on applications, eviction rate, late-payment / NSF rate, and stable-employment percentage? A property-management company in the area should have these aggregated.
- How much new for-sale + rental construction is in the pipeline within 1–3 miles? Heavy new supply typically softens prices + rents 12–24 months out; constrained supply supports both.
Investment metrics
- 1% rule
- 1.20% ✓
- Cap rate
- 9.41%
- Cash-on-cash
- 11.12%
- DSCR
- 1.49
- GRM
- 6.9
CMA / ARV
- ARV (median comp)
- $177,087
- List price
- $148,000
- Delta
- -16.43%
- Verdict
- UNDERPRICED
- Comps
- 20 within 1.0 mi
Show comp detail 12 sales within ~0.75 mi
| Address | Dist | Beds/Ba | Sqft | Sold | Price | $/sf | Match |
|---|---|---|---|---|---|---|---|
| 3424 Camphor St | 0.24mi | 2/2.5 | 1,491 (-6%) | 8mo | $199,000 | $133 | 69 |
| 3418 Camphor St | 0.25mi | 3/2.0 (+1) | 1,528 (-4%) | 10mo | $189,000 | $124 | 68 |
| 8534 Palm St | 0.50mi | 3/2.0 (+1) | 1,600 (+0%) | 9mo | $265,000 | $166 | 63 |
| 3024 Hollygrove St | 0.49mi | 3/2.0 (+1) | 1,533 (-4%) | 5mo | $299,000 | $195 | 62 |
| 8719 Fig St | 0.60mi | 3/2.0 (+1) | 1,540 (-3%) | 1mo | $70,000 | $45 | 61 |
| 2828 Mistletoe St | 0.57mi | 3/2.0 (+1) | 1,670 (+5%) | 2mo | $287,000 | $172 | 58 |
| 4635 Banks St | 0.71mi | 3/2.0 (+1) | 1,638 (+3%) | 1mo | $492,000 | $300 | 56 |
| 2939 Leonidas St | 0.70mi | 3/2.0 (+1) | 1,516 (-5%) | 0mo | $155,500 | $103 | 54 |
| 8501 Palmetto St | 0.54mi | 3/2.5 (+1) | 1,552 (-3%) | 12mo | $267,500 | $172 | 53 |
| 8525 Pritchard Pl | 0.73mi | 3/3.5 (+1) | 1,624 (+2%) | 16mo | $310,000 | $191 | 38 |
| 8521 Edinburgh St | 0.52mi | 3/2.0 (+1) | 1,358 (-15%) | 10mo | $235,000 | $173 | 37 |
| 8308 Forshey St | 0.72mi | 3/2.0 (+1) | 1,440 (-10%) | 12mo | $307,500 | $214 | 35 |
Match score weights: distance 35% · size 25% · config 20% · recency 20%. Top-matched comps best support the ARV.
Projected returns pro-forma
-3.0% appreciation · 0.97% rent growth · sell at horizon
- IRR
- -4.8%
- Equity multiple
- 0.82×
- Total profit
- $-7,254
- Equity at exit
- $22,067
- IRR
- 2.2%
- Equity multiple
- 1.14×
- Total profit
- $5,958
- Equity at exit
- $12,796
Cash invested: $41,440 (down + closing). Projections, not guarantees.
Landlord ↔ Tenant lean methodology
- Overall (STATE)
- 90 Strongly Landlord-Friendly
- State Louisiana
- 90 Strongly Landlord-Friendly · R+12
- County
- — inherits STATE
- City
- — inherits STATE
ZIP-level market 70118
- Rents YoY
- 1.0%
- Active inventory
- 279
- Price-to-rent
- 6.9×
Monthly cashflow live
- Estimated rent
- $1,781 high interval (Pro) →
- Mortgage (P&I)
- −$776
- Tax est. 1.5%
- −$185 /mo · $2,220/yr
- Insurance
- −$62
- Flood insurance flood zone
- −$66 /mo · $798/yr
- HOA
- −$0
- Vacancy / Maint / Mgmt
- −$374
- Net cashflow
- $318
Break-even live
UW: 25.0% down · 7.5% · 30yr · 1.5% tax · 5.0% vac · 8.0% maint · 8.0% mgmt
Financing live
Cash to close
- Down payment
- $37,000
- Closing costs
- $4,440
- Reserves months
- —
- Total cash needed
- —
Loan-product check · same deal, 3 products live
Conventional
25% down · 7.5% · 30yr
- Down + closing
- —
- Monthly P&I
- —
- Monthly cashflow
- —
- DSCR
- —
- Eligible?
- —
Personal DTI + credit; lowest rate.
DSCR
20% down · 8.5% · 30yr
- Down + closing
- —
- Monthly P&I
- —
- Monthly cashflow
- —
- DSCR
- —
- Eligible?
- —
No personal income docs; deal must DSCR.
Hard money
10% down · 12.0% · 12mo
- Down + closing
- —
- Monthly P&I
- —
- Monthly cashflow
- —
- DSCR
- —
- Eligible?
- —
Short-term bridge; refi at stabilization.
Rent comps 40 comps
| Address | Beds | Baths | Sqft | Rent | $/sqft | DOM | Units | Dist |
|---|---|---|---|---|---|---|---|---|
| 9528 Stroelitz St New Orleans, LA | 3.0 | 2.0 | 1174 | $2,100 | $1.79 | 11d | 1 | 0.18mi |
| 4211 Hamilton St Unit NA New Orleans, LA | 2.0 | 1.0 | 1400 | $1,100 | $0.79 | 11d | 1 | 0.34mi |
| 4211 Hamilton St New Orleans, LA | 2.0 | 1.0 | 1400 | $1,100 | $0.79 | 14d | 1 | 0.34mi |
| 8815 Palm St New Orleans, LA | 3.0 | 2.0 | 1195 | $2,100 | $1.76 | 23d | 1 | 0.35mi |
| 9438 Forshey St New Orleans, LA | 3.0 | 2.0 | 1274 | $2,000 | $1.57 | 23d | 1 | 0.36mi |
| 8816 Olive St Unit A-B New Orleans, LA | 3.0 | 2.0 | 1200 | $1,800 | $1.50 | 16d | 1 | 0.41mi |
| 8816 Olive St New Orleans, LA | 3.0 | 2.0 | 1200 | $1,800 | $1.50 | 23d | 1 | 0.41mi |
| 109 Avenue E Metairie, LA | 3.0 | 3.5 | 2068 | $3,000 | $1.45 | 44d | 1 | 0.44mi |
| 119 Avenue E Metairie, LA | 2.0 | 1.0 | 1500 | $1,800 | $1.20 | 44d | 1 | 0.45mi |
| 8929 Colapissa St New Orleans, LA | 3.0 | 1.0 | 1300 | $1,400 | $1.08 | 23d | 1 | 0.50mi |
| 9107 Fig St New Orleans, LA | 3.0 | 3.0 | 1230 | $2,000 | $1.63 | 3d | 1 | 0.52mi |
| 8502 Edinburgh St New Orleans, LA | 3.0 | 2.0 | 1456 | $1,800 | $1.24 | 3d | 1 | 0.57mi |
| 115 Grenadine St Unit 3 Metairie, LA | 1.0 | 1.0 | 1050 | $1,500 | $1.43 | 14d | 1 | 0.66mi |
| 321 S St Patrick St Unit C New Orleans, LA | 2.0 | 1.0 | 1200 | $1,450 | $1.21 | 23d | 1 | 0.69mi |
| 321 S St Patrick St Unit C New Orleans, LA | 2.0 | 1.0 | 1200 | $1,500 | $1.25 | 11d | 1 | 0.69mi |
| 9309 Belfast St Rm A New Orleans, LA | 1.0 | 1.0 | 1220 | $1,200 | $0.98 | 23d | 1 | 0.71mi |
| 419 S Murat St New Orleans, LA | 2.0 | 2.0 | 1200 | $1,850 | $1.54 | 21d | 1 | 0.72mi |
| 4506 Banks St New Orleans, LA | 2.0 | 2.0 | 1350 | $2,000 | $1.48 | 23d | 1 | 0.74mi |
| 337 S Murat St Unit 4501 New Orleans, LA | 3.0 | 2.0 | 1150 | $2,000 | $1.74 | 23d | 1 | 0.77mi |
| 9129 Nelson St New Orleans, LA | 2.0 | 1.5 | 1434 | $1,900 | $1.32 | 23d | 1 | 0.85mi |
| 8329 Pritchard Pl Unit B New Orleans, LA | 1.0 | 1.5 | 1500 | $1,600 | $1.07 | 11d | 1 | 0.85mi |
| 310 Hector Ave Metairie, LA | 2.0 | 1.0 | 1050 | $1,750 | $1.67 | 43d | 1 | 0.86mi |
| 8812 Apple St New Orleans, LA | 3.0 | 2.0 | 1085 | $1,650 | $1.52 | 16d | 1 | 0.87mi |
| 9122 Nelson St New Orleans, LA | 2.0 | 2.0 | 1100 | $1,550 | $1.41 | 23d | 1 | 0.87mi |
| 8405 Apricot St New Orleans, LA | 3.0 | 2.0 | 1058 | $1,795 | $1.70 | 2d | 1 | 0.87mi |
| 8405 Apricot St New Orleans, LA | 3.0 | 2.0 | 1058 | $1,795 | $1.70 | 3d | 1 | 0.87mi |
| 2527 Eagle St New Orleans, LA | 3.0 | 2.0 | 1571 | $2,200 | $1.40 | 23d | 1 | 0.89mi |
| 9215 S Claiborne Ave New Orleans, LA | 2.0 | 2.0 | 1100 | $2,000 | $1.82 | 11d | 1 | 0.91mi |
| 335 Virginia St New Orleans, LA | 2.0 | 1.0 | 1200 | $1,650 | $1.38 | 14d | 1 | 0.95mi |
| 2616 Cambronne St Unit 2618 New Orleans, LA | 3.0 | 1.0 | 1200 | $1,475 | $1.23 | 23d | 1 | 0.97mi |
| 647 S Pierce St New Orleans, LA | 3.0 | 2.0 | 1550 | $3,175 | $2.05 | 14d | 1 | 1.01mi |
| 613 S Pierce St New Orleans, LA | 3.0 | 1.0 | 1200 | $1,500 | $1.25 | 17d | 1 | 1.03mi |
| 615 S Pierce St New Orleans, LA | 3.0 | 1.0 | 1200 | $1,500 | $1.25 | 17d | 1 | 1.03mi |
| 8537 S Claiborne Ave New Orleans, LA | 2.0 | 1.0 | 1450 | $1,400 | $0.97 | 3d | 1 | 1.03mi |
| 4020 Baudin St New Orleans, LA | 3.0 | 2.0 | 1100 | $1,550 | $1.41 | 3d | 1 | 1.03mi |
| 4044 Banks St New Orleans, LA | 2.0 | 2.0 | 1053 | $1,600 | $1.52 | 21d | 1 | 1.04mi |
| 4624 Conti St New Orleans, LA | 2.0 | 1.0 | 1200 | $1,300 | $1.08 | 23d | 1 | 1.06mi |
| 4600 S Carrollton Ave Unit 1B New Orleans, LA | 2.0 | 2.0 | 1072 | $1,500 | $1.40 | 23d | 1 | 1.08mi |
| 2 Azalea Ct Metairie, LA | 2.0 | 1.0 | 1100 | $1,650 | $1.50 | 43d | 1 | 1.09mi |
| 2305 Joliet St New Orleans, LA | 3.0 | 2.0 | 1451 | $2,500 | $1.72 | 43d | 1 | 1.15mi |
Listing history 8 events
-
2025-12-02status Active 403-char remark
Show marketing remark (403 chars)
Best Price in Area. .. .. .$148,000.. .. .Unique property nestled in well established neighborhood. Central unit less than two years old. Some TLC needed. .. .. walking distance to New Orleans Country Club and Longue Vue House & Gardens. Also in area of International School of La. , Xavier University, I-10 and bus transportation. near Orleans/Metairie line. .. .Hurry!!!!! Priced to Sell!!!!!!
-
2025-11-28historical 403-char remark
Show marketing remark (403 chars)
Best Price in Area. .. .. .$148,000.. .. .Unique property nestled in well established neighborhood. Central unit less than two years old. Some TLC needed. .. .. walking distance to New Orleans Country Club and Longue Vue House & Gardens. Also in area of International School of La. , Xavier University, I-10 and bus transportation. near Orleans/Metairie line. .. .Hurry!!!!! Priced to Sell!!!!!!
-
2025-05-27$148,000 Active 389-char remark
Show marketing remark (403 chars)
Best Price in Area. .. .. .$148,000.. .. .Unique property nestled in well established neighborhood. Central unit less than two years old. Some TLC needed. .. .. walking distance to New Orleans Country Club and Longue Vue House & Gardens. Also in area of International School of La. , Xavier University, I-10 and bus transportation. near Orleans/Metairie line. .. .Hurry!!!!! Priced to Sell!!!!!!
-
2025-05-27$148,000 Active 403-char remark
Show marketing remark (403 chars)
Best Price in Area. .. .. .$148,000.. .. .Unique property nestled in well established neighborhood. Central unit less than two years old. Some TLC needed. .. .. walking distance to New Orleans Country Club and Longue Vue House & Gardens. Also in area of International School of La. , Xavier University, I-10 and bus transportation. near Orleans/Metairie line. .. .Hurry!!!!! Priced to Sell!!!!!!
-
2023-12-04$174,000
-
2023-05-31$195,000
-
1997-11-18soldstatus $62,000
-
1997-04-15$67,000
ⓘ Source: listings_history table (triggers on properties + properties_extension) + one-shot
backfill from property_details.listing_events for pre-trigger history.
Climate risk First Street
- Flood 8/10 Severe FEMA zone X (shaded) · 60% chance over 30 yrs
- Wildfire 1/10 Low
- Heat 10/10 Extreme 7 d/yr ≥108°F today · 21 d/yr by 30 yrs out
- Wind 10/10 Extreme 99% chance of damaging wind over 30 yrs
- Air quality 4/10 Moderate 4 unhealthy d/yr today · 4 by 30 yrs out
Nearby sold comps map
Loading sold comps map…
Walkable amenities ~0.75 mi
Loading nearby amenities…
Taxation est. · year 1
- Rental income
- $21,369
- − Mortgage interest
- −$8,290
- − Property taxes
- −$2,220
- − Insurance
- −$1,538
- − Repairs & maintenance
- −$1,710
- − Management
- −$1,710
- − Depreciation
- −$4,305
- Taxable income
- $1,597
- Est. tax owed @ 24.0%
- −$383
- After-tax cash flow
- $3,428/yr
For passive investors: Depreciation is non-cash, so a rental often shows a tax loss while cash-flowing — sheltering income. Rental losses are passive: they offset passive income freely, and up to $25,000/yr can offset ordinary (W-2) income if you actively participate and your MAGI is under $100k (phasing out to $0 by $150k); unused losses carry forward. On sale, claimed depreciation is recaptured at up to 25%, and gains may owe capital-gains tax (a 1031 exchange can defer both). Figures are a year-1 estimate at your 24.0% rate — not tax advice; consult a CPA.
Schools (NCES district)
- District
- Orleans Parish
- NCES district ID
- 2201170
- Math proficiency
- 11% ▼ -52.00%
- Reading proficiency
- 27% ▼ -46.00%
- Median HH income
- $37,011
- Composite
- 15.78/100
- National rank
- #9271
- State rank
- #69 of 98 in LA
Livability — New Orleans
- Score
- 81/100
- State rank
- #3
- US rank
- #1383
Category grades
Schools grade is shown separately in the Schools card above.
Census & demographics
- Census place
- New Orleans, LA
- County
- Orleans Parish · 338,817 people
- City population
- 338,817
- Metro
- New Orleans-Metairie, LA
- Population (ZIP)
- 36,072
- Household income
- $63,750
- Rent vs Own
- Severe rent burden
- 2237.0
Population outlook (Orleans County) Hauer SSP2
- Today (2025)
- 513,025 people
- By 2030
- 575,781 · +12.2%
- By 2040
- 700,174 · +36.5%
- By 2050
- 826,541 · +61.1%
- By 2075
- 1,123,374 · +119.0%
- By 2100
- 1,355,609 · +164.2%
Race, ethnicity, and origin ACS 2023
- Neighborhood character
- Diverse neighborhood (Simpson 0.65)
- Race & ethnicity
- White 47% Black 34% Hispanic / Latino 11% Two or more races 11% Asian 4%
- Hispanic origin (detail)
- Mexican 2%
- Common ancestry
- Lithuanian 8% Italian 2% Romanian 2%
- Foreign-born
- 9% · Canada, China
- Languages at home
- 86% English-only · Spanish 7% French/Haitian/Cajun 2% Other Indo-European 2%
Political lean MEDSL · Orleans
- 2024 margin
- Solid D (+67.0) · D 82.2% · R 15.2% · Other 2.7%
- 2008→2024 swing
- +6.7pp toward D · 2008: 60.3pp · 2024: 67.0pp
- All cycles
- 2024: D+67.0 2020: D+68.2 2016: D+66.2 2012: D+62.5 2008: D+60.3
Not yet ingested
- Civics
- —
Market trends
- HPI YoY
- ▼ -210.46%
- Current HPI
- 282.9629
- Rent YoY
- ▲ 0.97%
- Metro
- New Orleans-Metairie, LA
- State GDP YoY
- ▲ 3.29%
- F500 in state
- 10
Industry mix (Fortune 500 HQ in LA)
| Industry | F500 HQs | Revenue |
|---|---|---|
| Telecommunications | 2 | $23B |
|
||
| Utilities | 1 | $12B |
|
||
| Wholesale / Distribution | 1 | $5B |
|
||
| Advertising | 1 | $2B |
|
||
Price history
+120.9% since first listed8 events — show timeline
- 2025-12-02 Relisted — GSREIN
- 2025-11-28 Listing Removed — GSREIN
- 2025-05-27 Listed $148,000 GSREIN
- 2025-05-27 Listed $148,000 AcadianaMLS
- 2023-12-04 Listed $174,000 AcadianaMLS
- 2023-05-31 Listed $195,000 AcadianaMLS
- 1997-11-18 Sold (Public Records) $62,000 Public Records
- 1997-04-15 Listed $67,000 AcadianaMLS
Property tax history
+7.1%/yrLatest (2026): $98 · +0.0% YoY. Source: county tax records.
Cash-flow waterfall
monthlySold comps — $/sqft
last 12 mo · ≤1 miLoading sold comps…