79 Jury Dr #2 · Magnolia, DE
Flood risk No data
- FEMA flood zone
- —
- Chance of flooding over 30 yrs
- —
- Est. flood insurance / yr
- —
Fire risk No data
- Est. fire insurance / yr
- —
Heat risk No data
- Hot days now (above threshold)
- —
- Hot days in 30 yrs
- —
Wind risk No data
- Chance of severe wind over 30 yrs
- —
Air-quality risk No data
- Unhealthy air days now
- —
- Unhealthy air days in 30 yrs
- —
Risk factors via First Street. Map © Google.
Why this score? — see what drove the B- grade
The composite is a weighted blend of 9 inputs, each scored 0–100. Each bar is that input's sub-score; the figure is the points it added to the 100-point composite (weight × sub-score).
- Cash flow +30.0/30.0
- 1% rule +10.0/10.0
- DSCR +10.0/10.0
- ARV discount +7.5/15.0
- Schools +3.3/10.0
- Livability +3.2/5.0
- Rent growth +2.5/5.0
- Condition / age +2.5/5.0
- Appreciation +0.0/10.0
$90,000
🖨 Deal sheet 📄 Offer letter ✓ Due diligence
Listing remarks
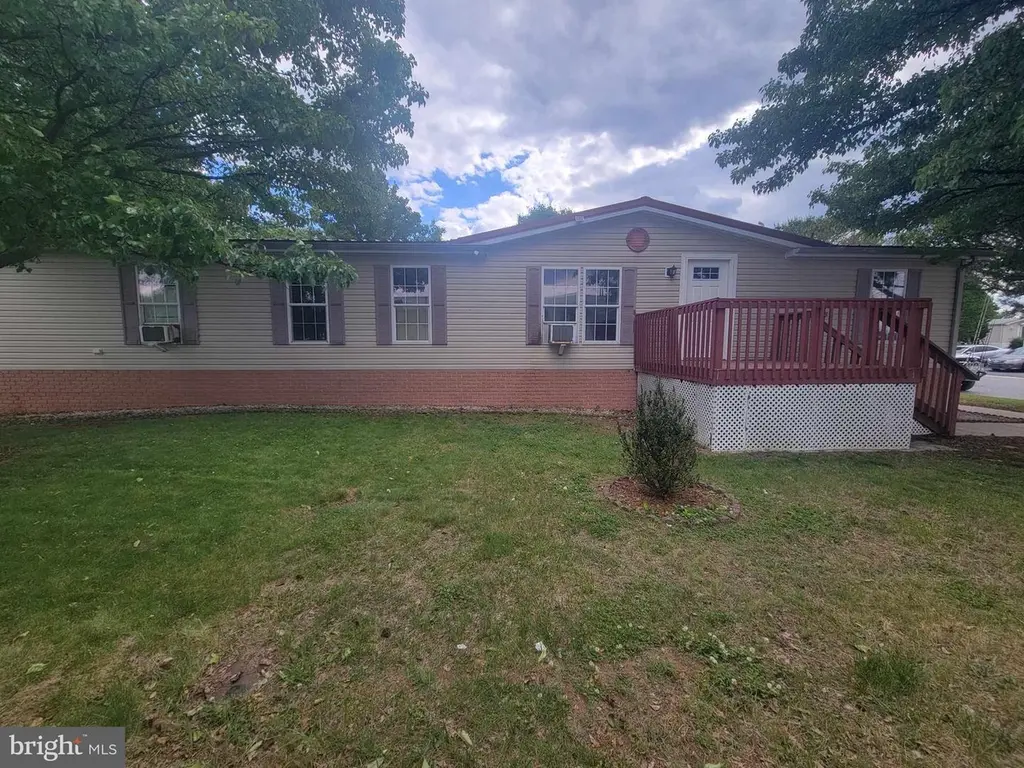
Welcome home to this spacious 4-bedroom, 2 full bath property offering plenty of room to spread out and enjoy! The large kitchen provides ample cabinet and counter space, making it perfect for everyday living and entertaining alike. Step outside onto the deck and take in peaceful views of the pond, creating the perfect spot for morning coffee or relaxing evenings. The property also features a shed for additional storage and outdoor essentials. With its functional layout, scenic setting, and generous space inside and out, this home is full of opportunity to make it your own. Land lease amount listed may not be the current amount, please confirm with Barkers Landing,
Key facts
- Views of the pond
- Large kitchen
- Deck
Tags
Property features AI
Finance
- Financial info: Land lease in place with approximately 99 years remaining; Land lease payment approximately $485.93 annually; Annual ground rent reported
Exterior
- Parking: Driveway parking for 4 vehicles (total 4 garage/parking spaces)
- Utilities: Public water; Public sewer; Electric service for heat, cooling, and hot water
- Home design: Manufactured home; Vinyl siding
- Construction: Crawl space foundation
- Exterior features: Ground rent exists (paid annually); Above-grade and below-grade structures noted
Interior
- Bedrooms: Four bedrooms on the main level
- Bathrooms: Two full bathrooms (both on the main level)
- Heating & cooling: 90% efficient forced-air heating (electric); Central air conditioning (electric); Electric hot water
- Interior features: No basement; Two or more access exits
Neighborhood map
What this means for you Summary
Snapshot
- This is a 4-bed/2.0-bath manufactured listed at $90k.
Deal economics
- At list price, monthly cash flow is $839 ($10k/yr) — positive.
- The deal already cash-flows at list — no discount required.
- Meets the 1% rule at list price ($2k rent vs $90k).
- Recommended offer: $89k (1.5% below list) — sets the bar for market timing.
- Cap rate 17.5% vs local median 2.3% in Magnolia — top-decile yield for the area; either an underpriced asset or a hidden risk that comps aren't pricing in. Stress-test before assuming the spread holds.
Location & tenants
- Location reads 64/100 on livability (#51 in DE) — a middle-class / working-renter tenant base. Strengths: cost of living A+, employment A-, housing B+; Watch: schools F, crime F, amenities F.
- Caesar Rodney School District (suburban): math 26% / reading 49% proficiency, ranked #9 of 26 in DE (top 35%) — families likely to look elsewhere, expect single-tenant / working-renter base with shorter leases.
- Market conditions: 125 active listings in the ZIP; 1 comparable units currently listed for rent nearby; 1,201 units permitted in Kent County in 2024 (116 in 5+ unit buildings).
Forward outlook
- Local home prices are declining (-3.0%/yr); year-one equity from $622 of loan paydown is wiped out by about $3k of value loss. Plan a longer hold.
- Kent County population projected at +22% by 2050 — long-run rental-demand tailwind backs the buy-and-hold thesis.
- At projected returns (-3.0% appreciation + 3.0% rent growth), your $25k cash investment doubles in ~3 years — after that, you're playing with house money.
Negotiation context
- It's been on market 20 days — a 2% lower offer ($89k) is reasonable based on typical stale-listing flexibility.
- 2 sale attempts since 8y ago; this cycle's ask has dropped $10k (10%) from the opening price — seller is motivated, your offer sets the floor, not the list.
Questions for the listing agent
- Is there a deadline driving the sale (1031 exchange, divorce, estate, relocation)? That informs how much negotiation room exists.
- Schools are F-rated, which usually means shorter tenancies and higher turnover. Who's the typical renter profile here, and what's been the actual vacancy rate?
- Crime grade is F in this area — have there been break-ins, vandalism, or insurance claims at this property in the last 3 years? What carrier currently insures it and at what premium?
- What's the average days-on-market for RENTAL listings here right now (not sales)? A rising rental-DOM trend means longer vacancies and softer asking-rent achievability than the comps imply.
- What's the recent tenant-quality profile in this submarket — average credit score on applications, eviction rate, late-payment / NSF rate, and stable-employment percentage? A property-management company in the area should have these aggregated.
- How much new for-sale + rental construction is in the pipeline within 1–3 miles? Heavy new supply typically softens prices + rents 12–24 months out; constrained supply supports both.
Investment metrics
- 1% rule
- 2.05% ✓
- Cap rate
- 17.48%
- Cash-on-cash
- 39.94%
- DSCR
- 2.78
- GRM
- 4.1
CMA / ARV
No comps found within radius.
Projected returns pro-forma
-3.0% appreciation · 3.0% rent growth · sell at horizon
- IRR
- 36.3%
- Equity multiple
- 2.54×
- Total profit
- $38,864
- Equity at exit
- $13,419
- IRR
- 43.0%
- Equity multiple
- 5.08×
- Total profit
- $102,742
- Equity at exit
- $7,782
Cash invested: $25,200 (down + closing). Projections, not guarantees.
Landlord ↔ Tenant lean methodology
- Overall (STATE)
- 70 Landlord-Friendly
- State Delaware
- 70 Landlord-Friendly · D+7
- County
- — inherits STATE
- City
- — inherits STATE
ZIP-level market 19962
- Home prices YoY
- -29.4%
- Active inventory
- 125
- Price-to-rent
- 4.1×
Monthly cashflow live
- Estimated rent
- $1,849 medium interval (Pro) →
- Mortgage (P&I)
- −$472
- Tax est. 1.5%
- −$112 /mo · $1,350/yr
- Insurance
- −$38
- HOA
- −$0
- Vacancy / Maint / Mgmt
- −$388
- Net cashflow
- $839
Break-even live
UW: 25.0% down · 7.5% · 30yr · 1.5% tax · 5.0% vac · 8.0% maint · 8.0% mgmt
Financing live
Cash to close
- Down payment
- $22,500
- Closing costs
- $2,700
- Reserves months
- —
- Total cash needed
- —
Loan-product check · same deal, 3 products live
Conventional
25% down · 7.5% · 30yr
- Down + closing
- —
- Monthly P&I
- —
- Monthly cashflow
- —
- DSCR
- —
- Eligible?
- —
Personal DTI + credit; lowest rate.
DSCR
20% down · 8.5% · 30yr
- Down + closing
- —
- Monthly P&I
- —
- Monthly cashflow
- —
- DSCR
- —
- Eligible?
- —
No personal income docs; deal must DSCR.
Hard money
10% down · 12.0% · 12mo
- Down + closing
- —
- Monthly P&I
- —
- Monthly cashflow
- —
- DSCR
- —
- Eligible?
- —
Short-term bridge; refi at stabilization.
Rent comps 1 comps
| Address | Beds | Baths | Sqft | Rent | $/sqft | DOM | Units | Dist |
|---|---|---|---|---|---|---|---|---|
| 2 Willow Dr Frederica, DE | 3.0–4.0 | 2.0 | 1312 | $1,849 | $1.41 | 43d | 1 | 0.26mi |
Listing history 16 events
-
2026-06-19days on market $90,000 Active 20 DOM
-
2026-06-18days on market $90,000 Active 19 DOM
-
2026-06-17days on market $90,000 Active 18 DOM
-
2026-06-17price $90,000 Active 17 DOM
-
2026-06-16days on market $100,000 Active 17 DOM
-
2026-06-15days on market $100,000 Active 16 DOM
-
2026-06-14days on market $100,000 Active 14 DOM
-
2026-06-13days on market $100,000 Active 13 DOM
-
2026-06-10days on market $100,000 Active 11 DOM
-
2026-06-09days on market $100,000 Active 10 DOM
-
2026-06-08days on market $100,000 Active 9 DOM
-
2026-06-07days on market $100,000 Active 8 DOM
-
2026-06-02days on market $100,000 Active 3 DOM
-
2026-06-01days on market $100,000 Active 2 DOM
-
2026-05-30remarks 673-char remark
-
2026-05-30$100,000 Active 1 DOM
ⓘ Source: listings_history table (triggers on properties + properties_extension) + one-shot
backfill from property_details.listing_events for pre-trigger history.
Nearby sold comps map
Loading sold comps map…
Walkable amenities ~0.75 mi
Loading nearby amenities…
Taxation est. · year 1
- Rental income
- $22,188
- − Mortgage interest
- −$5,041
- − Property taxes
- −$1,350
- − Insurance
- −$450
- − Repairs & maintenance
- −$1,775
- − Management
- −$1,775
- − Depreciation
- −$2,618
- Taxable income
- $9,178
- Est. tax owed @ 24.0%
- −$2,203
- After-tax cash flow
- $7,862/yr
For passive investors: Depreciation is non-cash, so a rental often shows a tax loss while cash-flowing — sheltering income. Rental losses are passive: they offset passive income freely, and up to $25,000/yr can offset ordinary (W-2) income if you actively participate and your MAGI is under $100k (phasing out to $0 by $150k); unused losses carry forward. On sale, claimed depreciation is recaptured at up to 25%, and gains may owe capital-gains tax (a 1031 exchange can defer both). Figures are a year-1 estimate at your 24.0% rate — not tax advice; consult a CPA.
Schools (NCES district)
- District
- Caesar Rodney School District
- NCES district ID
- 1000180
- Math proficiency
- 26% ▼ -21.00%
- Reading proficiency
- 49% ▼ -14.00%
- Median HH income
- $61,187
- Composite
- 33.4/100
- National rank
- #5475
- State rank
- #9 of 26 in DE
Livability — Magnolia
- Score
- 64/100
- State rank
- #51
- US rank
- #13984
Category grades
Schools grade is shown separately in the Schools card above.
Census & demographics
- Population (ZIP)
- 12,618
Population outlook (Kent County) Hauer SSP2
- Today (2025)
- 194,477 people
- By 2030
- 204,351 · +5.1%
- By 2040
- 222,135 · +14.2%
- By 2050
- 236,483 · +21.6%
- By 2075
- 266,327 · +36.9%
- By 2100
- 275,335 · +41.6%
Race, ethnicity, and origin ACS 2023
- Neighborhood character
- Diverse neighborhood (Simpson 0.61)
- Race & ethnicity
- White 58% Black 23% Two or more races 10% Hispanic / Latino 6% Asian 4% Native American 2%
- Hispanic origin (detail)
- Mexican 1% Puerto Rican 3%
- Common ancestry
- Swiss 4% Italian 3% Iranian 2%
- Foreign-born
- 8% · Canada
- Languages at home
- 91% English-only · Spanish 4% Other Indo-European 2% Tagalog/Filipino 2%
Political lean MEDSL · Kent
- 2024 margin
- Toss-up / Even · D 50.2% · R 48.2% · Other 1.7%
- 2008→2024 swing
- -7.8pp toward R · 2008: 9.8pp · 2024: 2.0pp
- All cycles
- 2024: D+2.0 2020: D+4.1 2016: R+4.9 2012: D+4.9 2008: D+9.8
Not yet ingested
- Civics
- —
Market trends
- HPI YoY
- ▼ -77.63%
- Current HPI
- 186.7318
- Rent YoY
- —
- Metro
- —
- State GDP YoY
- —
- F500 in state
- 0
Price history
+43.1% since first listed4 events — show timeline
- 2026-05-30 Listed $100,000 BRIGHT MLS
- 2018-05-05 Listing Removed — BRIGHT MLS
- 2018-03-02 Price Changed $62,500 BRIGHT MLS
- 2018-02-12 Listed $69,900 BRIGHT MLS
Cash-flow waterfall
monthlySold comps — $/sqft
last 12 mo · ≤1 miLoading sold comps…