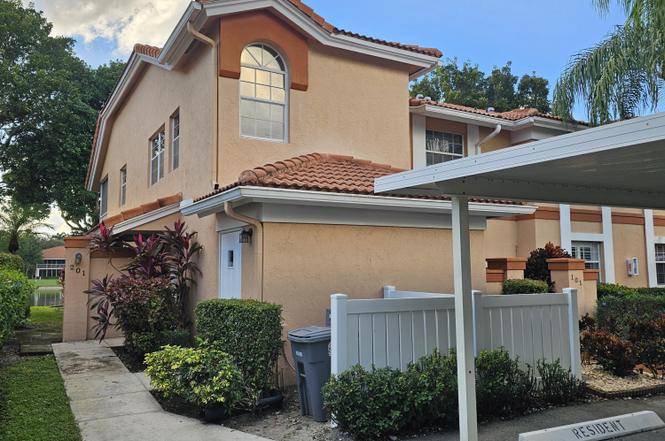
9637 Shadybrook Dr #201 · Golf, FL
Flood risk 1/10 · Minimal
- FEMA flood zone
- X (unshaded)
- Chance of flooding over 30 yrs
- 0.0%
- Est. flood insurance / yr
- $507 – $1,088
Fire risk 1/10 · Minimal
- Est. fire insurance / yr
- $947 – $1,759
Heat risk 9/10 · Severe
- Hot days now (above 106°F)
- 7 days/yr
- Hot days in 30 yrs
- 24 days/yr
Wind risk 10/10 · Severe
- Chance of severe wind over 30 yrs
- 99.0%
Air-quality risk 2/10 · Minimal
- Unhealthy air days now
- 0 days/yr
- Unhealthy air days in 30 yrs
- 2 days/yr
Risk factors via First Street. Map © Google.
Why this score? — see what drove the C grade
The composite is a weighted blend of 9 inputs, each scored 0–100. Each bar is that input's sub-score; the figure is the points it added to the 100-point composite (weight × sub-score).
- Cash flow +18.7/30.0
- 1% rule +10.0/10.0
- ARV discount +7.5/15.0
- DSCR +5.9/10.0
- Appreciation +4.9/10.0
- Schools +4.3/10.0
- Livability +3.2/5.0
- Rent growth +2.8/5.0
- Condition / age +2.5/5.0
$235,000
🖨 Deal sheet 📄 Offer letter ✓ Due diligence
Listing remarks
Lovely 2/2 townhome condo with private elevator in gated Palm Isles community. Convenient first floor entry with main living area second floor. Spacious liv-din with den ideal as office or formal dining. Upgraded kitchen has granite counters, stainless steel appliances and pull-out pantry drawers. Cozy breakfast area. Primary bed offers ensuite bath, dual sinks and large walk-in closet. Florida room under air with sliders ideal in rain or shine. Wide water view. Laundry room with w/ d hook-up. Under stairwell storage and exterior utility. Palm Isles Condo states HOPA. Resort amenities. Multi-million dollar renovated clubhouse reopening later this year.
Key facts
- Gated community
- Private elevator
- Upgraded kitchen
Tags
Property features AI
Finance
- Other: Senior community
- Financial info: Pets allowed with restrictions (breed, number, size)
- HOA & community: Has association; monthly HOA fee; Association amenities include clubhouse, fitness center, game room, pool, sauna, shuffleboard, spa/hot tub, tennis courts, cafe/restaurant, community room, internet included, pickleball courts; HOA fee covers cable TV, insurance, grounds maintenance, security, sewer, trash, water, common areas, and recreation facilities
Exterior
- Parking: Has carport (1 space); 1 covered space; 1 open parking space; Assigned and guest parking
- Security: Gated community with guard; Key card entry
- Utilities: Public water; Public sewer; Sewer and water available
- Home design: Condominium; 2 stories; East-facing
- Construction: Built with CBS and other materials
- Exterior features: Patio; Waterfront property
Interior
- Bedrooms: 2 bedrooms on the main level
- Flooring: Laminate flooring; Other flooring
- Bathrooms: 2 full bathrooms
- Heating & cooling: Has heating (other); Central air conditioning (electric)
- Interior features: Cathedral ceilings; Vaulted ceilings; Walk-in closets; Upstairs living area; Unfurnished
- Laundry & utility: Inside laundry with washer and dryer hookups
Neighborhood map
What this means for you Summary
Snapshot
- This is a 3-bed/2.0-bath condo listed at $235k.
Deal economics
- At list price, monthly cash flow is $230 ($3k/yr) — positive.
- The deal already cash-flows at list — no discount required.
- Meets the 1% rule at list price ($4k rent vs $235k).
- Recommended offer: $207k (12.0% below list) — sets the bar for market timing.
Location & tenants
- Location reads 63/100 on livability (#703 in FL) — a middle-class / working-renter tenant base. Strengths: crime A+, employment A+, housing A+; Watch: amenities F, commute F, cost of living F.
- Palm Beach (suburban): math 46% / reading 53% proficiency, ranked #34 of 73 in FL (top 47%) — families likely to look elsewhere, expect single-tenant / working-renter base with shorter leases.
- Zoned schools: Crystal Lakes Elementary School (math 55% / reading 64%, grade B-, #690 of 2,144 statewide, top 34%, 788 students, 37% FRL); Park Vista Community High School (math 43% / reading 64%, grade C-, #146 of 667 statewide, top 22%, 3,191 students, 28% FRL) — zoned schools average 33% FRL vs 52% district-wide (19 pts lower); this property's tenant base skews higher-income than the district average.
- Market conditions: Rents rising (+1.3%/yr); 479 active listings in the ZIP; 40 comparable units currently listed for rent nearby; rentals at typical pace (median 22d on market — plan ~3-4 weeks tenant-placement turnaround); solid renter incomes; 3,974 units permitted in Palm Beach County in 2024 (1,012 in 5+ unit buildings).
- At $3,524/mo this rent would consume 52% of the median local household income ($81k/yr) (locally 902% of renters already pay >50% of income on rent) — very limited rent-growth headroom before tenants either downsize or default.
Forward outlook
- In year one you build about $1k of equity ($2k loan paydown + $-568 appreciation (-0.2% local appreciation)).
- Palm Beach County population projected at +30% by 2050 — long-run rental-demand tailwind backs the buy-and-hold thesis.
Negotiation context
- It's been on market 191 days — a 12% lower offer ($207k) is reasonable based on typical stale-listing flexibility.
- 6 sale attempts since 10y ago; this cycle's ask has dropped $50k (18%) from the opening price — seller is motivated, your offer sets the floor, not the list.
Risks & watch-outs
- Watch-outs: HOA is 24% of rent.
- Climate carrying-cost: severe wind risk, 99% chance of damaging wind over 30y; extreme-heat days projected 7→24/yr by 2055 (HVAC capex compounding) — expect insurance premiums to compound above CPI over the hold.
Questions for the listing agent
- It's been on market 191 days. Have you received any prior offers? Is the seller open to a 12% concession, seller financing, or rate buy-down credit?
- What does the HOA fee cover, when was the last increase, and are there any pending special assessments or reserve-fund shortfalls?
- Any open or pending special assessments — roof, HVAC, plumbing, elevator, façade? What's the per-unit balance and payoff schedule, and is the seller paying it off at close or rolling it to the buyer?
- Why hasn't it sold? Are there any deal-killer items the seller is aware of (foundation, flood, title, zoning, code violations)?
- Is there a deadline driving the sale (1031 exchange, divorce, estate, relocation)? That informs how much negotiation room exists.
- What's the average days-on-market for RENTAL listings here right now (not sales)? A rising rental-DOM trend means longer vacancies and softer asking-rent achievability than the comps imply.
- What's the recent tenant-quality profile in this submarket — average credit score on applications, eviction rate, late-payment / NSF rate, and stable-employment percentage? A property-management company in the area should have these aggregated.
- How much new apartment / multifamily construction is in the pipeline within 1–3 miles? Heavy new supply (>2% of stock underway) typically softens rents 12–24 months out; light construction supports rent growth.
Investment metrics
- 1% rule
- 1.50% ✓
- Cap rate
- 7.47%
- Cash-on-cash
- 4.20%
- DSCR
- 1.19
- GRM
- 5.6
CMA / ARV
No comps found within radius.
Projected returns pro-forma
-0.24% appreciation · 1.28% rent growth · sell at horizon
- IRR
- -0.1%
- Equity multiple
- 1.00×
- Total profit
- $-238
- Equity at exit
- $65,410
- IRR
- 3.9%
- Equity multiple
- 1.38×
- Total profit
- $25,307
- Equity at exit
- $76,405
Cash invested: $65,800 (down + closing). Projections, not guarantees.
Landlord ↔ Tenant lean methodology
- Overall (STATE)
- 87 Strongly Landlord-Friendly
- State Florida
- 87 Strongly Landlord-Friendly · R+3
- County
- — inherits STATE
- City
- — inherits STATE
ZIP-level market 33437
- Home prices YoY
- -0.1%
- Rents YoY
- 1.3%
- Active inventory
- 479
- Price-to-rent
- 5.6×
Monthly cashflow live
- Estimated rent
- $3,524 high interval (Pro) →
- Mortgage (P&I)
- −$1,232
- Tax from tax record
- −$390 /mo · $4,681/yr
- Insurance
- −$98
- HOA
- −$833
- Vacancy / Maint / Mgmt
- −$740
- Net cashflow
- $230
Break-even live
UW: 25.0% down · 7.5% · 30yr · 1.5% tax · 5.0% vac · 8.0% maint · 8.0% mgmt
Financing live
Cash to close
- Down payment
- $58,750
- Closing costs
- $7,050
- Reserves months
- —
- Total cash needed
- —
Loan-product check · same deal, 3 products live
Conventional
25% down · 7.5% · 30yr
- Down + closing
- —
- Monthly P&I
- —
- Monthly cashflow
- —
- DSCR
- —
- Eligible?
- —
Personal DTI + credit; lowest rate.
DSCR
20% down · 8.5% · 30yr
- Down + closing
- —
- Monthly P&I
- —
- Monthly cashflow
- —
- DSCR
- —
- Eligible?
- —
No personal income docs; deal must DSCR.
Hard money
10% down · 12.0% · 12mo
- Down + closing
- —
- Monthly P&I
- —
- Monthly cashflow
- —
- DSCR
- —
- Eligible?
- —
Short-term bridge; refi at stabilization.
Rent comps 40 comps
| Address | Beds | Baths | Sqft | Rent | $/sqft | DOM | Units | Dist |
|---|---|---|---|---|---|---|---|---|
| 9650 Harbour Lake Cir Boynton Beach, FL | 3.0 | 2.0 | 1937 | $2,975 | $1.54 | 24d | 1 | 0.18mi |
| 7891 Sailing Shores Ter Unit 7891 Boynton Beach, FL | 3.0 | 2.0 | 2011 | $3,000 | $1.49 | 7d | 1 | 0.25mi |
| 7891 Sailing Shores Ter Boynton Beach, FL | 3.0 | 2.0 | 2011 | $3,400 | $1.69 | 16d | 1 | 0.25mi |
| 7192 Summer Tree Dr Boynton Beach, FL | 2.0 | 2.0 | 1722 | $3,000 | $1.74 | 24d | 1 | 0.40mi |
| 7275 Summer Tree Dr Boynton Beach, FL | 2.0 | 2.0 | 1722 | $4,300 | $2.50 | 24d | 1 | 0.51mi |
| 10206 Stonehenge Cir Boynton Beach, FL | 1.0–3.0 | 1.0–2.0 | 1054 | $2,825 | $2.68 | 2d | 13 | 0.55mi |
| 9336 Water Course Way Boynton Beach, FL | 3.0 | 2.0 | 1779 | $3,600 | $2.02 | 24d | 1 | 0.67mi |
| 9336 Water Course Way Boynton Beach, FL | 3.0 | 2.0 | 1779 | $3,600 | $2.02 | 22d | 1 | 0.67mi |
| 7577 Caprio Dr Boynton Beach, FL | 3.0 | 2.0 | 1884 | $3,200 | $1.70 | 3d | 1 | 0.76mi |
| 7577 Caprio Dr Boynton Beach, FL | 3.0 | 2.0 | 1884 | $3,200 | $1.70 | 14d | 1 | 0.76mi |
| 9926 Watermill Cir Unit F Boynton Beach, FL | 3.0 | 2.0 | 1471 | $2,400 | $1.63 | 24d | 1 | 0.84mi |
| 8884 Shoal Creek Ln Boynton Beach, FL | 3.0 | 2.0 | 1936 | $5,000 | $2.58 | 10d | 1 | 0.87mi |
| 8884 Shoal Creek Ln Boynton Beach, FL | 3.0 | 2.0 | 1936 | $4,900 | $2.53 | 24d | 1 | 0.87mi |
| 6165 Country Fair Cir Boynton Beach, FL | 3.0 | 2.5 | 1656 | $3,200 | $1.93 | 24d | 1 | 0.91mi |
| 10390 Utopia Cir E Unit 10390 Boynton Beach, FL | 3.0 | 2.0 | 1845 | $4,200 | $2.28 | 24d | 1 | 0.98mi |
| 10390 Utopia Cir E Unit E Boynton Beach, FL | 3.0 | 2.0 | 1845 | $4,200 | $2.28 | 3d | 1 | 0.98mi |
| 6039 Sunberry Cir Boynton Beach, FL | 4.0 | 2.0 | 2149 | $3,650 | $1.70 | 5d | 1 | 0.98mi |
| 9121 Paragon Way Boynton Beach, FL | 4.0 | 2.0 | 2154 | $4,950 | $2.30 | 24d | 1 | 0.99mi |
| 6365 Lansdowne Cir Boynton Beach, FL | 3.0 | 2.0 | 1769 | $3,200 | $1.81 | 3d | 1 | 1.07mi |
| 7832 Rockford Rd Boynton Beach, FL | 3.0 | 2.0 | 1598 | $3,800 | $2.38 | 22d | 1 | 1.07mi |
| 6396 Park Lake Cir Boynton Beach, FL | 3.0 | 2.5 | 1422 | $2,950 | $2.07 | 15d | 1 | 1.10mi |
| 6731 Southport Dr Boynton Beach, FL | 3.0 | 2.0 | 1727 | $3,600 | $2.08 | 24d | 1 | 1.11mi |
| 7725 Rockford Rd Boynton Beach, FL | 3.0 | 2.5 | 2249 | $10,000 | $4.45 | 3d | 1 | 1.11mi |
| 7933 Venture Center Way Boynton Beach, FL | 1.0–3.0 | 1.0–2.0 | 1120 | $2,921 | $2.61 | 1d | 16 | 1.13mi |
| 9629 El Clair Ranch Rd Boynton Beach, FL | 4.0 | 2.0 | 2231 | $4,800 | $2.15 | 24d | 1 | 1.15mi |
| 6037 Rossmoor Lakes Ct Boynton Beach, FL | 3.0 | 2.0 | 1617 | $4,700 | $2.91 | 24d | 1 | 1.18mi |
| 9284 Laurel Green Dr Boynton Beach, FL | 3.0 | 2.0 | 2302 | $4,200 | $1.82 | 10d | 1 | 1.18mi |
| 9284 Laurel Green Dr Boynton Beach, FL | 3.0 | 2.0 | 2302 | $4,200 | $1.82 | 1d | 1 | 1.18mi |
| 9284 Laurel Green Dr Boynton Beach, FL | 3.0 | 2.0 | 2302 | $4,300 | $1.87 | 22d | 1 | 1.18mi |
| 5895 Autumn Lake Ln Unit A Boynton Beach, FL | 3.0 | 2.0 | 1469 | $2,600 | $1.77 | 24d | 1 | 1.21mi |
| 9654 Sun Pointe Dr Boynton Beach, FL | 4.0 | 2.0 | 2142 | $4,400 | $2.05 | 24d | 1 | 1.22mi |
| 7936 Rockford Rd Boynton Beach, FL | 3.0 | 2.0 | 1871 | $9,000 | $4.81 | 22d | 1 | 1.26mi |
| 9565 El Clair Ranch Rd Boynton Beach, FL | 3.0 | 2.0 | 1867 | $3,500 | $1.87 | 20d | 1 | 1.28mi |
| 9565 El Clair Ranch Rd Boynton Beach, FL | 3.0 | 2.0 | 1867 | $3,500 | $1.87 | 7d | 1 | 1.28mi |
| 7975 Rockford Rd Boynton Beach, FL | 2.0 | 2.0 | 1720 | $3,700 | $2.15 | 24d | 1 | 1.30mi |
| 9215 Sun Pointe Dr Boynton Beach, FL | 4.0 | 2.0 | 2142 | $4,650 | $2.17 | 10d | 1 | 1.30mi |
| 9215 Sun Pointe Dr Boynton Beach, FL | 4.0 | 2.0 | 2142 | $4,650 | $2.17 | 24d | 1 | 1.30mi |
| 6143 Windlass Cir Boynton Beach, FL | 4.0 | 2.5 | 2245 | $4,200 | $1.87 | 18d | 1 | 1.34mi |
| 7821 Dorchester Rd Boynton Beach, FL | 3.0 | 3.0 | 2325 | $11,000 | $4.73 | 24d | 1 | 1.35mi |
| 8082 Aberdeen Dr #102 Boynton Beach, FL | 2.0 | 2.0 | 1619 | $8,500 | $5.25 | 24d | 1 | 1.39mi |
HOA detail condo
- Monthly dues
- $833 · $9,996/yr
- Likely covers
- watersecurity
- Assessments
- None detected in remarks — confirm with the listing agent.
Listing history 34 events
-
2026-06-18days on market $235,000 Active 191 DOM
-
2026-06-17days on market $235,000 Active 190 DOM
-
2026-06-16days on market $235,000 Active 189 DOM
-
2026-06-16price $235,000 Active 188 DOM
-
2026-06-15days on market $240,000 Active 188 DOM
-
2026-06-13days on market $240,000 Active 186 DOM
-
2026-06-09days on market $240,000 Active 182 DOM
-
2026-06-07days on market $240,000 Active 180 DOM
-
2026-06-04days on market $240,000 Active 177 DOM
-
2026-06-03days on market $240,000 Active 176 DOM
-
2026-06-01days on market $240,000 Active 174 DOM
-
2026-05-31days on market $240,000 Active 173 DOM
-
2026-05-19price $240,000
-
2026-05-12price $250,000
-
2026-04-12price $255,000
-
2026-03-15price $262,500
-
2026-02-06price $270,750
-
2025-12-09$285,000 Active
-
2025-12-09historical
-
2025-09-26$285,000 Active
-
2023-04-06historical
-
2023-03-07price $324,900
-
2023-03-03status Active
-
2023-02-24historical Active Under Contract
-
2023-01-18price $329,000
-
2022-12-27price $335,000
-
2022-11-04price $345,900
-
2022-10-15$349,500 Active
-
2017-04-21status Active
-
2017-04-21historical
-
2017-03-12historical Contingent
-
2017-03-02price $215,000
-
2016-10-10price $225,000
-
2016-07-05$234,900 Active
ⓘ Source: listings_history table (triggers on properties + properties_extension) + one-shot
backfill from property_details.listing_events for pre-trigger history.
Tax reassessment forecast FL · Resets to sale price
- Current annual tax
- $4,681 · $390/mo
- Projected year-2 tax
- $4,681 · $390/mo
- Expected delta
- $0/yr ($0/mo · 0.0%)
ⓘ Screening estimate from a state-policy table — verify with the county assessor before closing.
Climate risk First Street
- Flood 1/10 Low FEMA zone X (unshaded) · 0% chance over 30 yrs
- Wildfire 1/10 Low
- Heat 9/10 Extreme 7 d/yr ≥106°F today · 24 d/yr by 30 yrs out
- Wind 10/10 Extreme 99% chance of damaging wind over 30 yrs
- Air quality 2/10 Low 0 unhealthy d/yr today · 2 by 30 yrs out
Nearby sold comps map
Loading sold comps map…
Walkable amenities ~0.75 mi
Loading nearby amenities…
Taxation est. · year 1
- Rental income
- $42,282
- − Mortgage interest
- −$13,164
- − Property taxes
- −$4,681
- − Insurance
- −$1,175
- − Repairs & maintenance
- −$3,383
- − Management
- −$3,383
- − HOA
- −$9,996
- − Depreciation
- −$6,836
- Taxable loss
- −$335
- Est. tax savings @ 24.0%
- +$80
- After-tax cash flow
- $2,843/yr
For passive investors: Depreciation is non-cash, so a rental often shows a tax loss while cash-flowing — sheltering income. Rental losses are passive: they offset passive income freely, and up to $25,000/yr can offset ordinary (W-2) income if you actively participate and your MAGI is under $100k (phasing out to $0 by $150k); unused losses carry forward. On sale, claimed depreciation is recaptured at up to 25%, and gains may owe capital-gains tax (a 1031 exchange can defer both). Figures are a year-1 estimate at your 24.0% rate — not tax advice; consult a CPA.
Schools (NCES district)
- District
- Palm Beach
- NCES district ID
- 1201500
- Math proficiency
- 46% ▼ -16.00%
- Reading proficiency
- 53% ▼ -4.00%
- Median HH income
- $53,943
- Composite
- 42.72/100
- National rank
- #3160
- State rank
- #34 of 73 in FL
Livability — Golf
- Score
- 63/100
- State rank
- #703
- US rank
- #14941
Category grades
Schools grade is shown separately in the Schools card above.
Census & demographics
- County
- Palm Beach County · 1,438,312 people
- Metro
- Miami-Fort Lauderdale-Pompano Beach, FL
- Population (ZIP)
- 37,229
- Household income
- $80,710
- Rent vs Own
- Severe rent burden
- 902.0
Population outlook (Palm Beach County) Hauer SSP2
- Today (2025)
- 1,637,487 people
- By 2030
- 1,743,255 · +6.5%
- By 2040
- 1,948,712 · +19.0%
- By 2050
- 2,132,979 · +30.3%
- By 2075
- 2,530,027 · +54.5%
- By 2100
- 2,706,979 · +65.3%
Race, ethnicity, and origin ACS 2023
- Neighborhood character
- Predominantly White (68%)
- Race & ethnicity
- White 68% Two or more races 13% Hispanic / Latino 12% Black 10% Asian 3%
- Hispanic origin (detail)
- Mexican 1% Puerto Rican 2% Cuban 1% Dominican 1%
- Common ancestry
- Scotch-Irish 8% Romanian 8% Hispanic 6%
- Foreign-born
- 18% · Canada, Jamaica, Vietnam
- Languages at home
- 78% English-only · Spanish 10% French/Haitian/Cajun 6% Other Indo-European 2%
Political lean MEDSL · Palm Beach
- 2024 margin
- Toss-up / Even · D 50.0% · R 49.2%
- 2008→2024 swing
- -22.1pp toward R · 2008: 22.9pp · 2024: 0.8pp
- All cycles
- 2024: D+0.8 2020: D+12.8 2016: D+15.3 2012: D+17.0 2008: D+22.9
Not yet ingested
- Civics
- —
Market trends
- HPI YoY
- ▼ -0.24%
- Current HPI
- 257.5891
- Rent YoY
- ▲ 1.28%
- Metro
- Miami-Fort Lauderdale-Pompano Beach, FL
- State GDP YoY
- ▲ 3.28%
- F500 in state
- 36
Industry mix (Fortune 500 HQ in FL)
| Industry | F500 HQs | Revenue |
|---|---|---|
| Industrial Technology | 2 | $29B |
|
||
| Insurance | 2 | $17B |
|
||
| Retail | 1 | $60B |
|
||
| Technology Distribution | 1 | $58B |
|
||
| Homebuilding | 1 | $35B |
|
||
| Technology Manufacturing | 1 | $35B |
|
||
Price history
+2.2% since first listed22 events — show timeline
- 2026-05-19 Price Changed $240,000 Beaches MLS
- 2026-05-12 Price Changed $250,000 Beaches MLS
- 2026-04-12 Price Changed $255,000 Beaches MLS
- 2026-03-15 Price Changed $262,500 Beaches MLS
- 2026-02-06 Price Changed $270,750 Beaches MLS
- 2025-12-09 Listing Removed — Beaches MLS
- 2025-12-09 Listed $285,000 Beaches MLS
- 2025-09-26 Listed $285,000 Beaches MLS
- 2023-04-06 Listing Removed — MARMLS
- 2023-03-07 Price Changed $324,900 MARMLS
- 2023-03-03 Relisted — MARMLS
- 2023-02-24 Contingent — MARMLS
- 2023-01-18 Price Changed $329,000 MARMLS
- 2022-12-27 Price Changed $335,000 MARMLS
- 2022-11-04 Price Changed $345,900 MARMLS
- 2022-10-15 Listed $349,500 MARMLS
- 2017-04-21 Relisted — Beaches MLS
- 2017-04-21 Listing Removed — Beaches MLS
- 2017-03-12 Contingent — Beaches MLS
- 2017-03-02 Price Changed $215,000 Beaches MLS
- 2016-10-10 Price Changed $225,000 Beaches MLS
- 2016-07-05 Listed $234,900 Beaches MLS
Property tax history
+6.1%/yrLatest (2025): $4,681 · -2.6% YoY. Source: county tax records.
Cash-flow waterfall
monthlySold comps — $/sqft
last 12 mo · ≤1 miLoading sold comps…