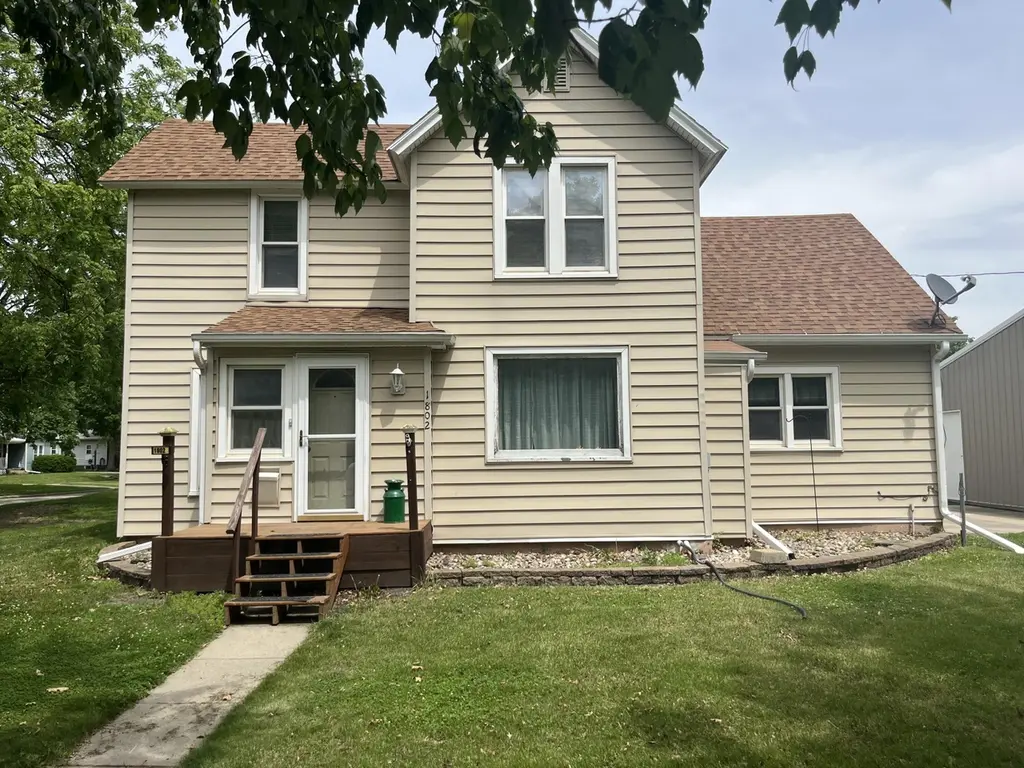
1802 Boone St · Boone, IA
Flood risk 1/10 · Minimal
- FEMA flood zone
- X (unshaded)
- Chance of flooding over 30 yrs
- 0.0%
- Est. flood insurance / yr
- $473 – $860
Fire risk 1/10 · Minimal
- Est. fire insurance / yr
- $902 – $1,676
Heat risk 3/10 · Minor
- Hot days now (above 102°F)
- 7 days/yr
- Hot days in 30 yrs
- 15 days/yr
Wind risk 2/10 · Minimal
- Chance of severe wind over 30 yrs
- —
Air-quality risk 1/10 · Minimal
- Unhealthy air days now
- 0 days/yr
- Unhealthy air days in 30 yrs
- 0 days/yr
Risk factors via First Street. Map © Google.
Why this score? — see what drove the B- grade
The composite is a weighted blend of 9 inputs, each scored 0–100. Each bar is that input's sub-score; the figure is the points it added to the 100-point composite (weight × sub-score).
- Cash flow +25.0/30.0
- ARV discount +15.0/15.0
- DSCR +8.1/10.0
- 1% rule +6.2/10.0
- Schools +5.2/10.0
- Livability +4.0/5.0
- Rent growth +2.5/5.0
- Condition / age +2.5/5.0
- Appreciation +0.0/10.0
$165,500
🖨 Deal sheet 📄 Offer letter ✓ Due diligence
Listing remarks
This lovely 4-Bedroom 1-Bathroom home could be the perfect place to grow for anybody willing to give it the time and care it deserves. With an insulated 3-Car detached garage and a spacious . 25 acre lot, this property leaves lots of options for any buyer! Listing Agent is related to the Seller.
Key facts
- 0.25 acre lot
- 3 garage spots
- Built 1900
Property features AI
Exterior
- Parking: Detached or attached garage with 3 spaces
- Utilities: Public water; Public sewer
- Home design: Single-family residence; Residential zoning
- Construction: Vinyl siding; Brick/mortar and block foundation; Built-in fireplace details (gas)
- Exterior features: Deck; Shed(s)
Interior
- Kitchen: Microwave; Refrigerator; Freezer
- Bedrooms: Master bedroom located downstairs
- Flooring: Carpet
- Bathrooms: 1 full bathroom
- Heating & cooling: Central air conditioning; Forced air heating (natural gas)
- Interior features: Ceiling fans; Master suite on the main floor; Unfinished basement with sump pump; Two gas fireplaces
- Laundry & utility: Washer and dryer (laundry on main level)
Neighborhood map
What this means for you Summary
Snapshot
- This is a 3-bed/1.0-bath single-family listed at $166k.
Deal economics
- At list price, monthly cash flow is $358 ($4k/yr) — positive.
- The deal already cash-flows at list — no discount required.
- Meets the 1% rule at list price ($2k rent vs $166k).
- Recommended offer: $163k (1.5% below list) — sets the bar for market timing.
- Cap rate 8.9% vs local median 3.6% in Boone — top-decile yield for the area; either an underpriced asset or a hidden risk that comps aren't pricing in. Stress-test before assuming the spread holds.
Location & tenants
- Location reads 79/100 on livability (#112 in IA, #2,144 nationally) — a middle-class / working-renter tenant base. Strengths: cost of living A+, housing A+, health & safety A+; Watch: amenities F, commute F.
- Boone Community School District (town): math 57% / reading 66% proficiency, ranked #232 of 289 in IA (top 80%) — acceptable for families but not a draw, mixed tenant base, ~2y average lease.
- Market conditions: 215 active listings in the ZIP; 2 comparable units currently listed for rent nearby; 80 units permitted in Boone County in 2024 (16 in 5+ unit buildings).
Forward outlook
- Local home prices are declining (-3.0%/yr); year-one equity from $1k of loan paydown is wiped out by about $5k of value loss. Plan a longer hold.
Negotiation context
- It's been on market 21 days — a 2% lower offer ($163k) is reasonable based on typical stale-listing flexibility.
Risks & watch-outs
- Watch-outs: built in 1900 — expect roof / HVAC / electrical / plumbing capex.
Questions for the listing agent
- Built in 1900 — when were the roof, HVAC, electrical panel, plumbing, and water heater last replaced?
- Is there a deadline driving the sale (1031 exchange, divorce, estate, relocation)? That informs how much negotiation room exists.
- Schools are B-rated — typically a magnet for longer-tenancy family renters. What's the average tenant stay here, and is there a school-zone premium baked into asking?
- What's the average days-on-market for RENTAL listings here right now (not sales)? A rising rental-DOM trend means longer vacancies and softer asking-rent achievability than the comps imply.
- What's the recent tenant-quality profile in this submarket — average credit score on applications, eviction rate, late-payment / NSF rate, and stable-employment percentage? A property-management company in the area should have these aggregated.
- How much new for-sale + rental construction is in the pipeline within 1–3 miles? Heavy new supply typically softens prices + rents 12–24 months out; constrained supply supports both.
Investment metrics
- 1% rule
- 1.12% ✓
- Cap rate
- 8.89%
- Cash-on-cash
- 9.27%
- DSCR
- 1.41
- GRM
- 7.4
CMA / ARV
- ARV (on-the-fly)
- $201,474
- Comps found
- 12
Show comp detail 12 sales within ~0.75 mi
| Address | Dist | Beds/Ba | Sqft | Sold | Price | $/sf | Match |
|---|---|---|---|---|---|---|---|
| 1116 Linn St | 0.62mi | 3/1.0 | 1,652 (+1%) | 1mo | $99,000 | $60 | 68 |
| 1717 Linn St | 0.38mi | 3/1.5 | 1,552 (-5%) | 6mo | $202,000 | $130 | 66 |
| 427 11th St | 0.58mi | 3/2.0 | 1,680 (+3%) | 2mo | $165,000 | $98 | 64 |
| 1210 Tama St | 0.49mi | 3/1.0 | 1,572 (-4%) | 9mo | $141,000 | $90 | 63 |
| 2004 Benton St | 0.37mi | 3/2.0 | 1,732 (+6%) | 9mo | $253,000 | $146 | 61 |
| 1524 22nd St | 0.64mi | 3/1.5 | 1,576 (-4%) | 6mo | $260,000 | $165 | 57 |
| 1303 Tama St | 0.42mi | 4/2.0 (+1) | 1,728 (+6%) | 7mo | $213,000 | $123 | 57 |
| 816 Carroll St | 0.71mi | 3/1.5 | 1,732 (+6%) | 2mo | $192,000 | $111 | 54 |
| 2003 Linn St | 0.41mi | 3/1.0 | 1,410 (-14%) | 6mo | $122,500 | $87 | 53 |
| 1022 Linn St | 0.68mi | 3/2.0 | 1,545 (-6%) | 5mo | $282,000 | $183 | 50 |
| 515 8th St | 0.75mi | 3/1.0 | 1,464 (-11%) | 2mo | $152,000 | $104 | 46 |
| 209 12th St | 0.66mi | 4/2.0 (+1) | 1,432 (-13%) | 1mo | $225,000 | $157 | 39 |
Match score weights: distance 35% · size 25% · config 20% · recency 20%. Top-matched comps best support the ARV.
Projected returns pro-forma
-3.0% appreciation · 3.0% rent growth · sell at horizon
- IRR
- -2.3%
- Equity multiple
- 0.91×
- Total profit
- $-4,008
- Equity at exit
- $24,677
- IRR
- 7.4%
- Equity multiple
- 1.56×
- Total profit
- $25,906
- Equity at exit
- $14,309
Cash invested: $46,340 (down + closing). Projections, not guarantees.
Landlord ↔ Tenant lean methodology
- Overall (STATE)
- 83 Strongly Landlord-Friendly
- State Iowa
- 83 Strongly Landlord-Friendly · R+6
- County
- — inherits STATE
- City
- — inherits STATE
ZIP-level market 50036
- Home prices YoY
- -27.1%
- Active inventory
- 215
- Price-to-rent
- 7.4×
Monthly cashflow live
- Estimated rent
- $1,861 medium interval (Pro) →
- Mortgage (P&I)
- −$868
- Tax from tax record
- −$175 /mo · $2,102/yr
- Insurance
- −$69
- HOA
- −$0
- Vacancy / Maint / Mgmt
- −$391
- Net cashflow
- $358
Break-even live
UW: 25.0% down · 7.5% · 30yr · 1.5% tax · 5.0% vac · 8.0% maint · 8.0% mgmt
Financing live
Cash to close
- Down payment
- $41,375
- Closing costs
- $4,965
- Reserves months
- —
- Total cash needed
- —
Loan-product check · same deal, 3 products live
Conventional
25% down · 7.5% · 30yr
- Down + closing
- —
- Monthly P&I
- —
- Monthly cashflow
- —
- DSCR
- —
- Eligible?
- —
Personal DTI + credit; lowest rate.
DSCR
20% down · 8.5% · 30yr
- Down + closing
- —
- Monthly P&I
- —
- Monthly cashflow
- —
- DSCR
- —
- Eligible?
- —
No personal income docs; deal must DSCR.
Hard money
10% down · 12.0% · 12mo
- Down + closing
- —
- Monthly P&I
- —
- Monthly cashflow
- —
- DSCR
- —
- Eligible?
- —
Short-term bridge; refi at stabilization.
Rent comps 2 comps
| Address | Beds | Baths | Sqft | Rent | $/sqft | DOM | Units | Dist |
|---|---|---|---|---|---|---|---|---|
| 1428 Story St Boone, IA | 4.0 | 3.0 | 1900 | $2,000 | $1.05 | 43d | 1 | 0.22mi |
| 411 W 9th St Boone, IA | 3.0 | 2.0 | 1275 | $1,100 | $0.86 | 43d | 1 | 1.10mi |
Listing history 17 events
-
2026-06-18price $165,500 Active 21 DOM
-
2026-06-18days on market $173,500 Active 21 DOM
-
2026-06-17days on market $173,500 Active 20 DOM
-
2026-06-16days on market $173,500 Active 19 DOM
-
2026-06-15days on market $173,500 Active 18 DOM
-
2026-06-13days on market $173,500 Active 16 DOM
-
2026-06-12days on market $173,500 Active 15 DOM
-
2026-06-09days on market $173,500 Active 12 DOM
-
2026-06-08days on market $173,500 Active 11 DOM
-
2026-06-07days on market $173,500 Active 10 DOM
-
2026-06-05days on market $173,500 Active 8 DOM
-
2026-06-04days on market $173,500 Active 6 DOM
-
2026-06-02days on market $173,500 Active 5 DOM
-
2026-06-01days on market $173,500 Active 4 DOM
-
2026-05-31days on market $173,500 Active 3 DOM
-
2026-05-31days on market $173,500 Active 2 DOM
-
2026-05-27$173,500 Active
ⓘ Source: listings_history table (triggers on properties + properties_extension) + one-shot
backfill from property_details.listing_events for pre-trigger history.
Tax reassessment forecast IA · Partial reset (capped growth)
- Current annual tax
- $2,102 · $175/mo
- Projected year-2 tax
- $2,350 · $196/mo
- Expected delta
- +$248/yr (+$21/mo · 11.8%)
ⓘ Screening estimate from a state-policy table — verify with the county assessor before closing.
Climate risk First Street
- Flood 1/10 Low FEMA zone X (unshaded) · 0% chance over 30 yrs
- Wildfire 1/10 Low
- Heat 3/10 Moderate 7 d/yr ≥102°F today · 15 d/yr by 30 yrs out
- Wind 2/10 Low
- Air quality 1/10 Low 0 unhealthy d/yr today · 0 by 30 yrs out
Nearby sold comps map
Loading sold comps map…
Walkable amenities ~0.75 mi
Loading nearby amenities…
Taxation est. · year 1
- Rental income
- $22,330
- − Mortgage interest
- −$9,271
- − Property taxes
- −$2,102
- − Insurance
- −$828
- − Repairs & maintenance
- −$1,786
- − Management
- −$1,786
- − Depreciation
- −$4,815
- Taxable income
- $1,742
- Est. tax owed @ 24.0%
- −$418
- After-tax cash flow
- $3,878/yr
For passive investors: Depreciation is non-cash, so a rental often shows a tax loss while cash-flowing — sheltering income. Rental losses are passive: they offset passive income freely, and up to $25,000/yr can offset ordinary (W-2) income if you actively participate and your MAGI is under $100k (phasing out to $0 by $150k); unused losses carry forward. On sale, claimed depreciation is recaptured at up to 25%, and gains may owe capital-gains tax (a 1031 exchange can defer both). Figures are a year-1 estimate at your 24.0% rate — not tax advice; consult a CPA.
Schools (NCES district)
- District
- Boone Community School District
- NCES district ID
- 1905130
- Math proficiency
- 57% ▼ -6.00%
- Reading proficiency
- 66% ▲ 1.00%
- Median HH income
- $48,703
- Composite
- 52.16/100
- National rank
- #1613
- State rank
- #232 of 289 in IA
Livability — Boone
- Score
- 79/100
- State rank
- #112
- US rank
- #2144
Category grades
Schools grade is shown separately in the Schools card above.
Census & demographics
- Census place
- Boone, IA
- Population (ZIP)
- 16,318
Population outlook (Boone County) Hauer SSP2
- Today (2025)
- 27,674 people
- By 2030
- 28,058 · +1.4%
- By 2040
- 28,474 · +2.9%
- By 2050
- 28,383 · +2.6%
- By 2075
- 27,647 · -0.1%
- By 2100
- 25,485 · -7.9%
Race, ethnicity, and origin ACS 2023
- Neighborhood character
- Predominantly White (92%)
- Race & ethnicity
- White 92% Two or more races 4% Hispanic / Latino 3%
- Common ancestry
- Portuguese 10% Iranian 3% Slovak 3%
- Foreign-born
- 1%
- Languages at home
- 98% English-only · Spanish 1%
Political lean MEDSL · Boone
- 2024 margin
- Strong R (+21.5) · D 38.4% · R 59.9% · Other 1.6%
- 2008→2024 swing
- -29.2pp toward R · 2008: 7.6pp · 2024: -21.5pp
- All cycles
- 2024: R+21.5 2020: R+15.6 2016: R+13.9 2012: D+6.4 2008: D+7.6
Not yet ingested
- Civics
- —
Market trends
- HPI YoY
- ▼ -80.62%
- Current HPI
- 216.6814
- Rent YoY
- —
- Metro
- —
- State GDP YoY
- ▲ 2.48%
- F500 in state
- 4
Industry mix (Fortune 500 HQ in IA)
| Industry | F500 HQs | Revenue |
|---|---|---|
| Financial Services | 1 | $16B |
|
||
| Retail / Convenience | 1 | $15B |
|
||
Price history
1 event — show timeline
- 2026-05-27 Listed $173,500 CIBOR
Property tax history
-0.2%/yrLatest (2025): $2,102 · -1.5% YoY. Source: county tax records.
Cash-flow waterfall
monthlySold comps — $/sqft
last 12 mo · ≤1 miLoading sold comps…