 🏷️ Likely Rental
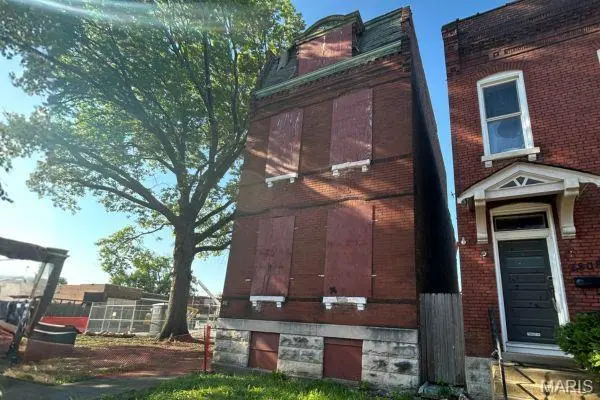
2806 Magnolia Ave · St. Louis, MO
Flood risk 1/10 · Minimal
- FEMA flood zone
- X (unshaded)
- Chance of flooding over 30 yrs
- 0.0%
- Est. flood insurance / yr
- $473 – $860
Fire risk 1/10 · Minimal
- Est. fire insurance / yr
- $1,054 – $1,958
Heat risk 5/10 · Moderate
- Hot days now (above 108°F)
- 7 days/yr
- Hot days in 30 yrs
- 21 days/yr
Wind risk 2/10 · Minimal
- Chance of severe wind over 30 yrs
- 1.0%
Air-quality risk 3/10 · Minor
- Unhealthy air days now
- 3 days/yr
- Unhealthy air days in 30 yrs
- 4 days/yr
Risk factors via First Street. Map © Google.
Why this score? — see what drove the D grade
The composite is a weighted blend of 9 inputs, each scored 0–100. Each bar is that input's sub-score; the figure is the points it added to the 100-point composite (weight × sub-score).
- Cash flow +15.0/30.0
- ARV discount +7.5/15.0
- 1% rule +5.0/10.0
- DSCR +5.0/10.0
- Rent growth +3.7/5.0
- Livability +2.5/5.0
- Condition / age +2.5/5.0
- Schools +1.2/10.0
- Appreciation +0.0/10.0
$10,000
🖨 Deal sheet (PDF) 📄 Offer letter ✓ Due diligence
Listing remarks
Calling all Rehabbers! This 2.5 story, historic home located on the border between the Fox Park & Tower Grove East neighborhoods is seeking caring and capable hands to restore it to its former glory. The home needs EVERYTHING so the rehab is not for the faint of heart but the payoff for your sweat equity is there. To help with repair costs, the renovation of this home may qualify for Historic Tax Credits. As part of the requirements for Seller's acceptance of an offer, the Buyer must submit their renovation plan, proposed budget, and estimated timeline for completion.
Key facts
- 2,613 sq ft lot
- Built 1890
- Listed 48 days
Property features AI
Finance
- Other: Above-grade finished area reported from public records
- Financial info: Lease not considered; No second mortgage reported
Exterior
- Utilities: Public water; Public sewer; Electric service: Ameren; No utilities specifically listed
- Home design: Single family residence; Residential property; Three or more levels; Property listed as fixer; Owner by contract
- Construction: Brick construction
- Exterior features: Rectangular lot
Interior
- Bedrooms: 3 bedrooms total; 2 bedrooms on the main level; 1 bedroom on the upper level
- Bathrooms: 2 full bathrooms total; 1 full bathroom on the main level; 1 full bathroom in the lower level
- Heating & cooling: No heating listed; Cooling: Other
- Interior features: Full walk-out basement
Neighborhood map
What this means for you Summary
Snapshot
- This is a 3-bed/2.0-bath single-family listed at $10k.
Deal economics
- At list price, monthly cash flow is $2k ($19k/yr) — positive.
- The deal already cash-flows at list — no discount required.
- Meets the 1% rule at list price ($2k rent vs $10k).
- Recommended offer: $10k (3.0% below list) — sets the bar for market timing.
- Cap rate 192.7% vs local median 5.0% in St. Louis — top-decile yield for the area; either an underpriced asset or a hidden risk that comps aren't pricing in. Stress-test before assuming the spread holds.
Location & tenants
- Location reads: area grade D — affects rentability + tenant quality, not the cash-flow math above.
- St. Louis City (urban): math 10% / reading 18% proficiency, ranked #312 of 324 in MO (top 96%) — low school quality limits family demand, transient renter base, plan for 1-2y turnover; 80% free/reduced lunch — lower-income household profile, screen leases tightly.
- Zoned schools: Sigel Elem. Comm. Ed. Ctr. (math 2% / reading 2%, grade F, #1,099 of 1,115 statewide, top 100%, 219 students, 99% FRL); Gateway Middle (math 0% / reading 8%, grade F, #389 of 391 statewide, top 100%, 506 students, 99% FRL); Roosevelt High (math 2% / reading 8%, grade F, #517 of 521 statewide, top 100%, 460 students, 99% FRL) — zoned schools average 99% FRL vs 80% district-wide (19 pts higher); higher-poverty schools than district average — tighter screening recommended.
- Market conditions: Rents rising fast (+4.9%/yr); 242 active listings in the ZIP; 17 comparable units currently listed for rent nearby; rentals at typical pace (median 25d on market — plan ~3-4 weeks tenant-placement turnaround); 41% of comp listings sitting > 30 days — soft ceiling on asking rent; 294 units permitted in St. Louis city in 2024 (227 in 5+ unit buildings).
- This rent runs 43% of the median local income ($58k/yr) — at the standard rent-burdened threshold; future hikes will face affordability resistance.
Forward outlook
- Local home prices are declining (-3.0%/yr); year-one equity from $69 of loan paydown is wiped out by about $300 of value loss. Plan a longer hold.
- St. Louis County population projected to shrink 6% by 2050 — rents likely to lag national; underwrite the cash flow, not the appreciation.
- At projected returns (-3.0% appreciation + 4.9% rent growth), your $3k cash investment doubles in ~1 year — after that, you're playing with house money.
Negotiation context
- It's been on market 48 days — a 3% lower offer ($10k) is reasonable based on typical stale-listing flexibility.
Risks & watch-outs
- Watch-outs: property tax is 2.8% of price; built in 1890 — expect roof / HVAC / electrical / plumbing capex.
- Climate carrying-cost: extreme-heat days projected 7→21/yr by 2055 (HVAC capex compounding) — expect insurance premiums to compound above CPI over the hold.
Questions for the listing agent
- It's been on market 48 days. Have you received any prior offers? Is the seller open to a 3% concession, seller financing, or rate buy-down credit?
- Built in 1890 — when were the roof, HVAC, electrical panel, plumbing, and water heater last replaced?
- Property tax is high relative to price — has the assessment been appealed recently, and will the sale trigger a re-assessment?
- Is there a deadline driving the sale (1031 exchange, divorce, estate, relocation)? That informs how much negotiation room exists.
- The area grade is low — what's the realistic commute time and amenity access for the typical tenant pool here? Any planned neighborhood developments (good or bad) we should know about?
- What's the average days-on-market for RENTAL listings here right now (not sales)? A rising rental-DOM trend means longer vacancies and softer asking-rent achievability than the comps imply.
- What's the recent tenant-quality profile in this submarket — average credit score on applications, eviction rate, late-payment / NSF rate, and stable-employment percentage? A property-management company in the area should have these aggregated.
- How much new for-sale + rental construction is in the pipeline within 1–3 miles? Heavy new supply typically softens prices + rents 12–24 months out; constrained supply supports both.
Investment metrics
- 1% rule
- 20.67% ✓
- Cap rate
- 192.66%
- Cash-on-cash
- 665.58%
- DSCR
- 30.61
- GRM
- 0.4
CMA / ARV
- ARV (median comp)
- $367,821
- List price
- $10,000
- Delta
- -97.28%
- Verdict
- UNDERPRICED
- Comps
- 20 within 1.0 mi
Show comp detail 12 sales within ~0.75 mi
| Address | Dist | Beds/Ba | Sqft | Sold | Price | $/sf | Match |
|---|---|---|---|---|---|---|---|
| 2870 Texas Ave | 0.25mi | 3/2.5 | 2,856 (-4%) | 5mo | $298,000 | $104 | 76 |
| 2805 Wyoming St | 0.42mi | 3/2.5 | 3,051 (+2%) | 2mo | $325,000 | $107 | 72 |
| 2846 Accomac St | 0.43mi | 4/2.5 (+1) | 2,996 (+1%) | 2mo | $485,000 | $162 | 70 |
| 2842 Victor St | 0.25mi | 4/3.0 (+1) | 2,811 (-6%) | 3mo | $488,000 | $174 | 68 |
| 2520 California Ave | 0.22mi | 4/2.0 (+1) | 3,386 (+14%) | 0mo | $449,900 | $133 | 61 |
| 3219 Iowa Ave | 0.48mi | 4/3.5 (+1) | 2,907 (-2%) | 2mo | $450,000 | $155 | 61 |
| 2315 Russell Blvd | 0.66mi | 4/2.5 (+1) | 3,034 (+2%) | 0mo | $399,000 | $132 | 59 |
| 2628 Indiana Ave | 0.37mi | 3/2.5 | 2,554 (-14%) | 2mo | $350,000 | $137 | 55 |
| 2848 Mcnair Ave | 0.48mi | 4/4.0 (+1) | 3,130 (+5%) | 1mo | $500,000 | $160 | 55 |
| 2808 Russell Blvd | 0.54mi | 4/3.5 (+1) | 3,102 (+4%) | 5mo | $450,000 | $145 | 52 |
| 2820 Accomac St | 0.42mi | 4/3.5 (+1) | 2,650 (-11%) | 4mo | $569,000 | $215 | 47 |
| 2601 Louisiana Ave | 0.53mi | 4/3.5 (+1) | 2,594 (-13%) | 6mo | $449,500 | $173 | 38 |
Match score weights: distance 35% · size 25% · config 20% · recency 20%. Top-matched comps best support the ARV.
Projected returns pro-forma
-3.0% appreciation · 4.89% rent growth · sell at horizon
- IRR
- —
- Equity multiple
- 37.19×
- Total profit
- $101,334
- Equity at exit
- $1,491
- IRR
- —
- Equity multiple
- 84.16×
- Total profit
- $232,836
- Equity at exit
- $865
Cash invested: $2,800 (down + closing). Projections, not guarantees.
Landlord ↔ Tenant lean methodology
- Overall (STATE)
- 81 Strongly Landlord-Friendly
- State Missouri
- 81 Strongly Landlord-Friendly · R+10
- County
- — inherits STATE
- City
- — inherits STATE
ZIP-level market 63118
- Rents YoY
- 4.9%
- Active inventory
- 242
- Price-to-rent
- 0.4×
Monthly cashflow live
- Estimated rent
- $2,067 high interval (Pro) →
- Mortgage (P&I)
- −$52
- Tax from tax record
- −$23 /mo · $277/yr
- Insurance
- −$4
- HOA
- −$0
- Vacancy / Maint / Mgmt
- −$434
- Net cashflow
- $1,553
Break-even live
Sensitivity live
| Price | -10% $1,559 | -5% $1,556 | +0% $1,553 | +5% $1,550 | +10% $1,547 |
|---|---|---|---|---|---|
| Rent | -10% $1,390 | -5% $1,471 | +0% $1,553 | +5% $1,635 | +10% $1,716 |
| Rate | -1.0pp $1,558 | -0.5pp $1,556 | base $1,553 | +0.5pp $1,550 | +1.0pp $1,548 |
UW: 25.0% down · 7.5% · 30yr · 1.5% tax · 5.0% vac · 8.0% maint · 8.0% mgmt
Financing live
Cash to close
- Down payment
- $2,500
- Closing costs
- $300
- Reserves months
- —
- Total cash needed
- —
Loan-product check · same deal, 3 products live
Conventional
25% down · 7.5% · 30yr
- Down + closing
- —
- Monthly P&I
- —
- Monthly cashflow
- —
- DSCR
- —
- Eligible?
- —
Personal DTI + credit; lowest rate.
DSCR
20% down · 8.5% · 30yr
- Down + closing
- —
- Monthly P&I
- —
- Monthly cashflow
- —
- DSCR
- —
- Eligible?
- —
No personal income docs; deal must DSCR.
Hard money
10% down · 12.0% · 12mo
- Down + closing
- —
- Monthly P&I
- —
- Monthly cashflow
- —
- DSCR
- —
- Eligible?
- —
Short-term bridge; refi at stabilization.
Rent comps 17 comps
| Address | Beds | Baths | Sqft | Rent | $/sqft | DOM | Units | Dist |
|---|---|---|---|---|---|---|---|---|
| 2648 California Ave Saint Louis, MO | 4.0 | 2.0 | 2458 | $2,000 | $0.81 | 25d | 1 | 0.07mi |
| 2811 Missouri Ave Saint Louis, MO | 4.0 | 2.5 | 2673 | $3,622 | $1.36 | 45d | 1 | 0.38mi |
| 2643 Wyoming St Saint Louis, MO | 3.0 | 2.5 | 2592 | $2,600 | $1.00 | 45d | 1 | 0.47mi |
| 3228 Arsenal St Unit 1f St. Louis, MO | 2.0 | 1.0 | 2702 | $1,395 | $0.52 | 25d | 1 | 0.49mi |
| 2048 Russell Blvd Saint Louis, MO | 4.0 | 2.0 | 3024 | $2,300 | $0.76 | 45d | 1 | 0.71mi |
| 3429 Ohio Ave Saint Louis, MO | 3.0 | 3.0 | 1938 | $2,250 | $1.16 | 18d | 1 | 0.78mi |
| 2035 Allen Ave Saint Louis, MO | 2.0 | 2.0 | 2974 | $1,625 | $0.55 | 16d | 1 | 0.80mi |
| 1231 Allen Market Ln St. Louis, MO | 3.0 | 2.5 | 3000 | $1,995 | $0.67 | 45d | 1 | 0.99mi |
| 1229-1231 Allen Market Ln Unit 1231 St. Louis, MO | 3.0 | 3.0 | 3000 | $1,995 | $0.67 | 45d | 1 | 0.99mi |
| 2211 Menard St Unit A St. Louis, MO | 3.0 | 1.5 | 2440 | $2,200 | $0.90 | 6d | 1 | 1.07mi |
| 2211 Menard St Unit B St. Louis, MO | 3.0 | 1.5 | 2440 | $2,200 | $0.90 | 4d | 1 | 1.07mi |
| 2406 S 10th St Saint Louis, MO | 3.0 | 2.0 | 2000 | $1,795 | $0.90 | 0d | 1 | 1.08mi |
| 3458 Giles Ave Saint Louis, MO | 3.0 | 2.5 | 2204 | $2,400 | $1.09 | 9d | 1 | 1.16mi |
| 3526 S Spring Ave Saint Louis, MO | 4.0 | 2.0 | 2244 | $2,877 | $1.28 | 45d | 1 | 1.28mi |
| 3807 Potomac St Saint Louis, MO | 3.0 | 1.0 | 2588 | $1,300 | $0.50 | 9d | 1 | 1.31mi |
| 3807 Potomac St Saint Louis, MO | 3.0 | 1.0 | 2588 | $1,100 | $0.43 | 45d | 1 | 1.31mi |
| 3908 McDonald Ave Saint Louis, MO | 3.0 | 2.0 | 1927 | $2,500 | $1.30 | 6d | 1 | 1.34mi |
Listing history 20 events
-
2026-06-21days on market $10,000 Active 48 DOM
-
2026-06-18days on market $10,000 Active 45 DOM
-
2026-06-17days on market $10,000 Active 44 DOM
-
2026-06-16days on market $10,000 Active 43 DOM
-
2026-06-15days on market $10,000 Active 42 DOM
-
2026-06-13days on market $10,000 Active 40 DOM
-
2026-06-09days on market $10,000 Active 36 DOM
-
2026-06-08days on market $10,000 Active 35 DOM
-
2026-06-07days on market $10,000 Active 34 DOM
-
2026-06-05days on market $10,000 Active 31 DOM
-
2026-06-03days on market $10,000 Active 30 DOM
-
2026-06-02days on market $10,000 Active 29 DOM
-
2026-06-01days on market $10,000 Active 28 DOM
-
2026-05-31days on market $10,000 Active 27 DOM
-
2026-05-05$10,000 Active 579-char remark
-
2026-05-01historical $10,000 579-char remark
-
2015-12-16soldstatus $76,000
-
2015-10-21soldstatus
-
2015-10-21soldstatus
-
2004-12-21soldstatus $38,000
ⓘ Source: listings_history table (triggers on properties + properties_extension) + one-shot
backfill from property_details.listing_events for pre-trigger history.
Tax reassessment forecast MO · Resets to sale price
- Current annual tax
- $277 · $23/mo
- Projected year-2 tax
- $277 · $23/mo
- Expected delta
- $0/yr ($0/mo · 0.0%)
ⓘ Screening estimate from a state-policy table — verify with the county assessor before closing.
Climate risk First Street
- Flood 1/10 Low FEMA zone X (unshaded) · 0% chance over 30 yrs
- Wildfire 1/10 Low
- Heat 5/10 Major 7 d/yr ≥108°F today · 21 d/yr by 30 yrs out
- Wind 2/10 Low 100% chance of damaging wind over 30 yrs
- Air quality 3/10 Moderate 3 unhealthy d/yr today · 4 by 30 yrs out
Nearby sold comps map
Loading sold comps map…
Walkable amenities ~0.75 mi
Loading nearby amenities…
Taxation est. · year 1
- Rental income
- $24,800
- − Mortgage interest
- −$560
- − Property taxes
- −$277
- − Insurance
- −$50
- − Repairs & maintenance
- −$1,984
- − Management
- −$1,984
- − Depreciation
- −$291
- Taxable income
- $19,654
- Est. tax owed @ 24.0%
- −$4,717
- After-tax cash flow
- $13,919/yr
For passive investors: Depreciation is non-cash, so a rental often shows a tax loss while cash-flowing — sheltering income. Rental losses are passive: they offset passive income freely, and up to $25,000/yr can offset ordinary (W-2) income if you actively participate and your MAGI is under $100k (phasing out to $0 by $150k); unused losses carry forward. On sale, claimed depreciation is recaptured at up to 25%, and gains may owe capital-gains tax (a 1031 exchange can defer both). Figures are a year-1 estimate at your 24.0% rate — not tax advice; consult a CPA.
Schools (NCES district)
- District
- St. Louis City
- NCES district ID
- 2929280
- Math proficiency
- 10% ▼ -6.00%
- Reading proficiency
- 18% ▼ -3.00%
- Median HH income
- $35,685
- Composite
- 11.54/100
- National rank
- #9699
- State rank
- #312 of 324 in MO
Livability — St. Louis
No livability data for this city. (Only ~50 U.S. cities are tracked.)
Census & demographics
- Census place
- St. Louis, MO
- County
- Saint Louis City · 254,015 people
- City population
- 283,259
- Metro
- St. Louis, MO-IL
- Population (ZIP)
- 25,913
- Household income
- $57,762
- Rent vs Own
- Severe rent burden
- 1495.0
Population outlook (St. Louis County) Hauer SSP2
- Today (2025)
- 315,737 people
- By 2030
- 313,865 · -0.6%
- By 2040
- 305,439 · -3.3%
- By 2050
- 296,529 · -6.1%
- By 2075
- 271,028 · -14.2%
- By 2100
- 255,359 · -19.1%
Race, ethnicity, and origin ACS 2023
- Neighborhood character
- Diverse neighborhood (Simpson 0.63)
- Race & ethnicity
- White 44% Black 41% Two or more races 8% Hispanic / Latino 8% Asian 2%
- Hispanic origin (detail)
- Mexican 6%
- Common ancestry
- Slovak 2% Lithuanian 2% Romanian 2%
- Foreign-born
- 6% · Canada, Vietnam
- Languages at home
- 90% English-only · Spanish 5% Vietnamese 1% French/Haitian/Cajun 1%
Political lean MEDSL · St. Louis
- 2024 margin
- Solid D (+64.7) · D 81.4% · R 16.7% · Other 2.0%
- 2008→2024 swing
- -3.5pp toward R · 2008: 68.2pp · 2024: 64.7pp
- All cycles
- 2024: D+64.7 2020: D+66.2 2016: D+63.7 2012: D+66.6 2008: D+68.2
Not yet ingested
- Civics
- —
Market trends
- HPI YoY
- ▼ -347.51%
- Current HPI
- 171.5963
- Rent YoY
- ▲ 4.89%
- Metro
- St. Louis, MO-IL
- State GDP YoY
- ▲ 1.84%
- F500 in state
- 20
Industry mix (Fortune 500 HQ in MO)
| Industry | F500 HQs | Revenue |
|---|---|---|
| Healthcare | 1 | $163B |
|
||
| Insurance | 1 | $21B |
|
||
| Industrial Technology | 1 | $17B |
|
||
| Retail | 1 | $16B |
|
||
| Industrial Distribution | 1 | $10B |
|
||
| Utilities | 1 | $9B |
|
||
Price history
-73.7% since first listed6 events — show timeline
- 2026-05-05 Listed $10,000 MARIS as Distributed by MLS Grid
- 2026-05-01 Coming Soon $10,000 MARIS as Distributed by MLS Grid
- 2015-12-16 Sold (Public Records) $76,000 Public Records
- 2015-10-21 Sold (Public Records) — Public Records
- 2015-10-21 Sold (Public Records) — Public Records
- 2004-12-21 Sold (Public Records) $38,000 Public Records
Property tax history
-11.4%/yrLatest (2024): $277 · -6.8% YoY. Source: county tax records.
Cash-flow waterfall
monthlySold comps — $/sqft
last 12 mo · ≤1 miLoading sold comps…