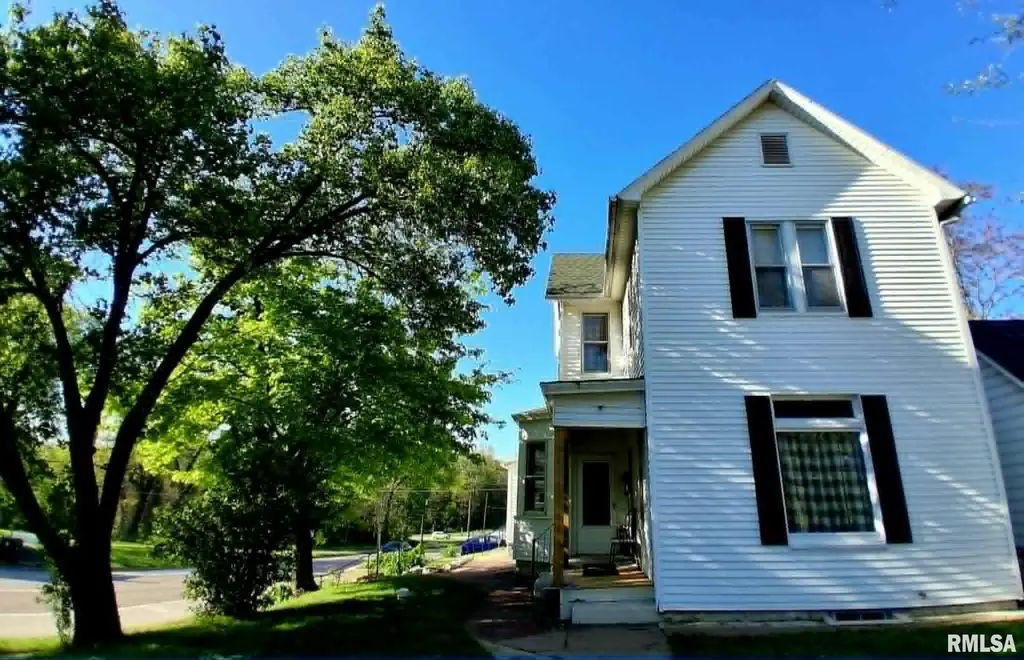
301 Cherry St · Quincy, IL
Flood risk 1/10 · Minimal
- FEMA flood zone
- X (unshaded)
- Chance of flooding over 30 yrs
- 0.0%
- Est. flood insurance / yr
- $473 – $860
Fire risk 1/10 · Minimal
- Est. fire insurance / yr
- $804 – $1,492
Heat risk 3/10 · Minor
- Hot days now (above 107°F)
- 7 days/yr
- Hot days in 30 yrs
- 17 days/yr
Wind risk 2/10 · Minimal
- Chance of severe wind over 30 yrs
- —
Air-quality risk 2/10 · Minimal
- Unhealthy air days now
- 1 days/yr
- Unhealthy air days in 30 yrs
- 1 days/yr
Risk factors via First Street. Map © Google.
Why this score? — see what drove the B- grade
The composite is a weighted blend of 9 inputs, each scored 0–100. Each bar is that input's sub-score; the figure is the points it added to the 100-point composite (weight × sub-score).
- Cash flow +30.0/30.0
- DSCR +10.0/10.0
- 1% rule +7.9/10.0
- ARV discount +7.5/15.0
- Rent growth +5.0/5.0
- Livability +3.4/5.0
- Condition / age +2.5/5.0
- Schools +2.2/10.0
- Appreciation +0.0/10.0
$129,900
🖨 Deal sheet 📄 Offer letter ✓ Due diligence
Listing remarks MLS
Located on a corner lot and offers updated HVAC system, replacement windows. Butternut woodwork in living and dining room with pocket doors. Two car garage with an attached storage / workshop area. Other room was used as a kitchenette area with sink, 100 amp electrical service. Inspections welcome but being sold as-is.
Key facts
- New shower
- New ceiling lighting
- New cabinets
Tags
Property features AI
Exterior
- Parking: Detached garage; 2-car garage spaces; On-street parking available
- Utilities: Public water; Public sewer
- Home design: Single family residence; Two levels; Built in 1927
- Construction: Shingle roof
- Exterior features: Replacement windows; Corner lot; Paved road frontage
Interior
- Kitchen: Dishwasher; Microwave; Refrigerator; Pantry
- Bedrooms: 4 bedrooms (Bedroom 1 on Main level; others on Upper level and additional/lower levels including Basement and Additional Level)
- Flooring: Hardwood (in several bedrooms and mud room); Carpet (in some bedrooms and pantry); Luxury vinyl plank (living room and kitchen)
- Bathrooms: 1 full bathroom; 1 half bathroom
- Heating & cooling: Forced air heating; Central air conditioning
- Interior features: Attic storage; Cable available; High-speed internet; Full unfinished basement
- Laundry & utility: Gas water heater
Neighborhood map
What this means for you Summary
Snapshot
- This is a 4-bed/1.5-bath single-family listed at $130k.
Deal economics
- At list price, monthly cash flow is $525 ($6k/yr) — positive.
- The deal already cash-flows at list — no discount required.
- Meets the 1% rule at list price ($2k rent vs $130k).
- Recommended offer: $126k (3.0% below list) — sets the bar for market timing.
- Cap rate 11.1% vs local median 4.3% in Quincy — top-decile yield for the area; either an underpriced asset or a hidden risk that comps aren't pricing in. Stress-test before assuming the spread holds.
Location & tenants
- Location reads 67/100 on livability (#506 in IL) — a middle-class / working-renter tenant base. Strengths: cost of living A+, housing A+; Watch: crime D, employment D, amenities D-.
- Quincy SD 172 (town): math 24% / reading 27% proficiency, ranked #328 of 620 in IL (top 53%) — low school quality limits family demand, transient renter base, plan for 1-2y turnover.
- Zoned schools: Quincy Sr High School (math 21% / reading 28%, grade F, #256 of 693 statewide, top 44%, 1,924 students, 0% FRL) — zoned schools average 0% FRL vs 48% district-wide (48 pts lower); this property's tenant base skews higher-income than the district average.
- Market conditions: Rents rising fast (+10.8%/yr); 180 active listings in the ZIP; 1 comparable units currently listed for rent nearby; 68 units permitted in Adams County in 2024 (0 in 5+ unit buildings).
- This rent runs 38% of the median local income ($52k/yr) — at the standard rent-burdened threshold; future hikes will face affordability resistance.
Forward outlook
- Local home prices are declining (-3.0%/yr); year-one equity from $898 of loan paydown is wiped out by about $4k of value loss. Plan a longer hold.
- Adams County population projected at -14% by 2050 — secular population decline; favor cash flow + early exit over multi-decade hold.
- At projected returns (-3.0% appreciation + 8.0% rent growth), your $36k cash investment doubles in ~6 years — after that, you're playing with house money.
Negotiation context
- It's been on market 49 days — a 3% lower offer ($126k) is reasonable based on typical stale-listing flexibility.
- 3 sale attempts since 4y ago; this cycle's ask has dropped $20k (13%) from the opening price — seller is motivated, your offer sets the floor, not the list.
- Current owner paid $50k; list at $130k implies a 160% gain — meaningful room to come down on a strong offer.
Risks & watch-outs
- Watch-outs: built in 1927 — expect roof / HVAC / electrical / plumbing capex.
Questions for the listing agent
- It's been on market 49 days. Have you received any prior offers? Is the seller open to a 3% concession, seller financing, or rate buy-down credit?
- Built in 1927 — when were the roof, HVAC, electrical panel, plumbing, and water heater last replaced?
- Is there a deadline driving the sale (1031 exchange, divorce, estate, relocation)? That informs how much negotiation room exists.
- Schools are D-rated, which usually means shorter tenancies and higher turnover. Who's the typical renter profile here, and what's been the actual vacancy rate?
- Crime grade is D in this area — have there been break-ins, vandalism, or insurance claims at this property in the last 3 years? What carrier currently insures it and at what premium?
- What's the average days-on-market for RENTAL listings here right now (not sales)? A rising rental-DOM trend means longer vacancies and softer asking-rent achievability than the comps imply.
- What's the recent tenant-quality profile in this submarket — average credit score on applications, eviction rate, late-payment / NSF rate, and stable-employment percentage? A property-management company in the area should have these aggregated.
- How much new for-sale + rental construction is in the pipeline within 1–3 miles? Heavy new supply typically softens prices + rents 12–24 months out; constrained supply supports both.
Investment metrics
- 1% rule
- 1.29% ✓
- Cap rate
- 11.14%
- Cash-on-cash
- 17.32%
- DSCR
- 1.77
- GRM
- 6.5
CMA / ARV
- ARV (median comp)
- $82,727
- List price
- $129,900
- Delta
- 57.02%
- Verdict
- OVERPRICED
- Comps
- 20 within 1.0 mi
Show comp detail 12 sales within ~0.75 mi
| Address | Dist | Beds/Ba | Sqft | Sold | Price | $/sf | Match |
|---|---|---|---|---|---|---|---|
| 1421 N 7th St | 0.45mi | 3/2.0 (-1) | 1,795 (+0%) | 7mo | $124,600 | $69 | 66 |
| 1330 N 6th St | 0.35mi | 3/2.0 (-1) | 1,908 (+7%) | 0mo | $132,000 | $69 | 65 |
| 1524 N 6th St | 0.47mi | 3/2.0 (-1) | 1,680 (-6%) | 4mo | $25,000 | $15 | 58 |
| 1030 N 8th St | 0.44mi | 3/1.0 (-1) | 1,695 (-5%) | 8mo | $125,000 | $74 | 57 |
| 828 Spruce St | 0.50mi | 4/2.0 | 1,861 (+4%) | 13mo | $116,000 | $62 | 57 |
| 615 N 8th | 0.58mi | 4/2.0 | 1,735 (-3%) | 11mo | $14,500 | $8 | 57 |
| 1228 N 9th St | 0.54mi | 3/2.0 (-1) | 1,869 (+4%) | 14mo | $62,000 | $33 | 49 |
| 1415 N 10th St | 0.64mi | 3/1.5 (-1) | 1,696 (-5%) | 10mo | $142,000 | $84 | 48 |
| 1120 N 8th St | 0.44mi | 4/1.5 | 2,051 (+15%) | 10mo | $42,000 | $20 | 47 |
| 908 Spruce St | 0.55mi | 3/4.0 (-1) | 1,649 (-8%) | 2mo | $60,000 | $36 | 45 |
| 405 Parkview Dr | 0.72mi | 3/1.5 (-1) | 2,024 (+13%) | 6mo | $138,000 | $68 | 34 |
| 623 N 8th | 0.57mi | 3/1.5 (-1) | 1,519 (-15%) | 14mo | $35,000 | $23 | 31 |
Match score weights: distance 35% · size 25% · config 20% · recency 20%. Top-matched comps best support the ARV.
Projected returns pro-forma
-3.0% appreciation · 8.0% rent growth · sell at horizon
- IRR
- 13.8%
- Equity multiple
- 1.58×
- Total profit
- $21,176
- Equity at exit
- $19,369
- IRR
- 26.0%
- Equity multiple
- 3.79×
- Total profit
- $101,498
- Equity at exit
- $11,231
Cash invested: $36,372 (down + closing). Projections, not guarantees.
Landlord ↔ Tenant lean methodology
- Overall (STATE)
- 43 Moderately Tenant-Leaning
- State Illinois
- 43 Moderately Tenant-Leaning · D+7
- County
- — inherits STATE
- City
- — inherits STATE
ZIP-level market 62301
- Rents YoY
- 10.8%
- Active inventory
- 180
- Price-to-rent
- 6.5×
Monthly cashflow live
- Estimated rent
- $1,669 medium interval (Pro) →
- Mortgage (P&I)
- −$681
- Tax from tax record
- −$58 /mo · $700/yr
- Insurance
- −$54
- HOA
- −$0
- Vacancy / Maint / Mgmt
- −$351
- Net cashflow
- $525
Break-even live
UW: 25.0% down · 7.5% · 30yr · 1.5% tax · 5.0% vac · 8.0% maint · 8.0% mgmt
Financing live
Cash to close
- Down payment
- $32,475
- Closing costs
- $3,897
- Reserves months
- —
- Total cash needed
- —
Loan-product check · same deal, 3 products live
Conventional
25% down · 7.5% · 30yr
- Down + closing
- —
- Monthly P&I
- —
- Monthly cashflow
- —
- DSCR
- —
- Eligible?
- —
Personal DTI + credit; lowest rate.
DSCR
20% down · 8.5% · 30yr
- Down + closing
- —
- Monthly P&I
- —
- Monthly cashflow
- —
- DSCR
- —
- Eligible?
- —
No personal income docs; deal must DSCR.
Hard money
10% down · 12.0% · 12mo
- Down + closing
- —
- Monthly P&I
- —
- Monthly cashflow
- —
- DSCR
- —
- Eligible?
- —
Short-term bridge; refi at stabilization.
Rent comps 1 comps
| Address | Beds | Baths | Sqft | Rent | $/sqft | DOM | Units | Dist |
|---|---|---|---|---|---|---|---|---|
| 116 N 3rd St Quincy, IL | 1.0–4.0 | 1.0–2.0 | 1950 | $5,600 | $2.87 | 43d | 12 | 0.86mi |
Listing history 22 events
-
2026-06-19days on market $129,900 Active 49 DOM
-
2026-06-18days on market $129,900 Active 48 DOM
-
2026-06-17days on market $129,900 Active 47 DOM
-
2026-06-16days on market $129,900 Active 46 DOM
-
2026-06-15days on market $129,900 Active 45 DOM
-
2026-06-14days on market $129,900 Active 43 DOM
-
2026-06-12days on market $129,900 Active 42 DOM
-
2026-06-09days on market $129,900 Active 39 DOM
-
2026-06-08days on market $129,900 Active 38 DOM
-
2026-06-07pricedays on market $129,900 Active 37 DOM
-
2026-06-03days on market $134,900 Active 33 DOM
-
2026-06-02days on market $134,900 Active 32 DOM
-
2026-06-01days on market $134,900 Active 31 DOM
-
2026-05-31days on market $134,900 Active 30 DOM
-
2026-05-30days on market $134,900 Active 29 DOM
-
2026-05-15price $144,900 641-char remark
-
2026-05-01$149,900 Active 641-char remark
-
2022-05-26soldstatus $50,000
-
2022-05-20soldstatus $50,000 321-char remark
Show marketing remark (321 chars)
Located on a corner lot and offers updated HVAC system, replacement windows. Butternut woodwork in living and dining room with pocket doors. Two car garage with an attached storage / workshop area. Other room was used as a kitchenette area with sink, 100 amp electrical service. Inspections welcome but being sold as-is.
-
2022-05-20soldstatus $50,000
Show marketing remark (321 chars)
Located on a corner lot and offers updated HVAC system, replacement windows. Butternut woodwork in living and dining room with pocket doors. Two car garage with an attached storage / workshop area. Other room was used as a kitchenette area with sink, 100 amp electrical service. Inspections welcome but being sold as-is.
-
2022-01-07$59,900 321-char remark
Show marketing remark (321 chars)
Located on a corner lot and offers updated HVAC system, replacement windows. Butternut woodwork in living and dining room with pocket doors. Two car garage with an attached storage / workshop area. Other room was used as a kitchenette area with sink, 100 amp electrical service. Inspections welcome but being sold as-is.
-
2022-01-07$59,900
Show marketing remark (321 chars)
Located on a corner lot and offers updated HVAC system, replacement windows. Butternut woodwork in living and dining room with pocket doors. Two car garage with an attached storage / workshop area. Other room was used as a kitchenette area with sink, 100 amp electrical service. Inspections welcome but being sold as-is.
ⓘ Source: listings_history table (triggers on properties + properties_extension) + one-shot
backfill from property_details.listing_events for pre-trigger history.
Tax reassessment forecast IL · Partial reset (capped growth)
- Current annual tax
- $700 · $58/mo
- Projected year-2 tax
- $1,824 · $152/mo
- Expected delta
- +$1,124/yr (+$94/mo · 160.6%)
ⓘ Screening estimate from a state-policy table — verify with the county assessor before closing.
Climate risk First Street
- Flood 1/10 Low FEMA zone X (unshaded) · 0% chance over 30 yrs
- Wildfire 1/10 Low
- Heat 3/10 Moderate 7 d/yr ≥107°F today · 17 d/yr by 30 yrs out
- Wind 2/10 Low
- Air quality 2/10 Low 1 unhealthy d/yr today · 1 by 30 yrs out
Nearby sold comps map
Loading sold comps map…
Walkable amenities ~0.75 mi
Loading nearby amenities…
Taxation est. · year 1
- Rental income
- $20,032
- − Mortgage interest
- −$7,276
- − Property taxes
- −$700
- − Insurance
- −$650
- − Repairs & maintenance
- −$1,603
- − Management
- −$1,603
- − Depreciation
- −$3,779
- Taxable income
- $4,422
- Est. tax owed @ 24.0%
- −$1,061
- After-tax cash flow
- $5,240/yr
For passive investors: Depreciation is non-cash, so a rental often shows a tax loss while cash-flowing — sheltering income. Rental losses are passive: they offset passive income freely, and up to $25,000/yr can offset ordinary (W-2) income if you actively participate and your MAGI is under $100k (phasing out to $0 by $150k); unused losses carry forward. On sale, claimed depreciation is recaptured at up to 25%, and gains may owe capital-gains tax (a 1031 exchange can defer both). Figures are a year-1 estimate at your 24.0% rate — not tax advice; consult a CPA.
Schools (NCES district)
- District
- Quincy SD 172
- NCES district ID
- 1733000
- Math proficiency
- 24% ▬ 0.00%
- Reading proficiency
- 27% ▬ 0.00%
- Median HH income
- $44,132
- Composite
- 21.91/100
- National rank
- #8229
- State rank
- #328 of 620 in IL
Livability — Quincy
- Score
- 67/100
- State rank
- #506
- US rank
- #10458
Category grades
Schools grade is shown separately in the Schools card above.
Census & demographics
- Census place
- Quincy, IL
- County
- Adams County · 30,746 people
- City population
- 30,746
- Metro
- Quincy, IL-MO
- Population (ZIP)
- 30,746
- Household income
- $52,055
- Rent vs Own
- Severe rent burden
- 1238.0
Population outlook (Adams County) Hauer SSP2
- Today (2025)
- 65,795 people
- By 2030
- 64,436 · -2.1%
- By 2040
- 61,007 · -7.3%
- By 2050
- 56,851 · -13.6%
- By 2075
- 46,424 · -29.4%
- By 2100
- 34,305 · -47.9%
Race, ethnicity, and origin ACS 2023
- Neighborhood character
- Predominantly White (84%)
- Race & ethnicity
- White 84% Two or more races 7% Black 6% Hispanic / Latino 3% Asian 1%
- Common ancestry
- Slovak 2% Iranian 1% Lithuanian 1%
- Foreign-born
- 2% · Canada
- Languages at home
- 96% English-only · Spanish 2%
Political lean MEDSL · Adams
- 2024 margin
- Solid R (+47.4) · D 25.6% · R 73.0% · Other 1.5%
- 2008→2024 swing
- -25.0pp toward R · 2008: -22.4pp · 2024: -47.4pp
- All cycles
- 2024: R+47.4 2020: R+46.5 2016: R+47.5 2012: R+35.2 2008: R+22.4
Not yet ingested
- Civics
- —
Market trends
- HPI YoY
- ▼ -121.44%
- Current HPI
- 131.7344
- Rent YoY
- ▲ 10.78%
- Metro
- Quincy, IL-MO
- State GDP YoY
- ▲ 1.59%
- F500 in state
- 60
Industry mix (Fortune 500 HQ in IL)
| Industry | F500 HQs | Revenue |
|---|---|---|
| Insurance | 4 | $201B |
|
||
| Consumer Goods | 4 | $87B |
|
||
| Industrial Machinery | 3 | $64B |
|
||
| Healthcare | 2 | $55B |
|
||
| Retail / Pharmacy | 1 | $148B |
|
||
| Agriculture / Food | 1 | $86B |
|
||
Price history
+116.9% since first listed9 events — show timeline
- 2026-06-05 Price Changed $129,900 RMLSA as Distributed by MLS Grid
- 2026-05-27 Price Changed $134,900 RMLSA as Distributed by MLS Grid
- 2026-05-15 Price Changed $144,900 RMLSA as Distributed by MLS Grid
- 2026-05-01 Listed $149,900 RMLSA as Distributed by MLS Grid
- 2022-05-26 Sold (Public Records) $50,000 Public Records
- 2022-05-20 Sold (MLS) $50,000 Quincy AOR
- 2022-05-20 Sold (MLS) $50,000 MRED as Distributed by MLS Grid
- 2022-01-07 Listed $59,900 Quincy AOR
- 2022-01-07 Listed $59,900 MRED as Distributed by MLS Grid
Property tax history
-5.2%/yrLatest (2023): $700 · -37.3% YoY. Source: county tax records.
Cash-flow waterfall
monthlySold comps — $/sqft
last 12 mo · ≤1 miLoading sold comps…