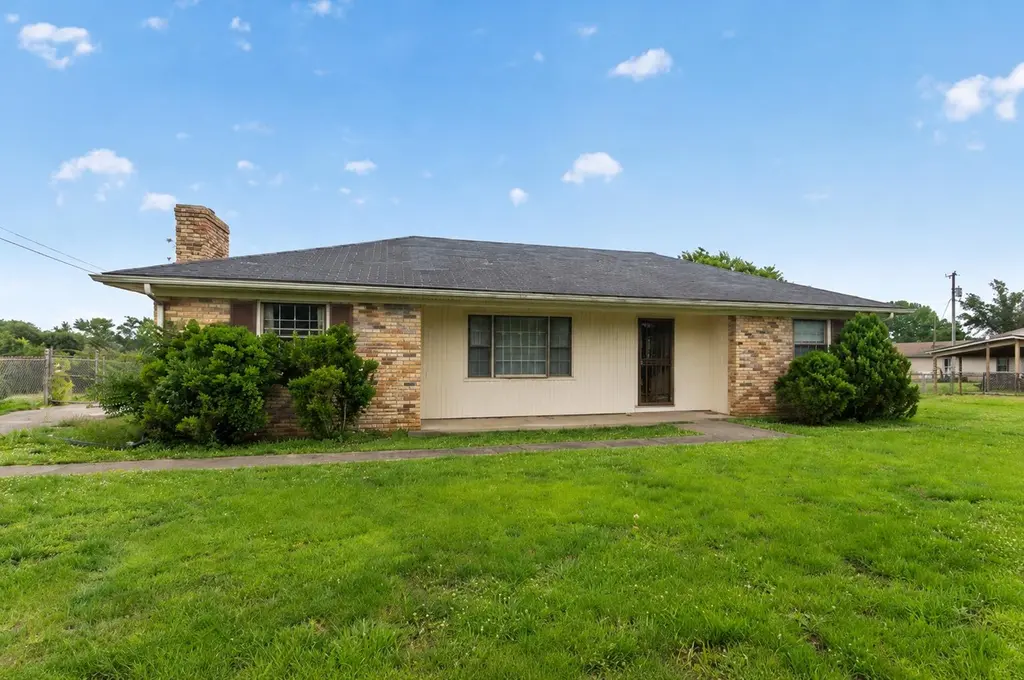
3391 Union Mill Rd · Lexington-Fayette, KY
Flood risk 1/10 · Minimal
- FEMA flood zone
- X (unshaded)
- Chance of flooding over 30 yrs
- 0.0%
- Est. flood insurance / yr
- $507 – $1,088
Fire risk 4/10 · Minor
- Est. fire insurance / yr
- $839 – $1,559
Heat risk 4/10 · Minor
- Hot days now (above 102°F)
- 7 days/yr
- Hot days in 30 yrs
- 19 days/yr
Wind risk 3/10 · Minor
- Chance of severe wind over 30 yrs
- 5.0%
Air-quality risk 1/10 · Minimal
- Unhealthy air days now
- 0 days/yr
- Unhealthy air days in 30 yrs
- 0 days/yr
Risk factors via First Street. Map © Google.
Why this score? — see what drove the B- grade
The composite is a weighted blend of 9 inputs, each scored 0–100. Each bar is that input's sub-score; the figure is the points it added to the 100-point composite (weight × sub-score).
- Cash flow +30.0/30.0
- 1% rule +10.0/10.0
- DSCR +10.0/10.0
- ARV discount +7.5/15.0
- Rent growth +4.4/5.0
- Schools +3.3/10.0
- Livability +2.5/5.0
- Condition / age +2.2/5.0
- Appreciation +0.0/10.0
$90,000
🖨 Deal sheet 📄 Offer letter ✓ Due diligence
Listing remarks
Conveniently situated just minutes from Nicholasville, Lexington, and I-75, this property offers an outstanding location with easy access to shopping, dining, schools, and employment opportunities, all while living in a rural atmosphere. Situated on a nice . 48+/- acre lot, this home features a large yard, a fenced backyard with plenty of space for a garden, and a detached one-car garage. Whether you are looking for your next renovation project, a rental property, or a place to make your own, this property has tremendous potential. The home offers: 2 Bedrooms, 1.5 Baths, a formal living room, a separate den with a fireplace and an eat-in kitchen. While the home needs some repairs and genera
Key facts
- Large yard
- Solid foundation
- Fenced backyard
Tags
Property features AI
Exterior
- Parking: Detached garage; Property has a garage
- Utilities: Public water; Septic tank; Electricity connected; Water connected
- Home design: House; Single story
- Construction: Brick veneer construction; Block foundation; Composition roof; Building area reported as 1,262
- Exterior features: Brick veneer exterior; Block foundation; Composition roof; Not waterfront; Lot listed as approximately 0.5439 acres
Interior
- Kitchen: Eat-in kitchen
- Bedrooms: 6 total rooms (bedroom count not specified separately)
- Flooring: Carpet; Hardwood; Vinyl
- Bathrooms: 1 full bathroom; 1 half bathroom
- Heating & cooling: Ceiling heating
- Interior features: Eat-in kitchen; Fireplace
- Laundry & utility: Washer hookup; Electric dryer hookup
Neighborhood map
What this means for you Summary
Snapshot
- This is a 2-bed/1.5-bath single-family listed at $90k. Condition is rated fair.
Deal economics
- At list price, monthly cash flow is $610 ($7k/yr) — positive.
- The deal already cash-flows at list — no discount required.
- Meets the 1% rule at list price ($2k rent vs $90k).
- Cap rate 14.4% vs local median 3.8% in Lexington-Fayette — top-decile yield for the area; either an underpriced asset or a hidden risk that comps aren't pricing in. Stress-test before assuming the spread holds.
Location & tenants
- Location reads: area grade B — affects rentability + tenant quality, not the cash-flow math above.
- Jessamine County (town): math 31% / reading 45% proficiency, ranked #37 of 165 in KY (top 22%) — families likely to look elsewhere, expect single-tenant / working-renter base with shorter leases.
- Zoned schools: Hattie C. Warner Elementary School (math 28% / reading 42%, grade F, #298 of 676 statewide, top 44%, 528 students, 54% FRL); East Jessamine Middle School (math 23% / reading 44%, grade F, #105 of 217 statewide, top 51%, 936 students, 56% FRL).
- Market conditions: Rents rising fast (+7.5%/yr); 496 active listings in the ZIP; 267 units permitted in Jessamine County in 2024 (9 in 5+ unit buildings).
Forward outlook
- Local home prices are declining (-3.0%/yr); year-one equity from $622 of loan paydown is wiped out by about $3k of value loss. Plan a longer hold.
- Jessamine County population projected at +22% by 2050 — long-run rental-demand tailwind backs the buy-and-hold thesis.
- At projected returns (-3.0% appreciation + 7.5% rent growth), your $25k cash investment doubles in ~4 years — after that, you're playing with house money.
Negotiation context
- Only 3 days on market — expect competitive offers; lowballing is unlikely to land.
Questions for the listing agent
- Have any recent inspections been done? Can we get a copy of the seller's disclosures and any deferred-maintenance estimates?
- Is there a deadline driving the sale (1031 exchange, divorce, estate, relocation)? That informs how much negotiation room exists.
- What's the average days-on-market for RENTAL listings here right now (not sales)? A rising rental-DOM trend means longer vacancies and softer asking-rent achievability than the comps imply.
- What's the recent tenant-quality profile in this submarket — average credit score on applications, eviction rate, late-payment / NSF rate, and stable-employment percentage? A property-management company in the area should have these aggregated.
- How much new for-sale + rental construction is in the pipeline within 1–3 miles? Heavy new supply typically softens prices + rents 12–24 months out; constrained supply supports both.
Investment metrics
- 1% rule
- 1.73% ✓
- Cap rate
- 14.42%
- Cash-on-cash
- 29.03%
- DSCR
- 2.29
- GRM
- 4.8
CMA / ARV
- ARV (on-the-fly)
- $252,400
- Comps found
- 1
Show comp detail 1 sale within ~0.75 mi
| Address | Dist | Beds/Ba | Sqft | Sold | Price | $/sf | Match |
|---|---|---|---|---|---|---|---|
| 3300 Union Mill Rd | 0.30mi | 3/1.0 (+1) | 1,374 (+9%) | 15mo | $275,000 | $200 | 52 |
Match score weights: distance 35% · size 25% · config 20% · recency 20%. Top-matched comps best support the ARV.
Projected returns pro-forma
-3.0% appreciation · 7.5% rent growth · sell at horizon
- IRR
- 28.4%
- Equity multiple
- 2.26×
- Total profit
- $31,649
- Equity at exit
- $13,419
- IRR
- 38.4%
- Equity multiple
- 5.40×
- Total profit
- $110,887
- Equity at exit
- $7,782
Cash invested: $25,200 (down + closing). Projections, not guarantees.
Landlord ↔ Tenant lean methodology
- Overall (STATE)
- 83 Strongly Landlord-Friendly
- State Kentucky
- 83 Strongly Landlord-Friendly · R+16
- County
- — inherits STATE
- City
- — inherits STATE
ZIP-level market 40356
- Home prices YoY
- -18.6%
- Rents YoY
- 7.5%
- Active inventory
- 496
- Price-to-rent
- 4.8×
Monthly cashflow live
- Estimated rent
- $1,559 medium interval (Pro) →
- Mortgage (P&I)
- −$472
- Tax est. 1.5%
- −$112 /mo · $1,350/yr
- Insurance
- −$38
- HOA
- −$0
- Vacancy / Maint / Mgmt
- −$327
- Net cashflow
- $610
Break-even live
UW: 25.0% down · 7.5% · 30yr · 1.5% tax · 5.0% vac · 8.0% maint · 8.0% mgmt
Financing live
Cash to close
- Down payment
- $22,500
- Closing costs
- $2,700
- Reserves months
- —
- Total cash needed
- —
Loan-product check · same deal, 3 products live
Conventional
25% down · 7.5% · 30yr
- Down + closing
- —
- Monthly P&I
- —
- Monthly cashflow
- —
- DSCR
- —
- Eligible?
- —
Personal DTI + credit; lowest rate.
DSCR
20% down · 8.5% · 30yr
- Down + closing
- —
- Monthly P&I
- —
- Monthly cashflow
- —
- DSCR
- —
- Eligible?
- —
No personal income docs; deal must DSCR.
Hard money
10% down · 12.0% · 12mo
- Down + closing
- —
- Monthly P&I
- —
- Monthly cashflow
- —
- DSCR
- —
- Eligible?
- —
Short-term bridge; refi at stabilization.
Listing history 4 events
-
2026-06-18days on market $90,000 Active 3 DOM
-
2026-06-17days on market $90,000 Active 2 DOM
-
2026-06-16remarks 699-char remark
-
2026-06-16$90,000 Active 1 DOM
ⓘ Source: listings_history table (triggers on properties + properties_extension) + one-shot
backfill from property_details.listing_events for pre-trigger history.
Climate risk First Street
- Flood 1/10 Low FEMA zone X (unshaded) · 0% chance over 30 yrs
- Wildfire 4/10 Moderate
- Heat 4/10 Moderate 7 d/yr ≥102°F today · 19 d/yr by 30 yrs out
- Wind 3/10 Moderate 5% chance of damaging wind over 30 yrs
- Air quality 1/10 Low 0 unhealthy d/yr today · 0 by 30 yrs out
Nearby sold comps map
Loading sold comps map…
Walkable amenities ~0.75 mi
Loading nearby amenities…
Taxation est. · year 1
- Rental income
- $18,708
- − Mortgage interest
- −$5,041
- − Property taxes
- −$1,350
- − Insurance
- −$450
- − Repairs & maintenance
- −$1,497
- − Management
- −$1,497
- − Depreciation
- −$2,618
- Taxable income
- $6,256
- Est. tax owed @ 24.0%
- −$1,501
- After-tax cash flow
- $5,815/yr
For passive investors: Depreciation is non-cash, so a rental often shows a tax loss while cash-flowing — sheltering income. Rental losses are passive: they offset passive income freely, and up to $25,000/yr can offset ordinary (W-2) income if you actively participate and your MAGI is under $100k (phasing out to $0 by $150k); unused losses carry forward. On sale, claimed depreciation is recaptured at up to 25%, and gains may owe capital-gains tax (a 1031 exchange can defer both). Figures are a year-1 estimate at your 24.0% rate — not tax advice; consult a CPA.
Condition & rehab AI · 12 photos
This home requires moderate repairs and organization to improve its condition and value. It has potential for both resale and rental.
Repairs flagged
- Minor Kitchen cabinets — Cabinets appear slightly worn
- Minor Bathroom fixtures — Fixtures appear slightly worn
- Minor Flooring — Flooring is cluttered with items
Value-add opportunities
- Both Paint interior walls — Fresh paint can improve the home's appearance and value
- Both Clean and organize kitchen and bathroom — A clean and organized space enhances the home's appeal
- Both Replace flooring — New flooring can significantly improve the home's appearance and value
Renovation cost estimate screening
| Repair item | Severity | Est. cost |
|---|---|---|
| Kitchen cabinets · Cabinets appear slightly worn | Minor | $500–3,000 |
| Bathroom fixtures · Fixtures appear slightly worn | Minor | $500–3,000 |
| Flooring · Flooring is cluttered with items | Minor | $500–3,000 |
| Total estimated repair cost · 3 items | $1,500–9,000 |
Value-add ROI direction
- Both Paint interior walls — Fresh paint can improve the home's appearance and value ↑
- Both Clean and organize kitchen and bathroom — A clean and organized space enhances the home's appeal ↑
- Both Replace flooring — New flooring can significantly improve the home's appearance and value ↑
ⓘ Cost ranges are severity-bucket heuristics (US national rule-of-thumb). Get contractor quotes + a written scope before underwriting a rehab budget.
Schools (NCES district)
- District
- Jessamine County
- NCES district ID
- 2103030
- Math proficiency
- 31% ▼ -14.00%
- Reading proficiency
- 45% ▼ -12.00%
- Median HH income
- $50,249
- Composite
- 32.81/100
- National rank
- #5623
- State rank
- #37 of 165 in KY
Livability — Lexington-Fayette
No livability data for this city. (Only ~50 U.S. cities are tracked.)
Census & demographics
- County
- Jessamine County · 45,849 people
- City population
- 321,882
- Metro
- Lexington-Fayette, KY
- Population (ZIP)
- 45,849
- Household income
- $74,495
- Rent vs Own
- Severe rent burden
- 1186.0
Population outlook (Jessamine County) Hauer SSP2
- Today (2025)
- 58,419 people
- By 2030
- 61,468 · +5.2%
- By 2040
- 66,952 · +14.6%
- By 2050
- 71,357 · +22.1%
- By 2075
- 80,325 · +37.5%
- By 2100
- 83,848 · +43.5%
Race, ethnicity, and origin ACS 2023
- Neighborhood character
- Predominantly White (86%)
- Race & ethnicity
- White 86% Hispanic / Latino 5% Two or more races 5% Black 4% Asian 2%
- Common ancestry
- Italian 2% Subsaharan African 2% Slovak 2%
- Foreign-born
- 4% · Canada
- Languages at home
- 93% English-only · Spanish 4% Russian/Polish/Slavic 2% Other Asian/Pacific 1%
Political lean MEDSL · Jessamine
- 2024 margin
- Solid R (+35.9) · D 31.2% · R 67.0% · Other 1.8%
- 2008→2024 swing
- +1.1pp toward D · 2008: -37.0pp · 2024: -35.9pp
- All cycles
- 2024: R+35.9 2020: R+32.5 2016: R+40.0 2012: R+39.9 2008: R+37.0
Not yet ingested
- Civics
- —
Market trends
- HPI YoY
- ▼ -61.88%
- Current HPI
- 270.2432
- Rent YoY
- ▲ 7.50%
- Metro
- Lexington-Fayette, KY
- State GDP YoY
- ▲ 1.81%
- F500 in state
- 4
Industry mix (Fortune 500 HQ in KY)
| Industry | F500 HQs | Revenue |
|---|---|---|
| Healthcare | 1 | $118B |
|
||
| Food / Beverage | 1 | $7B |
|
||
Price history
1 event — show timeline
- 2026-06-15 Listed $90,000 ImagineMLS
Cash-flow waterfall
monthlySold comps — $/sqft
last 12 mo · ≤1 miLoading sold comps…