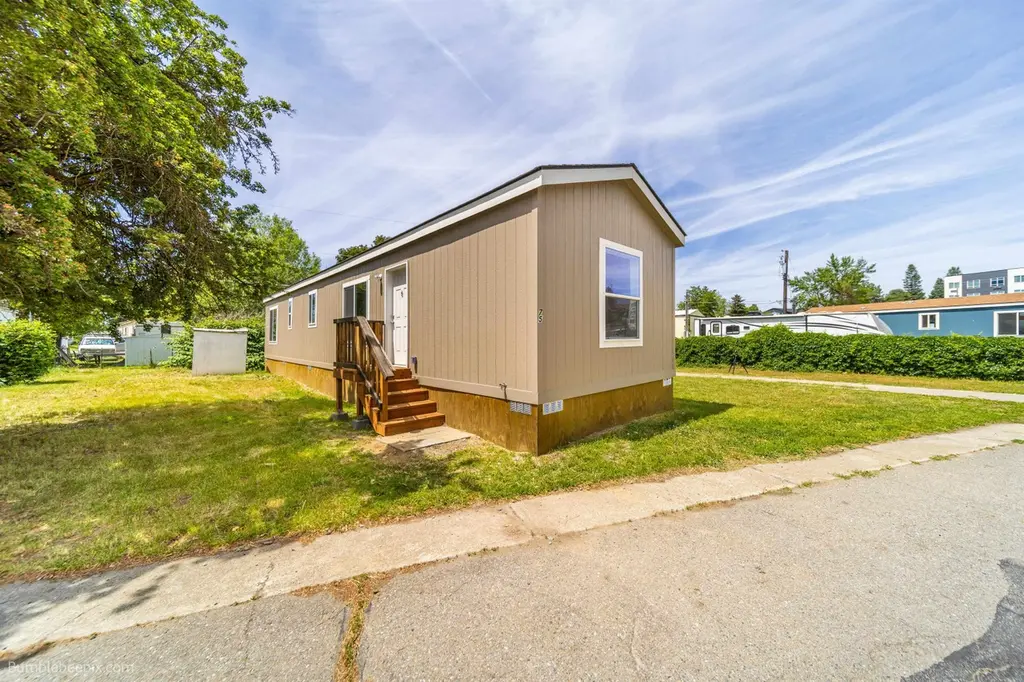
11920 E Mansfield Ave #75 · Spokane Valley, WA
Flood risk 5/10 · Moderate
- FEMA flood zone
- X (unshaded)
- Chance of flooding over 30 yrs
- 0.24%
- Est. flood insurance / yr
- $507 – $1,088
Fire risk 6/10 · Moderate
- Est. fire insurance / yr
- $604 – $1,122
Heat risk 3/10 · Minor
- Hot days now (above 94°F)
- 7 days/yr
- Hot days in 30 yrs
- 15 days/yr
Wind risk 1/10 · Minimal
- Chance of severe wind over 30 yrs
- —
Air-quality risk 9/10 · Severe
- Unhealthy air days now
- 14 days/yr
- Unhealthy air days in 30 yrs
- 15 days/yr
Risk factors via First Street. Map © Google.
Why this score? — see what drove the B- grade
The composite is a weighted blend of 9 inputs, each scored 0–100. Each bar is that input's sub-score; the figure is the points it added to the 100-point composite (weight × sub-score).
- Cash flow +30.0/30.0
- 1% rule +10.0/10.0
- DSCR +10.0/10.0
- Schools +4.3/10.0
- Livability +4.2/5.0
- Condition / age +4.0/5.0
- Rent growth +3.1/5.0
- ARV discount +0.0/15.0
- Appreciation +0.0/10.0
$90,040
🖨 Deal sheet 📄 Offer letter ✓ Due diligence
Listing remarks MLS
Welcome to your brand new 2 bed 1 bath manufactured home nestled within Pinecroft Mobile Home Park, located in the heart of Spokane Valley. This affordable living option allows you to enjoy access to a range of amenities just steps from your front door. From shopping and dining to parks and recreational facilities, everything you need is close by, making daily life convenient and enjoyable. This home offers a 1 year warranty giving you peace of mind while you settle in. 3 MONTHS LOT RENT FREE. Schedule your showing today!
Key facts
- Built 2023
- Listed 198 days
Neighborhood map
What this means for you Summary
Snapshot
- This is a 2-bed/1.0-bath manufactured listed at $90k. Condition is rated good.
Deal economics
- At list price, monthly cash flow is $519 ($6k/yr) — positive.
- The deal already cash-flows at list — no discount required.
- Meets the 1% rule at list price ($1k rent vs $90k).
- Recommended offer: $79k (12.0% below list) — sets the bar for market timing.
- Cap rate 13.2% vs local median 3.0% in Spokane Valley — top-decile yield for the area; either an underpriced asset or a hidden risk that comps aren't pricing in. Stress-test before assuming the spread holds.
Location & tenants
- Location reads 85/100 on livability (#31 in WA, #512 nationally) — a professional / high-income tenant draw. Strengths: amenities A+, commute A+, housing A+; Watch: crime D+.
- East Valley School District (Spokane) (urban): math 40% / reading 56% proficiency, ranked #160 of 291 in WA (top 55%) — families likely to look elsewhere, expect single-tenant / working-renter base with shorter leases.
- Market conditions: Rents rising (+2.4%/yr); 303 active listings in the ZIP; 40 comparable units currently listed for rent nearby; rentals at typical pace (median 21d on market — plan ~3-4 weeks tenant-placement turnaround); 42% of comp listings sitting > 30 days — soft ceiling on asking rent; solid renter incomes; 3,608 units permitted in Spokane County in 2024 (1,792 in 5+ unit buildings).
Forward outlook
- Local home prices are declining (-3.0%/yr); year-one equity from $623 of loan paydown is wiped out by about $3k of value loss. Plan a longer hold.
- Spokane County population projected at +13% by 2050 — modest demand growth; plan on rents tracking national, not racing it.
- At projected returns (-3.0% appreciation + 2.4% rent growth), your $25k cash investment doubles in ~6 years — after that, you're playing with house money.
Negotiation context
- It's been on market 198 days — a 12% lower offer ($79k) is reasonable based on typical stale-listing flexibility.
- 6 sale attempts since 2y ago with the ask held roughly flat each time — persistent listings suggest the price (not the market) is what's stuck; bring a comps-based counter.
Risks & watch-outs
- Climate carrying-cost: moderate flood risk; major wildfire risk — expect insurance premiums to compound above CPI over the hold.
Questions for the listing agent
- It's been on market 198 days. Have you received any prior offers? Is the seller open to a 12% concession, seller financing, or rate buy-down credit?
- Why hasn't it sold? Are there any deal-killer items the seller is aware of (foundation, flood, title, zoning, code violations)?
- Is there a deadline driving the sale (1031 exchange, divorce, estate, relocation)? That informs how much negotiation room exists.
- Schools are B-rated — typically a magnet for longer-tenancy family renters. What's the average tenant stay here, and is there a school-zone premium baked into asking?
- Crime grade is D in this area — have there been break-ins, vandalism, or insurance claims at this property in the last 3 years? What carrier currently insures it and at what premium?
- What's the average days-on-market for RENTAL listings here right now (not sales)? A rising rental-DOM trend means longer vacancies and softer asking-rent achievability than the comps imply.
- What's the recent tenant-quality profile in this submarket — average credit score on applications, eviction rate, late-payment / NSF rate, and stable-employment percentage? A property-management company in the area should have these aggregated.
- How much new for-sale + rental construction is in the pipeline within 1–3 miles? Heavy new supply typically softens prices + rents 12–24 months out; constrained supply supports both.
Investment metrics
- 1% rule
- 1.52% ✓
- Cap rate
- 13.21%
- Cash-on-cash
- 24.71%
- DSCR
- 2.10
- GRM
- 5.5
CMA / ARV
- ARV (median comp)
- $65,000
- List price
- $90,040
- Delta
- 38.52%
- Verdict
- OVERPRICED
- Comps
- 5 within 1.0 mi
Show comp detail 4 sales within ~0.75 mi
| Address | Dist | Beds/Ba | Sqft | Sold | Price | $/sf | Match |
|---|---|---|---|---|---|---|---|
| 11920 E Mansfield Ave #111 | 0.09mi | 2/1.0 | 784 (-3%) | 2mo | $65,000 | $83 | 89 |
| 11920 E Mansfield Ave #71 | 0.00mi | 2/1.0 | 792 (-2%) | 22mo | $90,000 | $114 | 78 |
| 11920 E Mansfield Ave #72 | 0.00mi | 2/1.0 | 792 (-2%) | 22mo | $90,000 | $114 | 78 |
| 11920 E Mansfield Ave #109 | 0.00mi | 2/2.0 | 924 (+14%) | 0mo | $45,000 | $49 | 73 |
Match score weights: distance 35% · size 25% · config 20% · recency 20%. Top-matched comps best support the ARV.
Projected returns pro-forma
-3.0% appreciation · 2.44% rent growth · sell at horizon
- IRR
- 17.5%
- Equity multiple
- 1.70×
- Total profit
- $17,685
- Equity at exit
- $13,425
- IRR
- 25.6%
- Equity multiple
- 3.17×
- Total profit
- $54,790
- Equity at exit
- $7,785
Cash invested: $25,211 (down + closing). Projections, not guarantees.
Landlord ↔ Tenant lean methodology
- Overall (STATE)
- 28 Tenant-Leaning
- State Washington
- 28 Tenant-Leaning · D+8
- County
- — inherits STATE
- City
- — inherits STATE
ZIP-level market 99206
- Rents YoY
- 2.4%
- Active inventory
- 303
- Price-to-rent
- 5.5×
Monthly cashflow live
- Estimated rent
- $1,370 high interval (Pro) →
- Mortgage (P&I)
- −$472
- Tax from tax record
- −$54 /mo · $645/yr
- Insurance
- −$38
- HOA
- −$0
- Vacancy / Maint / Mgmt
- −$288
- Net cashflow
- $519
Break-even live
UW: 25.0% down · 7.5% · 30yr · 1.5% tax · 5.0% vac · 8.0% maint · 8.0% mgmt
Financing live
Cash to close
- Down payment
- $22,510
- Closing costs
- $2,701
- Reserves months
- —
- Total cash needed
- —
Loan-product check · same deal, 3 products live
Conventional
25% down · 7.5% · 30yr
- Down + closing
- —
- Monthly P&I
- —
- Monthly cashflow
- —
- DSCR
- —
- Eligible?
- —
Personal DTI + credit; lowest rate.
DSCR
20% down · 8.5% · 30yr
- Down + closing
- —
- Monthly P&I
- —
- Monthly cashflow
- —
- DSCR
- —
- Eligible?
- —
No personal income docs; deal must DSCR.
Hard money
10% down · 12.0% · 12mo
- Down + closing
- —
- Monthly P&I
- —
- Monthly cashflow
- —
- DSCR
- —
- Eligible?
- —
Short-term bridge; refi at stabilization.
Rent comps 40 comps
| Address | Beds | Baths | Sqft | Rent | $/sqft | DOM | Units | Dist |
|---|---|---|---|---|---|---|---|---|
| 11921 E Mansfield Ave Spokane Valley, WA | 2.0 | 1.0–2.0 | 890 | $1,375 | $1.54 | 13d | 5 | 0.07mi |
| 11901 E Mansfield Ave Spokane Valley, WA | 1.0 | 1.0 | 574 | $1,350 | $2.35 | 43d | 1 | 0.11mi |
| 2605 N Robie Rd Spokane Valley, WA | 2.0–3.0 | 2.0 | 1136 | $1,052 | $0.93 | 43d | 1 | 0.23mi |
| 2405 Cherry St Apt 6 Spokane Valley, WA | 2.0 | 1.0 | 750 | $1,375 | $1.83 | 21d | 1 | 0.24mi |
| 2405 N Cherry St Spokane Valley, WA | 1.0–2.0 | 1.0–2.0 | 836 | $1,450 | $1.73 | 13d | 4 | 0.24mi |
| 12422 E Mansfield Ave Spokane Valley, WA | 2.0 | 1.0 | 786 | $1,330 | $1.69 | 13d | 5 | 0.28mi |
| 12423 E Mansfield Ave Spokane Valley, WA | 1.0–2.0 | 1.0–2.0 | 823 | $1,535 | $1.87 | 13d | 9 | 0.28mi |
| 2301 N Wilbur Rd Spokane Valley, WA | 1.0–2.0 | 1.0–2.0 | 837 | $1,450 | $1.73 | 43d | 4 | 0.30mi |
| 2107 N Houk Rd #7 Spokane Valley, WA | 2.0 | 1.5 | 932 | $1,400 | $1.50 | 43d | 1 | 0.31mi |
| 1723 N Union Rd Spokane Valley, WA | 1.0–2.0 | 1.0–2.0 | 818 | $1,505 | $1.84 | 13d | 5 | 0.31mi |
| 2115 N Houk Rd Unit C-03 Spokane Valley, WA | 2.0 | 1.0 | 800 | $1,275 | $1.59 | 43d | 1 | 0.32mi |
| 2115 N Houk Rd Spokane Valley, WA | 2.0 | 1.0 | 760 | $1,272 | $1.67 | 13d | 2 | 0.32mi |
| 2111 N Houk Rd Spokane Valley, WA | 2.0 | 1.5 | 932 | $1,345 | $1.44 | 43d | 1 | 0.33mi |
| 2612 N Pines Rd Unit 37 Spokane Valley, WA | 2.0 | 2.0 | 966 | $1,325 | $1.37 | 13d | 1 | 0.34mi |
| 2612 N Pines Rd Unit 12 Spokane Valley, WA | 2.0 | 1.0 | 914 | $1,225 | $1.34 | 43d | 1 | 0.35mi |
| 2705 N Pines Rd Unit 03 Spokane Valley, WA | 2.0 | 1.0 | 840 | $1,245 | $1.48 | 43d | 1 | 0.36mi |
| 2705 N Pines Rd Spokane Valley, WA | 2.0 | 1.0 | 840 | $1,165 | $1.39 | 43d | 1 | 0.36mi |
| 2212 N Houk Rd Unit 2210 Spokane Valley, WA | 2.0 | 1.0 | 950 | $1,195 | $1.26 | 43d | 1 | 0.37mi |
| 2212 N Houk Rd Spokane Valley, WA | 2.0 | 1.0 | 950 | $1,295 | $1.36 | 13d | 1 | 0.37mi |
| 2212 N Houk Rd Unit 4 Spokane Valley, WA | 2.0 | 1.0 | 950 | $1,395 | $1.47 | 23d | 1 | 0.37mi |
| 12820 E Mansfield Ave Apt 50 Spokane Valley, WA | 1.0 | 1.0 | 689 | $1,165 | $1.69 | 13d | 1 | 0.38mi |
| 12820 E Mansfield Ave Apt 96 Spokane Valley, WA | 2.0 | 2.0 | 956 | $1,425 | $1.49 | 13d | 1 | 0.38mi |
| 12820 E Mansfield Ave Unit 115 Spokane Valley, WA | 2.0 | 1.0 | 857 | $1,275 | $1.49 | 43d | 1 | 0.38mi |
| 12820 E Mansfield Ave Apt 148 Spokane Valley, WA | 2.0 | 1.0 | 918 | $1,350 | $1.47 | 13d | 1 | 0.38mi |
| 2721 N Cherry St Spokane Valley, WA | 2.0–3.0 | 2.0 | 1152 | $990 | $0.86 | 13d | 1 | 0.38mi |
| 2718 N Bowdish Rd Spokane Valley, WA | 2.0 | 1.0 | 844 | $1,200 | $1.42 | 13d | 4 | 0.42mi |
| 12202 E Maxwell Ave Spokane Valley, WA | 2.0 | 2.0 | 1010 | $1,444 | $1.43 | 13d | 3 | 0.49mi |
| 2820 N Cherry St Spokane Valley, WA | 2.0–3.0 | 1.0–2.0 | 963 | $1,417 | $1.47 | 13d | 4 | 0.49mi |
| 12820 E Mansfield Ave Unit 101 Spokane Valley, WA | 2.0 | 1.0 | 857 | $1,350 | $1.58 | 43d | 1 | 0.50mi |
| 12925 E Mansfield Ave Spokane Valley, WA | 1.0–3.0 | 1.0–2.0 | 897 | $1,492 | $1.66 | 13d | 33 | 0.59mi |
| 11813 E Broadway Ave Spokane Valley, WA | 3.0 | 1.0–2.0 | 918 | $1,616 | $1.76 | 13d | 26 | 0.80mi |
| 13303 E Mission Ave Spokane Valley, WA | 1.0–3.0 | 1.0–2.0 | 974 | $1,638 | $1.68 | 13d | 14 | 0.85mi |
| 12623 E Broadway Ave Spokane Valley, WA | 1.0–3.0 | 1.0–2.0 | 952 | $1,530 | $1.61 | 13d | 9 | 0.88mi |
| 13310 E Mission Ave Unit 73 Spokane Valley, WA | 1.0 | 1.0 | 660 | $1,010 | $1.53 | 43d | 1 | 0.89mi |
| 13310 E Mission Ave Apt 156 Spokane Valley, WA | 2.0 | 1.0 | 902 | $1,150 | $1.27 | 43d | 1 | 0.91mi |
| 13310 E Mission Ave Unit 44 Spokane Valley, WA | 2.0 | 1.0 | 902 | $1,110 | $1.23 | 43d | 1 | 0.91mi |
| 13310 E Mission Ave Apt 30 Spokane Valley, WA | 2.0 | 1.0 | 902 | $1,165 | $1.29 | 43d | 1 | 0.91mi |
| 13310 E Mission Ave Unit 187 Spokane Valley, WA | 1.0 | 1.0 | 660 | $1,050 | $1.59 | 43d | 1 | 0.91mi |
| 13320 E Mission Ave Unit 314 Spokane Valley, WA | 1.0 | 1.0 | 660 | $1,010 | $1.53 | 13d | 1 | 0.98mi |
| 13320 E Mission Ave Unit 219 Spokane Valley, WA | 1.0 | 1.0 | 660 | $1,065 | $1.61 | 23d | 1 | 0.98mi |
Listing history 29 events
-
2026-06-18days on market $90,040 Active 198 DOM
-
2026-06-17days on market $90,040 Active 197 DOM
-
2026-06-16days on market $90,040 Active 196 DOM
-
2026-06-15days on market $90,040 Active 195 DOM
-
2026-06-14days on market $90,040 Active 193 DOM
-
2026-06-10days on market $90,040 Active 190 DOM
-
2026-06-09days on market $90,040 Active 189 DOM
-
2026-06-08days on market $90,040 Active 188 DOM
-
2026-06-07days on market $90,040 Active 187 DOM
-
2026-06-05days on market $90,040 Active 184 DOM
-
2026-06-03days on market $90,040 Active 183 DOM
-
2026-06-02days on market $90,040 Active 182 DOM
-
2026-06-01days on market $90,040 Active 181 DOM
-
2026-05-31days on market $90,040 Active 180 DOM
-
2026-05-31days on market $90,040 Active 179 DOM
-
2025-12-02$90,040 Active 527-char remark
Show marketing remark (527 chars)
Welcome to your brand new 2 bed 1 bath manufactured home nestled within Pinecroft Mobile Home Park, located in the heart of Spokane Valley. This affordable living option allows you to enjoy access to a range of amenities just steps from your front door. From shopping and dining to parks and recreational facilities, everything you need is close by, making daily life convenient and enjoyable. This home offers a 1 year warranty giving you peace of mind while you settle in. 3 MONTHS LOT RENT FREE. Schedule your showing today!
-
2025-12-01historical
-
2025-10-17$90,040 Active
-
2025-10-17historical
-
2025-07-22$90,040 Active
-
2025-07-22historical
-
2025-04-16price $90,040
-
2025-01-24price $95,040
-
2024-11-12$94,040 Active
-
2024-11-11historical
-
2024-11-08price $94,040
-
2024-09-13$95,040 Active
-
2024-09-13historical
-
2024-06-14$95,040 Active
ⓘ Source: listings_history table (triggers on properties + properties_extension) + one-shot
backfill from property_details.listing_events for pre-trigger history.
Tax reassessment forecast WA · Resets to sale price
- Current annual tax
- $645 · $54/mo
- Projected year-2 tax
- $882 · $74/mo
- Expected delta
- +$238/yr (+$20/mo · 36.9%)
ⓘ Screening estimate from a state-policy table — verify with the county assessor before closing.
Climate risk First Street
- Flood 5/10 Major FEMA zone X (unshaded) · 24% chance over 30 yrs
- Wildfire 6/10 Major
- Heat 3/10 Moderate 7 d/yr ≥94°F today · 15 d/yr by 30 yrs out
- Wind 1/10 Low
- Air quality 9/10 Extreme 14 unhealthy d/yr today · 15 by 30 yrs out
Nearby sold comps map
Loading sold comps map…
Walkable amenities ~0.75 mi
Loading nearby amenities…
Taxation est. · year 1
- Rental income
- $16,442
- − Mortgage interest
- −$5,044
- − Property taxes
- −$645
- − Insurance
- −$450
- − Repairs & maintenance
- −$1,315
- − Management
- −$1,315
- − Depreciation
- −$2,619
- Taxable income
- $5,054
- Est. tax owed @ 24.0%
- −$1,213
- After-tax cash flow
- $5,016/yr
For passive investors: Depreciation is non-cash, so a rental often shows a tax loss while cash-flowing — sheltering income. Rental losses are passive: they offset passive income freely, and up to $25,000/yr can offset ordinary (W-2) income if you actively participate and your MAGI is under $100k (phasing out to $0 by $150k); unused losses carry forward. On sale, claimed depreciation is recaptured at up to 25%, and gains may owe capital-gains tax (a 1031 exchange can defer both). Figures are a year-1 estimate at your 24.0% rate — not tax advice; consult a CPA.
Condition & rehab AI · 13 photos
This manufactured home is in good condition with minimal repairs needed. Painting the exterior and maintaining the landscaping would significantly increase its resale and rental value.
Value-add opportunities
- Both Paint exterior — Enhances curb appeal and value
- Both Landscaping — Improves curb appeal and value
Renovation cost estimate screening
Value-add ROI direction
- Both Paint exterior — Enhances curb appeal and value ↑
- Both Landscaping — Improves curb appeal and value ↑
ⓘ Cost ranges are severity-bucket heuristics (US national rule-of-thumb). Get contractor quotes + a written scope before underwriting a rehab budget.
Schools (NCES district)
- District
- East Valley School District (Spokane)
- NCES district ID
- 5302280
- Math proficiency
- 40% ▼ -5.00%
- Reading proficiency
- 56% ▼ -4.00%
- Median HH income
- $49,557
- Composite
- 43.15/100
- National rank
- #6603
- State rank
- #160 of 291 in WA
Livability — Spokane Valley
- Score
- 85/100
- State rank
- #31
- US rank
- #512
Category grades
Schools grade is shown separately in the Schools card above.
Census & demographics
- Census place
- Spokane Valley, WA
- County
- Spokane County · 496,401 people
- City population
- 129,511
- Metro
- Spokane-Spokane Valley, WA
- Population (ZIP)
- 41,089
- Household income
- $81,764
- Rent vs Own
- Severe rent burden
- 1523.0
Population outlook (Spokane County) Hauer SSP2
- Today (2025)
- 531,314 people
- By 2030
- 549,278 · +3.4%
- By 2040
- 577,822 · +8.8%
- By 2050
- 598,188 · +12.6%
- By 2075
- 630,744 · +18.7%
- By 2100
- 622,360 · +17.1%
Race, ethnicity, and origin ACS 2023
- Neighborhood character
- Predominantly White (82%)
- Race & ethnicity
- White 82% Two or more races 8% Hispanic / Latino 7% Black 2% Asian 2%
- Hispanic origin (detail)
- Mexican 4%
- Common ancestry
- Portuguese 5% Slovak 3% Lithuanian 3%
- Foreign-born
- 5% · Canada, Vietnam
- Languages at home
- 93% English-only · Spanish 3% Russian/Polish/Slavic 1% Other Asian/Pacific 1%
Political lean MEDSL · Spokane
- 2024 margin
- Toss-up / Even · D 46.0% · R 51.0% · Other 3.0%
- 2008→2024 swing
- -3.8pp toward R · 2008: -1.1pp · 2024: -5.0pp
- All cycles
- 2024: R+5.0 2020: R+4.3 2016: R+8.3 2012: R+6.3 2008: R+1.1
Not yet ingested
- Civics
- —
Market trends
- HPI YoY
- ▼ -377.59%
- Current HPI
- 339.9959
- Rent YoY
- ▲ 2.44%
- Metro
- Spokane-Spokane Valley, WA
- State GDP YoY
- ▲ 4.65%
- F500 in state
- 22
Industry mix (Fortune 500 HQ in WA)
| Industry | F500 HQs | Revenue |
|---|---|---|
| Retail | 2 | $269B |
|
||
| Technology / Retail | 1 | $638B |
|
||
| Technology | 1 | $245B |
|
||
| Telecommunications | 1 | $38B |
|
||
| Food / Beverage | 1 | $36B |
|
||
| Automotive / Trucks | 1 | $34B |
|
||
Price history
-5.3% since first listed14 events — show timeline
- 2025-12-02 Listed $90,040 SPOKANEMLS as Distributed by MLS Grid
- 2025-12-01 Listing Removed — SPOKANEMLS as Distributed by MLS Grid
- 2025-10-17 Listing Removed — SPOKANEMLS as Distributed by MLS Grid
- 2025-10-17 Listed $90,040 SPOKANEMLS as Distributed by MLS Grid
- 2025-07-22 Listing Removed — SPOKANEMLS as Distributed by MLS Grid
- 2025-07-22 Listed $90,040 SPOKANEMLS as Distributed by MLS Grid
- 2025-04-16 Price Changed $90,040 SPOKANEMLS as Distributed by MLS Grid
- 2025-01-24 Price Changed $95,040 SPOKANEMLS as Distributed by MLS Grid
- 2024-11-12 Listed $94,040 SPOKANEMLS as Distributed by MLS Grid
- 2024-11-11 Listing Removed — SPOKANEMLS as Distributed by MLS Grid
- 2024-11-08 Price Changed $94,040 SPOKANEMLS as Distributed by MLS Grid
- 2024-09-13 Listing Removed — SPOKANEMLS as Distributed by MLS Grid
- 2024-09-13 Listed $95,040 SPOKANEMLS as Distributed by MLS Grid
- 2024-06-14 Listed $95,040 SPOKANEMLS as Distributed by MLS Grid
Property tax history
-7.5%/yrLatest (2026): $645 · -7.5% YoY. Source: county tax records.
Cash-flow waterfall
monthlySold comps — $/sqft
last 12 mo · ≤1 miLoading sold comps…