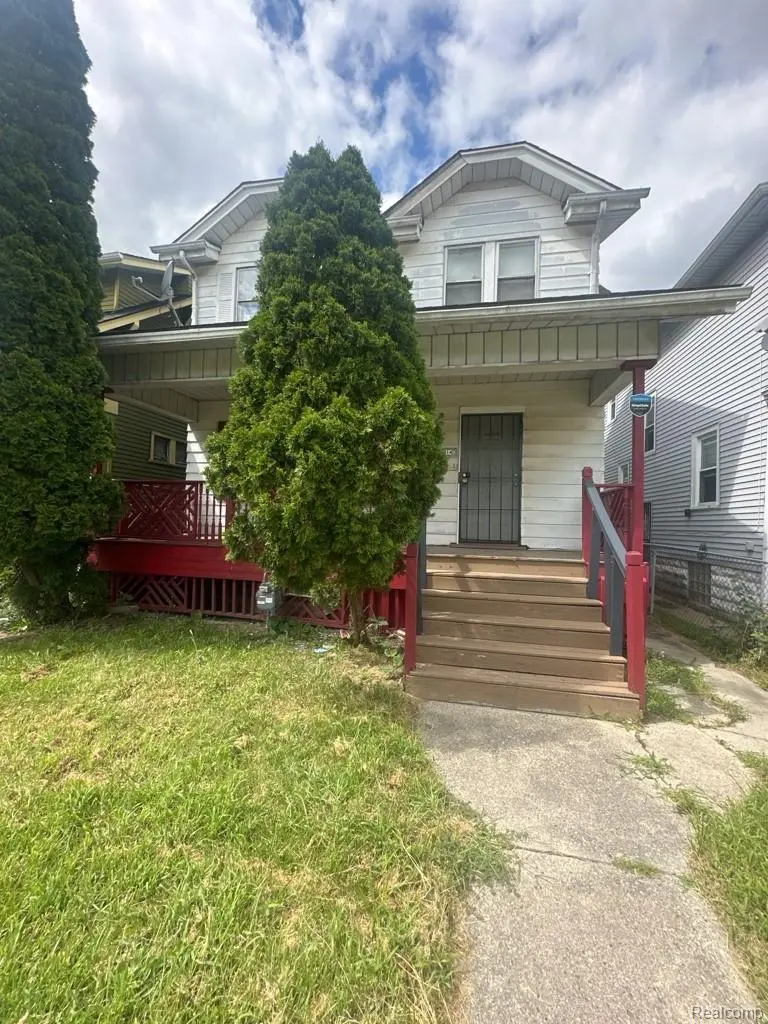
140 Geneva St · Highland Park, MI
Flood risk 3/10 · Minor
- FEMA flood zone
- X (unshaded)
- Chance of flooding over 30 yrs
- 0.2%
- Est. flood insurance / yr
- $473 – $860
Fire risk 1/10 · Minimal
- Est. fire insurance / yr
- $784 – $1,456
Heat risk 2/10 · Minimal
- Hot days now (above 97°F)
- 7 days/yr
- Hot days in 30 yrs
- 14 days/yr
Wind risk 2/10 · Minimal
- Chance of severe wind over 30 yrs
- —
Air-quality risk 4/10 · Minor
- Unhealthy air days now
- 4 days/yr
- Unhealthy air days in 30 yrs
- 6 days/yr
Risk factors via First Street. Map © Google.
Why this score? — see what drove the B+ grade
The composite is a weighted blend of 9 inputs, each scored 0–100. Each bar is that input's sub-score; the figure is the points it added to the 100-point composite (weight × sub-score).
- Cash flow +30.0/30.0
- ARV discount +15.0/15.0
- 1% rule +10.0/10.0
- DSCR +10.0/10.0
- Schools +5.0/10.0
- Livability +3.7/5.0
- Rent growth +2.5/5.0
- Condition / age +2.5/5.0
- Appreciation +0.0/10.0
$87,900
🖨 Deal sheet (PDF) 📄 Offer letter ✓ Due diligence
Listing remarks MLS
TENANT OCCUPIED CAPE CODE/COLONIAL HOME LOCATED JUST SOUTH OF E MCNICHOLS AND WEST OF WOODWARD AVENUE! THIS PROPERTY FEATURES A COVERED FRONT PORCH, INIVITING LIVING ROOM WITH FIREPLACE AND BUILT-INS, FORMAL DINING ROOM, SPACIOUS KITCHEN, BONUS FLEX ROOM ON THE MAIN FLOOR! UPSTAIRS FEATURES THREE GOOD SIZED BEDROOMS AND A FULL BATHROOM. TENANT WISHES TO STAY! RENT IS 1100 PER MONTH. PROPERTY IS SOLD AS-IS. ALL DIMENSIONS ARE ESTIMATED AND SHOULD BE VERIFIED. ALL SHOWINGS REQUIRE A LICENSED AGENT TO BE PRESENT. BUYER TO PAY DETROIT INVESTMENT CO A 295 PROCESSING FEE AT CLOSING.
Key facts
- Covered front porch
- Formal dining room
- Spacious kitchen
Tags
Neighborhood map
What this means for you Summary
Snapshot
- This is a 3-bed/2.0-bath single-family listed at $88k.
Deal economics
- At list price, monthly cash flow is $576 ($7k/yr) — positive.
- The deal already cash-flows at list — no discount required.
- Meets the 1% rule at list price ($1k rent vs $88k).
- Recommended offer: $80k (9.0% below list) — sets the bar for market timing.
Location & tenants
- Location reads 73/100 on livability (#214 in MI) — a middle-class / working-renter tenant base. Strengths: commute A+, cost of living A+, housing A+; Watch: schools F, crime F, employment F.
- Market conditions: 216 active listings in the ZIP; 27 comparable units currently listed for rent nearby; rentals at typical pace (median 25d on market — plan ~3-4 weeks tenant-placement turnaround); 48% of comp listings sitting > 30 days — soft ceiling on asking rent; lower-income renter base — watch delinquency; 2,639 units permitted in Wayne County in 2024 (1,216 in 5+ unit buildings).
- This rent runs 44% of the median local income ($38k/yr) — at the standard rent-burdened threshold; future hikes will face affordability resistance.
Forward outlook
- Local home prices are declining (-3.0%/yr); year-one equity from $608 of loan paydown is wiped out by about $3k of value loss. Plan a longer hold.
- Wayne County population projected at -17% by 2050 — secular population decline; favor cash flow + early exit over multi-decade hold.
- At projected returns (-3.0% appreciation + 3.0% rent growth), your $25k cash investment doubles in ~5 years — after that, you're playing with house money.
Negotiation context
- It's been on market 114 days — a 9% lower offer ($80k) is reasonable based on typical stale-listing flexibility.
- 16 sale attempts since 24y ago with the ask held roughly flat each time — persistent listings suggest the price (not the market) is what's stuck; bring a comps-based counter.
Risks & watch-outs
- Watch-outs: built in 1916 — expect roof / HVAC / electrical / plumbing capex.
Questions for the listing agent
- It's been on market 114 days. Have you received any prior offers? Is the seller open to a 9% concession, seller financing, or rate buy-down credit?
- Built in 1916 — when were the roof, HVAC, electrical panel, plumbing, and water heater last replaced?
- Why hasn't it sold? Are there any deal-killer items the seller is aware of (foundation, flood, title, zoning, code violations)?
- Is there a deadline driving the sale (1031 exchange, divorce, estate, relocation)? That informs how much negotiation room exists.
- Schools are F-rated, which usually means shorter tenancies and higher turnover. Who's the typical renter profile here, and what's been the actual vacancy rate?
- Crime grade is F in this area — have there been break-ins, vandalism, or insurance claims at this property in the last 3 years? What carrier currently insures it and at what premium?
- What's the average days-on-market for RENTAL listings here right now (not sales)? A rising rental-DOM trend means longer vacancies and softer asking-rent achievability than the comps imply.
- What's the recent tenant-quality profile in this submarket — average credit score on applications, eviction rate, late-payment / NSF rate, and stable-employment percentage? A property-management company in the area should have these aggregated.
- How much new for-sale + rental construction is in the pipeline within 1–3 miles? Heavy new supply typically softens prices + rents 12–24 months out; constrained supply supports both.
Investment metrics
- 1% rule
- 1.59% ✓
- Cap rate
- 14.16%
- Cash-on-cash
- 28.08%
- DSCR
- 2.25
- GRM
- 5.3
CMA / ARV
- ARV (median comp)
- $105,975
- List price
- $87,900
- Delta
- -17.06%
- Verdict
- UNDERPRICED
- Comps
- 20 within 1.0 mi
Show comp detail 12 sales within ~0.75 mi
| Address | Dist | Beds/Ba | Sqft | Sold | Price | $/sf | Match |
|---|---|---|---|---|---|---|---|
| 220 Moss St | 0.29mi | 3/1.5 | 1,379 (-5%) | 12mo | $186,000 | $135 | 66 |
| 44 Grove St | 0.09mi | 3/1.0 | 1,646 (+13%) | 10mo | $8,000 | $5 | 62 |
| 241 Moss St | 0.34mi | 3/1.0 | 1,300 (-11%) | 3mo | $172,500 | $133 | 60 |
| 16177 Inverness St | 0.74mi | 3/1.0 | 1,404 (-4%) | 4mo | $70,000 | $50 | 53 |
| 116 Church St | 0.56mi | 3/1.5 | 1,400 (-4%) | 15mo | $106,500 | $76 | 53 |
| 83 Midland St | 0.47mi | 3/1.5 | 1,664 (+14%) | 1mo | $150,000 | $90 | 52 |
| 225 Moss St | 0.32mi | 3/1.5 | 1,654 (+14%) | 14mo | $65,000 | $39 | 49 |
| 361 Pilgrim St | 0.56mi | 2/1.0 (-1) | 1,368 (-6%) | 10mo | $8,000 | $6 | 47 |
| 156 Hill St | 0.47mi | 3/1.5 | 1,639 (+13%) | 11mo | $154,000 | $94 | 46 |
| 16570 Inverness St | 0.66mi | 4/2.0 (+1) | 1,300 (-11%) | 3mo | $120,000 | $92 | 44 |
| 16189 Inverness St | 0.73mi | 3/1.5 | 1,578 (+8%) | 18mo | $160,000 | $101 | 35 |
| 574 W Greendale | 0.75mi | 4/2.0 (+1) | 1,672 (+15%) | 4mo | $135,000 | $81 | 32 |
Match score weights: distance 35% · size 25% · config 20% · recency 20%. Top-matched comps best support the ARV.
Projected returns pro-forma
-3.0% appreciation · 3.0% rent growth · sell at horizon
- IRR
- 22.2%
- Equity multiple
- 1.91×
- Total profit
- $22,410
- Equity at exit
- $13,106
- IRR
- 30.2%
- Equity multiple
- 3.71×
- Total profit
- $66,630
- Equity at exit
- $7,600
Cash invested: $24,612 (down + closing). Projections, not guarantees.
Landlord ↔ Tenant lean methodology
- Overall (STATE)
- 62 Landlord-Friendly
- State Michigan
- 62 Landlord-Friendly · EVEN
- County
- — inherits STATE
- City
- — inherits STATE
ZIP-level market 48203
- Home prices YoY
- -23.3%
- Active inventory
- 216
- Price-to-rent
- 5.3×
Monthly cashflow live
- Estimated rent
- $1,395 high interval (Pro) →
- Mortgage (P&I)
- −$461
- Tax from tax record
- −$28 /mo · $339/yr
- Insurance
- −$37
- HOA
- −$0
- Vacancy / Maint / Mgmt
- −$293
- Net cashflow
- $576
Break-even live
Sensitivity live
| Price | -10% $626 | -5% $601 | +0% $576 | +5% $551 | +10% $526 |
|---|---|---|---|---|---|
| Rent | -10% $466 | -5% $521 | +0% $576 | +5% $631 | +10% $686 |
| Rate | -1.0pp $620 | -0.5pp $598 | base $576 | +0.5pp $553 | +1.0pp $530 |
UW: 25.0% down · 7.5% · 30yr · 1.5% tax · 5.0% vac · 8.0% maint · 8.0% mgmt
Financing live
Cash to close
- Down payment
- $21,975
- Closing costs
- $2,637
- Reserves months
- —
- Total cash needed
- —
Loan-product check · same deal, 3 products live
Conventional
25% down · 7.5% · 30yr
- Down + closing
- —
- Monthly P&I
- —
- Monthly cashflow
- —
- DSCR
- —
- Eligible?
- —
Personal DTI + credit; lowest rate.
DSCR
20% down · 8.5% · 30yr
- Down + closing
- —
- Monthly P&I
- —
- Monthly cashflow
- —
- DSCR
- —
- Eligible?
- —
No personal income docs; deal must DSCR.
Hard money
10% down · 12.0% · 12mo
- Down + closing
- —
- Monthly P&I
- —
- Monthly cashflow
- —
- DSCR
- —
- Eligible?
- —
Short-term bridge; refi at stabilization.
Rent comps 27 comps
| Address | Beds | Baths | Sqft | Rent | $/sqft | DOM | Units | Dist |
|---|---|---|---|---|---|---|---|---|
| 17550 2nd Ave Detroit, MI | 2.0 | 1.0 | 1350 | $1,150 | $0.85 | 18d | 1 | 0.27mi |
| 326 Eason St Highland Park, MI | 3.0 | 1.0 | 1256 | $1,300 | $1.04 | 18d | 1 | 0.38mi |
| 885 Covington Dr Unit 201 Highland Park, MI | 2.0 | 2.0 | 1350 | $1,695 | $1.26 | 44d | 1 | 0.43mi |
| 101 Stevens St Highland Park, MI | 3.0 | 1.5 | 1152 | $1,600 | $1.39 | 18d | 1 | 0.49mi |
| 17666 Manderson Rd Unit 17666 Detroit, MI | 2.0 | 1.0 | 1200 | $1,595 | $1.33 | 44d | 1 | 0.55mi |
| 17670 Manderson Rd Unit 17670 Detroit, MI | 2.0 | 1.0 | 1199 | $1,595 | $1.33 | 44d | 1 | 0.55mi |
| 1029 Covington Dr Unit 1029 Detroit, MI | 2.0 | 1.0 | 1200 | $1,495 | $1.25 | 44d | 1 | 0.55mi |
| 1031 Covington Dr Unit 1061 Detroit, MI | 2.0 | 1.0 | 1200 | $1,595 | $1.33 | 44d | 1 | 0.56mi |
| 17765 Manderson Rd Unit 14 Highland Park, MI | 2.0 | 1.0 | 1000 | $1,175 | $1.18 | 44d | 1 | 0.63mi |
| 17765 Manderson Rd Unit 8 Highland Park, MI | 2.0 | 1.0 | 1000 | $1,215 | $1.22 | 2d | 1 | 0.63mi |
| 16927 Inverness St Detroit, MI | 2.0 | 1.0 | 897 | $1,650 | $1.84 | 17d | 1 | 0.69mi |
| 242 Ferris St Highland Park, MI | 3.0 | 1.0 | 1192 | $1,275 | $1.07 | 0d | 1 | 0.82mi |
| 2521 W McNichols Rd Unit B2 Detroit, MI | 2.0 | 1.0 | 1300 | $1,250 | $0.96 | 44d | 1 | 0.84mi |
| 574 W Golden Gate Highland Park, MI | 3.0 | 1.0 | 1315 | $1,300 | $0.99 | 44d | 1 | 0.91mi |
| 406 W Goldengate St Detroit, MI | 2.0 | 1.0 | 1050 | $1,100 | $1.05 | 44d | 1 | 0.91mi |
| 404 W Golden Gate Highland Park, MI | 2.0 | 1.0 | 1050 | $1,100 | $1.05 | 44d | 1 | 0.92mi |
| 16174 Princeton St Detroit, MI | 2.0 | 1.0 | 985 | $1,100 | $1.12 | 20d | 1 | 1.01mi |
| 16174 Princeton St Unit 2 Detroit, MI | 2.0 | 1.0 | 985 | $1,100 | $1.12 | 44d | 1 | 1.01mi |
| 27 Pasadena St Highland Park, MI | 2.0 | 1.0 | 900 | $825 | $0.92 | 44d | 1 | 1.02mi |
| 15906 Alden St Detroit, MI | 3.0 | 1.0 | 1030 | $1,150 | $1.12 | 17d | 1 | 1.14mi |
| 16834 Fairfield St Detroit, MI | 2.0 | 1.0 | 1516 | $1,363 | $0.90 | 25d | 1 | 1.28mi |
| 1926 Clements St Unit 1926 Detroit, MI | 3.0 | 1.0 | 1150 | $1,250 | $1.09 | 20d | 1 | 1.33mi |
| 1926 Clements St Detroit, MI | 3.0 | 1.0 | 1150 | $1,150 | $1.00 | 5d | 1 | 1.33mi |
| 168 Beresford St Highland Park, MI | 4.0 | 1.0 | 1541 | $1,475 | $0.96 | 18d | 1 | 1.33mi |
| 15345 Parkside St Detroit, MI | 3.0 | 1.0 | 1152 | $1,300 | $1.13 | 44d | 1 | 1.40mi |
| 64 Glendale St Highland Park, MI | 4.0 | 1.0 | 1464 | $1,500 | $1.02 | 10d | 1 | 1.40mi |
| 18503 Riopelle St Highland Park, MI | 3.0 | 1.0 | 1254 | $1,250 | $1.00 | 5d | 1 | 1.47mi |
Listing history 50 events
-
2026-06-18days on market $87,900 Active 114 DOM
-
2026-06-17days on market $87,900 Active 113 DOM
-
2026-06-16days on market $87,900 Active 112 DOM
-
2026-06-15days on market $87,900 Active 111 DOM
-
2026-06-13days on market $87,900 Active 109 DOM
-
2026-06-09days on market $87,900 Active 105 DOM
-
2026-06-08days on market $87,900 Active 104 DOM
-
2026-06-07days on market $87,900 Active 103 DOM
-
2026-06-04days on market $87,900 Active 100 DOM
-
2026-06-03days on market $87,900 Active 99 DOM
-
2026-06-02days on market $87,900 Active 98 DOM
-
2026-06-01days on market $87,900 Active 97 DOM
-
2026-05-31days on market $87,900 Active 96 DOM
-
2026-04-02price $87,900 583-char remark
Show marketing remark (583 chars)
TENANT OCCUPIED CAPE CODE/COLONIAL HOME LOCATED JUST SOUTH OF E MCNICHOLS AND WEST OF WOODWARD AVENUE! THIS PROPERTY FEATURES A COVERED FRONT PORCH, INIVITING LIVING ROOM WITH FIREPLACE AND BUILT-INS, FORMAL DINING ROOM, SPACIOUS KITCHEN, BONUS FLEX ROOM ON THE MAIN FLOOR! UPSTAIRS FEATURES THREE GOOD SIZED BEDROOMS AND A FULL BATHROOM. TENANT WISHES TO STAY! RENT IS 1100 PER MONTH. PROPERTY IS SOLD AS-IS. ALL DIMENSIONS ARE ESTIMATED AND SHOULD BE VERIFIED. ALL SHOWINGS REQUIRE A LICENSED AGENT TO BE PRESENT. BUYER TO PAY DETROIT INVESTMENT CO A 295 PROCESSING FEE AT CLOSING.
-
2026-02-24$89,900 Active 583-char remark
Show marketing remark (583 chars)
TENANT OCCUPIED CAPE CODE/COLONIAL HOME LOCATED JUST SOUTH OF E MCNICHOLS AND WEST OF WOODWARD AVENUE! THIS PROPERTY FEATURES A COVERED FRONT PORCH, INIVITING LIVING ROOM WITH FIREPLACE AND BUILT-INS, FORMAL DINING ROOM, SPACIOUS KITCHEN, BONUS FLEX ROOM ON THE MAIN FLOOR! UPSTAIRS FEATURES THREE GOOD SIZED BEDROOMS AND A FULL BATHROOM. TENANT WISHES TO STAY! RENT IS 1100 PER MONTH. PROPERTY IS SOLD AS-IS. ALL DIMENSIONS ARE ESTIMATED AND SHOULD BE VERIFIED. ALL SHOWINGS REQUIRE A LICENSED AGENT TO BE PRESENT. BUYER TO PAY DETROIT INVESTMENT CO A 295 PROCESSING FEE AT CLOSING.
-
2026-01-21historical
-
2026-01-20historical
-
2025-12-16price $89,900
-
2025-12-15price $89,900
-
2025-12-15price $89,900
-
2025-09-02$71,900 Active
-
2025-09-02$71,900 Active
-
2025-01-14historical
-
2025-01-14historical
-
2024-10-14$72,000 Active
-
2024-10-14$72,000 Active
-
2024-07-29historical
-
2024-07-29historical
-
2024-05-31price $72,900
-
2024-05-31price $72,900
-
2024-05-03price $73,900
-
2024-05-02price $73,900
-
2024-04-19$74,900 Active
-
2024-04-19$74,900 Active
-
2024-03-05status Pending
-
2024-03-05status Pending
-
2024-03-05historical
-
2024-03-05historical
-
2024-02-23price $74,900
-
2024-02-22price $74,900
-
2024-01-05$75,900 Active
-
2024-01-05$75,900 Active
-
2023-06-12historical
-
2023-06-12historical
-
2023-02-09$99,000 Active
-
2023-02-09historical
-
2023-02-09historical
-
2022-10-27$99,000 Active
ⓘ Source: listings_history table (triggers on properties + properties_extension) + one-shot
backfill from property_details.listing_events for pre-trigger history.
Tax reassessment forecast MI · Partial reset (capped growth)
- Current annual tax
- $339 · $28/mo
- Projected year-2 tax
- $846 · $71/mo
- Expected delta
- +$507/yr (+$42/mo · 149.7%)
ⓘ Screening estimate from a state-policy table — verify with the county assessor before closing.
Climate risk First Street
- Flood 3/10 Moderate FEMA zone X (unshaded) · 20% chance over 30 yrs
- Wildfire 1/10 Low
- Heat 2/10 Low 7 d/yr ≥97°F today · 14 d/yr by 30 yrs out
- Wind 2/10 Low
- Air quality 4/10 Moderate 4 unhealthy d/yr today · 6 by 30 yrs out
Nearby sold comps map
Loading sold comps map…
Walkable amenities ~0.75 mi
Loading nearby amenities…
Taxation est. · year 1
- Rental income
- $16,736
- − Mortgage interest
- −$4,924
- − Property taxes
- −$339
- − Insurance
- −$440
- − Repairs & maintenance
- −$1,339
- − Management
- −$1,339
- − Depreciation
- −$2,557
- Taxable income
- $5,799
- Est. tax owed @ 24.0%
- −$1,392
- After-tax cash flow
- $5,520/yr
For passive investors: Depreciation is non-cash, so a rental often shows a tax loss while cash-flowing — sheltering income. Rental losses are passive: they offset passive income freely, and up to $25,000/yr can offset ordinary (W-2) income if you actively participate and your MAGI is under $100k (phasing out to $0 by $150k); unused losses carry forward. On sale, claimed depreciation is recaptured at up to 25%, and gains may owe capital-gains tax (a 1031 exchange can defer both). Figures are a year-1 estimate at your 24.0% rate — not tax advice; consult a CPA.
Schools (NCES district)
No district data.
Livability — Highland Park
- Score
- 73/100
- State rank
- #214
- US rank
- #5271
Category grades
Schools grade is shown separately in the Schools card above.
Census & demographics
- Census place
- Highland Park, MI
- County
- Wayne County · 1,562,939 people
- Metro
- Detroit-Warren-Dearborn, MI
- Population (ZIP)
- 20,049
- Household income
- $38,404
- Rent vs Own
- Severe rent burden
- 1192.0
Population outlook (Wayne County) Hauer SSP2
- Today (2025)
- 1,675,273 people
- By 2030
- 1,620,300 · -3.3%
- By 2040
- 1,502,341 · -10.3%
- By 2050
- 1,384,039 · -17.4%
- By 2075
- 1,124,592 · -32.9%
- By 2100
- 881,193 · -47.4%
Race, ethnicity, and origin ACS 2023
- Neighborhood character
- Predominantly Black (85%)
- Race & ethnicity
- Black 85% White 8% Two or more races 5% Hispanic / Latino 2%
- Common ancestry
- Lithuanian 1%
- Foreign-born
- 2% · Canada
- Languages at home
- 95% English-only · Spanish 3% French/Haitian/Cajun 1%
Political lean MEDSL · Wayne
- 2024 margin
- Strong D (+29.0) · D 62.7% · R 33.7% · Other 3.6%
- 2008→2024 swing
- -20.5pp toward R · 2008: 49.5pp · 2024: 29.0pp
- All cycles
- 2024: D+29.0 2020: D+38.1 2016: D+37.3 2012: D+46.9 2008: D+49.5
Not yet ingested
- Civics
- —
Market trends
- HPI YoY
- ▼ -90.13%
- Current HPI
- 297.0176
- Rent YoY
- —
- Metro
- Detroit-Warren-Dearborn, MI
- State GDP YoY
- ▲ 1.37%
- F500 in state
- 28
Industry mix (Fortune 500 HQ in MI)
| Industry | F500 HQs | Revenue |
|---|---|---|
| Automotive Parts | 3 | $48B |
|
||
| Automotive | 2 | $372B |
|
||
| Chemicals | 1 | $45B |
|
||
| Automotive Retail | 1 | $29B |
|
||
| Healthcare / Medical Devices | 1 | $23B |
|
||
| Automotive Technology | 1 | $20B |
|
||
Price history
+341.7% since first listed46 events — show timeline
- 2026-04-02 Price Changed $87,900 MiRealSource-MiMLS
- 2026-04-02 Price Changed $87,900 REALCOMP
- 2026-02-24 Listed $89,900 REALCOMP
- 2026-02-24 Listed $89,900 MiRealSource-MiMLS
- 2026-01-21 Listing Removed — MiRealSource-MiMLS
- 2026-01-20 Listing Removed — REALCOMP
- 2025-12-16 Price Changed $89,900 MiRealSource-MiMLS
- 2025-12-15 Price Changed $89,900 REALCOMP
- 2025-12-15 Price Changed $89,900 SW Michigan MLS
- 2025-09-02 Listed $71,900 REALCOMP
- 2025-09-02 Listed $71,900 MiRealSource-MiMLS
- 2025-01-14 Listing Removed — REALCOMP
- 2025-01-14 Listing Removed — MiRealSource-MiMLS
- 2024-10-14 Listed $72,000 MiRealSource-MiMLS
- 2024-10-14 Listed $72,000 REALCOMP
- 2024-07-29 Listing Removed — REALCOMP
- 2024-07-29 Listing Removed — MiRealSource-MiMLS
- 2024-05-31 Price Changed $72,900 MiRealSource-MiMLS
- 2024-05-31 Price Changed $72,900 REALCOMP
- 2024-05-03 Price Changed $73,900 MiRealSource-MiMLS
- 2024-05-02 Price Changed $73,900 REALCOMP
- 2024-04-19 Listed $74,900 MiRealSource-MiMLS
- 2024-04-19 Listed $74,900 REALCOMP
- 2024-03-05 Pending — MiRealSource-MiMLS
- 2024-03-05 Pending — REALCOMP
- 2024-03-05 Listing Removed — MiRealSource-MiMLS
- 2024-03-05 Listing Removed — REALCOMP
- 2024-02-23 Price Changed $74,900 MiRealSource-MiMLS
- 2024-02-22 Price Changed $74,900 REALCOMP
- 2024-01-05 Listed $75,900 MiRealSource-MiMLS
- 2024-01-05 Listed $75,900 REALCOMP
- 2023-06-12 Listing Removed — MiRealSource-MiMLS
- 2023-06-12 Listing Removed — REALCOMP
- 2023-02-09 Listing Removed — MiRealSource-MiMLS
- 2023-02-09 Listing Removed — REALCOMP
- 2023-02-09 Listed $99,000 REALCOMP
- 2022-10-27 Listed $99,000 MiRealSource-MiMLS
- 2022-10-27 Listed $99,000 MiRealSource-MiMLS
- 2022-10-27 Listed $99,000 REALCOMP
- 2019-01-24 Sold (Public Records) $80,000 Public Records
- 2006-06-22 Sold (Public Records) $65,000 Public Records
- 2003-01-16 Sold (MLS) $18,000 MiRealSource-MiMLS
- 2003-01-16 Sold (MLS) $18,000 REALCOMP
- 2002-12-19 Listing Removed — MiRealSource-MiMLS
- 2002-08-06 Listed $19,900 MiRealSource-MiMLS
- 2002-08-06 Listed $19,900 REALCOMP
Property tax history
-13.5%/yrLatest (2025): $339 · -18.5% YoY. Source: county tax records.
Cash-flow waterfall
monthlySold comps — $/sqft
last 12 mo · ≤1 miLoading sold comps…