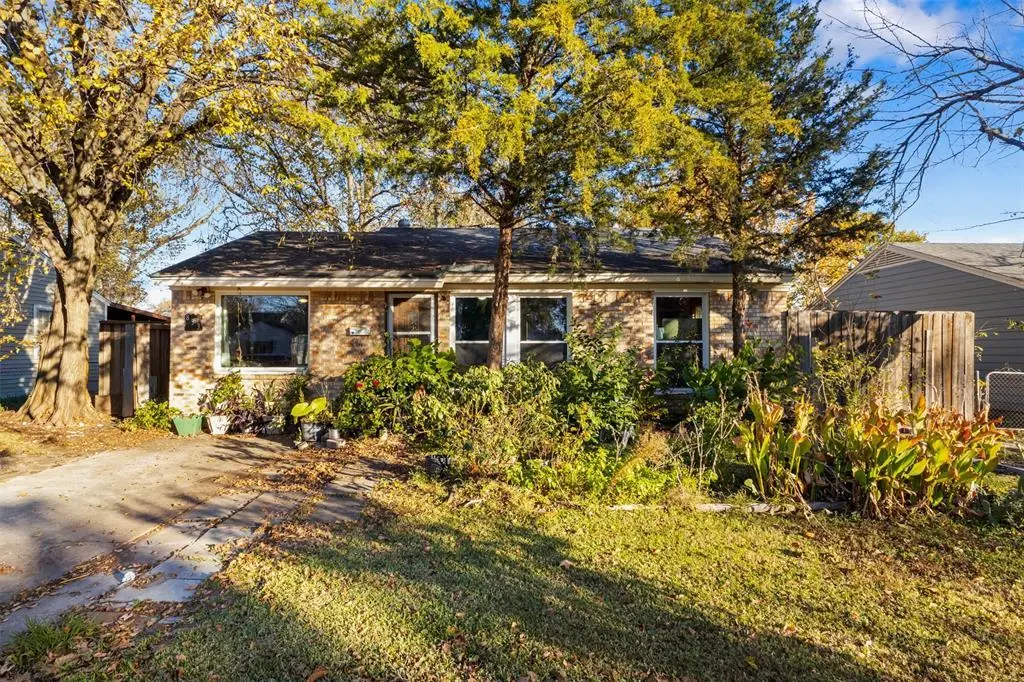
833 Dent St · Garland, TX
Flood risk 1/10 · Minimal
- FEMA flood zone
- X (unshaded)
- Chance of flooding over 30 yrs
- 0.0%
- Est. flood insurance / yr
- $507 – $1,088
Fire risk 1/10 · Minimal
- Est. fire insurance / yr
- $1,222 – $2,270
Heat risk 7/10 · Major
- Hot days now (above 109°F)
- 7 days/yr
- Hot days in 30 yrs
- 22 days/yr
Wind risk 6/10 · Moderate
- Chance of severe wind over 30 yrs
- 27.0%
Air-quality risk 2/10 · Minimal
- Unhealthy air days now
- 2 days/yr
- Unhealthy air days in 30 yrs
- 2 days/yr
Risk factors via First Street. Map © Google.
Why this score? — see what drove the C- grade
The composite is a weighted blend of 9 inputs, each scored 0–100. Each bar is that input's sub-score; the figure is the points it added to the 100-point composite (weight × sub-score).
- ARV discount +15.0/15.0
- Cash flow +14.6/30.0
- 1% rule +5.5/10.0
- DSCR +4.5/10.0
- Livability +3.7/5.0
- Schools +2.9/10.0
- Rent growth +2.6/5.0
- Condition / age +2.5/5.0
- Appreciation +0.0/10.0
$175,000
🖨 Deal sheet 📄 Offer letter ✓ Due diligence
Listing remarks MLS
Investor Special with Strong Upside in Garland! This 3-bedroom, 1-bath single-family home presents an excellent opportunity for investors or value-focused buyers seeking a solid rental or light renovation project. Offering approximately 1,048 square feet, the property features a functional floor plan that maximizes space and allows for efficient updates. Well-suited for a buy-and-hold rental, flip, or portfolio addition, this property is located in an established Garland neighborhood with steady rental demand and convenient access to schools, shopping, and major commuter routes.
Key facts
- Convenient access
- 8,407 sq ft lot
- Built 1950
Tags
Neighborhood map
What this means for you Summary
Snapshot
- This is a 2-bed/1.0-bath single-family listed at $175k.
Deal economics
- At list price, monthly cash flow is $42 ($508/yr) — positive.
- The deal already cash-flows at list — no discount required.
- Meets the 1% rule at list price ($2k rent vs $175k).
- Recommended offer: $154k (12.0% below list) — sets the bar for market timing.
- Cap rate 6.6% vs local median 3.5% in Garland — top-decile yield for the area; either an underpriced asset or a hidden risk that comps aren't pricing in. Stress-test before assuming the spread holds.
Location & tenants
- Location reads 74/100 on livability (#165 in TX, #4,447 nationally) — a middle-class / working-renter tenant base. Strengths: commute A+, housing A+, cost of living A-; Watch: amenities C-, schools D+, health & safety F.
- Garland ISD (suburban): math 27% / reading 37% proficiency, ranked #553 of 826 in TX (top 67%) — families likely to look elsewhere, expect single-tenant / working-renter base with shorter leases.
- Market conditions: Rents flat; 230 active listings in the ZIP; 30 comparable units currently listed for rent nearby; rentals at typical pace (median 14d on market — plan ~3-4 weeks tenant-placement turnaround); 12,577 units permitted in Dallas County in 2024 (6,829 in 5+ unit buildings).
Forward outlook
- Local home prices are declining (-3.0%/yr); year-one equity from $1k of loan paydown is wiped out by about $5k of value loss. Plan a longer hold.
- Dallas County population projected at +35% by 2050 — long-run rental-demand tailwind backs the buy-and-hold thesis.
Negotiation context
- It's been on market 164 days — a 12% lower offer ($154k) is reasonable based on typical stale-listing flexibility.
Risks & watch-outs
- Watch-outs: property tax is 2.9% of price; built in 1950 — expect roof / HVAC / electrical / plumbing capex.
- Climate carrying-cost: major wind risk, 27% chance of damaging wind over 30y; extreme-heat days projected 7→22/yr by 2055 (HVAC capex compounding) — expect insurance premiums to compound above CPI over the hold.
Questions for the listing agent
- It's been on market 164 days. Have you received any prior offers? Is the seller open to a 12% concession, seller financing, or rate buy-down credit?
- Built in 1950 — when were the roof, HVAC, electrical panel, plumbing, and water heater last replaced?
- Property tax is high relative to price — has the assessment been appealed recently, and will the sale trigger a re-assessment?
- Why hasn't it sold? Are there any deal-killer items the seller is aware of (foundation, flood, title, zoning, code violations)?
- Is there a deadline driving the sale (1031 exchange, divorce, estate, relocation)? That informs how much negotiation room exists.
- Schools are D-rated, which usually means shorter tenancies and higher turnover. Who's the typical renter profile here, and what's been the actual vacancy rate?
- What's the average days-on-market for RENTAL listings here right now (not sales)? A rising rental-DOM trend means longer vacancies and softer asking-rent achievability than the comps imply.
- What's the recent tenant-quality profile in this submarket — average credit score on applications, eviction rate, late-payment / NSF rate, and stable-employment percentage? A property-management company in the area should have these aggregated.
- How much new for-sale + rental construction is in the pipeline within 1–3 miles? Heavy new supply typically softens prices + rents 12–24 months out; constrained supply supports both.
Investment metrics
- 1% rule
- 1.05% ✓
- Cap rate
- 6.58%
- Cash-on-cash
- 1.04%
- DSCR
- 1.05
- GRM
- 7.9
CMA / ARV
- ARV (median comp)
- $230,484
- List price
- $175,000
- Delta
- -24.07%
- Verdict
- UNDERPRICED
- Comps
- 20 within 1.0 mi
Show comp detail 12 sales within ~0.75 mi
| Address | Dist | Beds/Ba | Sqft | Sold | Price | $/sf | Match |
|---|---|---|---|---|---|---|---|
| 853 Nash St | 0.09mi | 3/1.0 (+1) | 1,108 (+6%) | 3mo | $225,000 | $203 | 79 |
| 720 Lena Ct | 0.42mi | 2/1.0 | 1,119 (+7%) | 1mo | $240,000 | $214 | 69 |
| 1209 Sylvan Dr | 0.25mi | 3/1.0 (+1) | 1,104 (+5%) | 8mo | $229,000 | $207 | 68 |
| 1444 Nash St | 0.54mi | 2/1.0 | 1,004 (-4%) | 0mo | $199,900 | $199 | 68 |
| 801 Woodland Dr | 0.32mi | 3/1.0 (+1) | 1,010 (-4%) | 8mo | $215,000 | $213 | 67 |
| 801 Holly Dr | 0.11mi | 3/2.0 (+1) | 1,182 (+13%) | 2mo | $230,000 | $195 | 63 |
| 808 Magnolia Dr | 0.28mi | 3/1.0 (+1) | 1,170 (+12%) | 1mo | $179,000 | $153 | 62 |
| 1452 Nash St | 0.56mi | 3/1.0 (+1) | 1,080 (+3%) | 6mo | $219,900 | $204 | 58 |
| 712 Camilla Ln | 0.49mi | 2/1.0 | 1,119 (+7%) | 14mo | $220,000 | $197 | 54 |
| 1502 Rahall St | 0.45mi | 3/2.0 (+1) | 1,119 (+7%) | 8mo | $233,000 | $208 | 53 |
| 1452 Lakewood Dr | 0.67mi | 2/1.0 | 925 (-12%) | 3mo | $175,000 | $189 | 46 |
| 1449 W Walnut St | 0.67mi | 3/2.0 (+1) | 1,076 (+3%) | 12mo | $269,999 | $251 | 45 |
Match score weights: distance 35% · size 25% · config 20% · recency 20%. Top-matched comps best support the ARV.
Projected returns pro-forma
-3.0% appreciation · 0.43% rent growth · sell at horizon
- IRR
- -18.0%
- Equity multiple
- 0.38×
- Total profit
- $-30,153
- Equity at exit
- $26,093
- IRR
- -17.2%
- Equity multiple
- 0.18×
- Total profit
- $-40,268
- Equity at exit
- $15,131
Cash invested: $49,000 (down + closing). Projections, not guarantees.
Landlord ↔ Tenant lean methodology
- Overall (STATE)
- 87 Strongly Landlord-Friendly
- State Texas
- 87 Strongly Landlord-Friendly · R+5
- County
- — inherits STATE
- City
- — inherits STATE
ZIP-level market 75040
- Rents YoY
- 0.4%
- Active inventory
- 230
- Price-to-rent
- 7.9×
Monthly cashflow live
- Estimated rent
- $1,842 high interval (Pro) →
- Mortgage (P&I)
- −$918
- Tax from tax record
- −$423 /mo · $5,070/yr
- Insurance
- −$73
- HOA
- −$0
- Vacancy / Maint / Mgmt
- −$387
- Net cashflow
- $42
Break-even live
UW: 25.0% down · 7.5% · 30yr · 1.5% tax · 5.0% vac · 8.0% maint · 8.0% mgmt
Financing live
Cash to close
- Down payment
- $43,750
- Closing costs
- $5,250
- Reserves months
- —
- Total cash needed
- —
Loan-product check · same deal, 3 products live
Conventional
25% down · 7.5% · 30yr
- Down + closing
- —
- Monthly P&I
- —
- Monthly cashflow
- —
- DSCR
- —
- Eligible?
- —
Personal DTI + credit; lowest rate.
DSCR
20% down · 8.5% · 30yr
- Down + closing
- —
- Monthly P&I
- —
- Monthly cashflow
- —
- DSCR
- —
- Eligible?
- —
No personal income docs; deal must DSCR.
Hard money
10% down · 12.0% · 12mo
- Down + closing
- —
- Monthly P&I
- —
- Monthly cashflow
- —
- DSCR
- —
- Eligible?
- —
Short-term bridge; refi at stabilization.
Rent comps 30 comps
| Address | Beds | Baths | Sqft | Rent | $/sqft | DOM | Units | Dist |
|---|---|---|---|---|---|---|---|---|
| 821 Travis St Garland, TX | 3.0 | 1.0 | 1158 | $1,875 | $1.62 | 43d | 1 | 0.16mi |
| 625 Camilla Ln Garland, TX | 3.0 | 2.0 | 1273 | $2,300 | $1.81 | 4d | 1 | 0.51mi |
| 2005 Glencrest Ln Garland, TX | 3.0 | 2.0 | 1473 | $2,400 | $1.63 | 43d | 1 | 0.70mi |
| 2013 Victoria Dr Garland, TX | 3.0 | 2.0 | 1159 | $1,900 | $1.64 | 15d | 1 | 0.78mi |
| 2013 Victoria Dr Garland, TX | 3.0 | 2.0 | 1159 | $1,900 | $1.64 | 4d | 1 | 0.78mi |
| 217 S Garland Ave Garland, TX | 1.0–2.0 | 1.0–2.0 | 1084 | $2,440 | $2.25 | 7d | 15 | 0.86mi |
| 502 Moonlight Dr Garland, TX | 3.0 | 2.0 | 1496 | $1,900 | $1.27 | 12d | 1 | 0.94mi |
| 324 Rita Dr Garland, TX | 2.0 | 1.5 | 1037 | $1,400 | $1.35 | 43d | 1 | 0.96mi |
| 1812 Frances Dr Garland, TX | 2.0 | 1.5 | 1224 | $1,650 | $1.35 | 43d | 1 | 0.97mi |
| 1812 Frances Dr Unit 1810 Garland, TX | 2.0 | 1.5 | 1224 | $1,575 | $1.29 | 7d | 1 | 0.97mi |
| 1812 Frances Dr Unit 1812 Garland, TX | 2.0 | 1.5 | 1224 | $1,700 | $1.39 | 43d | 1 | 0.97mi |
| 501 Rosewood Hills Dr Garland, TX | 3.0 | 1.5 | 1304 | $1,850 | $1.42 | 19d | 1 | 0.98mi |
| 1240 W Avenue D Garland, TX | 2.0 | 1.0 | 800 | $1,500 | $1.88 | 2d | 3 | 0.99mi |
| 2007 Santa Anna Dr Garland, TX | 3.0 | 2.0 | 1390 | $1,850 | $1.33 | 24d | 1 | 1.00mi |
| 1227 W Avenue E Garland, TX | 3.0 | 1.0 | 1284 | $1,950 | $1.52 | 43d | 1 | 1.01mi |
| 2039 W Walnut St Unit C Garland, TX | 2.0 | 1.5 | 1200 | $1,400 | $1.17 | 14d | 1 | 1.03mi |
| 2039 W Walnut St Garland, TX | 2.0 | 2.0 | 1200 | $1,400 | $1.17 | 7d | 1 | 1.03mi |
| 510 Sunset Dr Garland, TX | 3.0 | 2.0 | 1265 | $1,800 | $1.42 | 4d | 1 | 1.05mi |
| 202 Belt Line Rd Garland, TX | 2.0 | 2.0 | 987 | $1,570 | $1.59 | 3d | 10 | 1.06mi |
| 617 Rosewood Hills Dr Garland, TX | 3.0 | 2.0 | 1272 | $1,800 | $1.42 | 24d | 1 | 1.08mi |
| 618 Pleasant Valley Rd Garland, TX | 3.0 | 2.0 | 1003 | $2,095 | $2.09 | 43d | 1 | 1.10mi |
| 613 Dawn Dr Garland, TX | 3.0 | 2.0 | 1026 | $2,200 | $2.14 | 4d | 1 | 1.16mi |
| 312 Cole St Garland, TX | 2.0 | 1.0 | 1004 | $1,695 | $1.69 | 24d | 1 | 1.22mi |
| 822 Milky Way Garland, TX | 3.0 | 2.0 | 1141 | $2,100 | $1.84 | 7d | 1 | 1.25mi |
| 1009 Foxe Basin Dr Garland, TX | 3.0 | 1.5 | 1019 | $1,850 | $1.82 | 2d | 1 | 1.34mi |
| 2735 N Garland Ave Garland, TX | 2.0 | 2.0–2.5 | 1363 | $1,791 | $1.31 | 2d | 6 | 1.42mi |
| 1425 Cedarcrest Dr Garland, TX | 2.0 | 1.0 | 1064 | $1,650 | $1.55 | 24d | 1 | 1.46mi |
| 1406 Yukon Dr Garland, TX | 2.0 | 1.5 | 950 | $1,395 | $1.47 | 43d | 1 | 1.46mi |
| 2502 Lakewood Dr Garland, TX | 3.0 | 1.0 | 1405 | $1,800 | $1.28 | 7d | 1 | 1.46mi |
| 2046 N Shiloh Rd Garland, TX | 1.0–2.0 | 1.0 | 684 | $1,495 | $2.19 | 2d | 8 | 1.49mi |
Listing history 15 events
-
2026-06-18days on market $175,000 Active 164 DOM
-
2026-06-17days on market $175,000 Active 163 DOM
-
2026-06-16days on market $175,000 Active 162 DOM
-
2026-06-15days on market $175,000 Active 161 DOM
-
2026-06-13days on market $175,000 Active 159 DOM
-
2026-06-09days on market $175,000 Active 155 DOM
-
2026-06-08days on market $175,000 Active 154 DOM
-
2026-06-07days on market $175,000 Active 153 DOM
-
2026-06-04days on market $175,000 Active 150 DOM
-
2026-06-03days on market $175,000 Active 149 DOM
-
2026-06-02days on market $175,000 Active 148 DOM
-
2026-06-01days on market $175,000 Active 147 DOM
-
2026-05-31days on market $175,000 Active 146 DOM
-
2026-01-05$175,000 Active 587-char remark
Show marketing remark (587 chars)
Investor Special with Strong Upside in Garland! This 3-bedroom, 1-bath single-family home presents an excellent opportunity for investors or value-focused buyers seeking a solid rental or light renovation project. Offering approximately 1,048 square feet, the property features a functional floor plan that maximizes space and allows for efficient updates. Well-suited for a buy-and-hold rental, flip, or portfolio addition, this property is located in an established Garland neighborhood with steady rental demand and convenient access to schools, shopping, and major commuter routes.
-
2002-04-05soldstatus
ⓘ Source: listings_history table (triggers on properties + properties_extension) + one-shot
backfill from property_details.listing_events for pre-trigger history.
Tax reassessment forecast TX · Resets to sale price
- Current annual tax
- $5,070 · $423/mo
- Projected year-2 tax
- $5,070 · $423/mo
- Expected delta
- $0/yr ($0/mo · 0.0%)
ⓘ Screening estimate from a state-policy table — verify with the county assessor before closing.
Climate risk First Street
- Flood 1/10 Low FEMA zone X (unshaded) · 0% chance over 30 yrs
- Wildfire 1/10 Low
- Heat 7/10 Severe 7 d/yr ≥109°F today · 22 d/yr by 30 yrs out
- Wind 6/10 Major 27% chance of damaging wind over 30 yrs
- Air quality 2/10 Low 2 unhealthy d/yr today · 2 by 30 yrs out
Nearby sold comps map
Loading sold comps map…
Walkable amenities ~0.75 mi
Loading nearby amenities…
Taxation est. · year 1
- Rental income
- $22,109
- − Mortgage interest
- −$9,803
- − Property taxes
- −$5,070
- − Insurance
- −$875
- − Repairs & maintenance
- −$1,769
- − Management
- −$1,769
- − Depreciation
- −$5,091
- Taxable loss
- −$2,268
- Est. tax savings @ 24.0%
- +$544
- After-tax cash flow
- $1,052/yr
For passive investors: Depreciation is non-cash, so a rental often shows a tax loss while cash-flowing — sheltering income. Rental losses are passive: they offset passive income freely, and up to $25,000/yr can offset ordinary (W-2) income if you actively participate and your MAGI is under $100k (phasing out to $0 by $150k); unused losses carry forward. On sale, claimed depreciation is recaptured at up to 25%, and gains may owe capital-gains tax (a 1031 exchange can defer both). Figures are a year-1 estimate at your 24.0% rate — not tax advice; consult a CPA.
Schools (NCES district)
- District
- Garland ISD
- NCES district ID
- 4820340
- Math proficiency
- 27% ▼ -23.00%
- Reading proficiency
- 37% ▼ -10.00%
- Median HH income
- $58,392
- Composite
- 28.63/100
- National rank
- #6706
- State rank
- #553 of 826 in TX
Livability — Garland
- Score
- 74/100
- State rank
- #165
- US rank
- #4447
Category grades
Schools grade is shown separately in the Schools card above.
Census & demographics
- Census place
- Garland, TX
- County
- Dallas County · 2,612,404 people
- City population
- 246,342
- Metro
- Dallas-Fort Worth-Arlington, TX
- Population (ZIP)
- 64,606
- Household income
- $74,519
- Rent vs Own
- Severe rent burden
- 1746.0
Population outlook (Dallas County) Hauer SSP2
- Today (2025)
- 2,979,839 people
- By 2030
- 3,191,823 · +7.1%
- By 2040
- 3,619,611 · +21.5%
- By 2050
- 4,026,915 · +35.1%
- By 2075
- 4,957,073 · +66.4%
- By 2100
- 5,508,725 · +84.9%
Race, ethnicity, and origin ACS 2023
- Neighborhood character
- Diverse neighborhood (Simpson 0.69)
- Race & ethnicity
- Hispanic / Latino 48% Two or more races 29% White 21% Black 15% Asian 11%
- Hispanic origin (detail)
- Mexican 38% Puerto Rican 1%
- Common ancestry
- Lithuanian 1% Romanian 1%
- Foreign-born
- 33% · Canada, Vietnam, China
- Languages at home
- 45% English-only · Spanish 40% Vietnamese 7% Other Indo-European 1%
Political lean MEDSL · Dallas
- 2024 margin
- Strong D (+22.2) · D 60.2% · R 38.0% · Other 1.8%
- 2008→2024 swing
- +6.9pp toward D · 2008: 15.3pp · 2024: 22.2pp
- All cycles
- 2024: D+22.2 2020: D+31.6 2016: D+26.2 2012: D+15.4 2008: D+15.3
Not yet ingested
- Civics
- —
Market trends
- HPI YoY
- ▼ -203.91%
- Current HPI
- 325.6966
- Rent YoY
- ▲ 0.43%
- Metro
- Dallas-Fort Worth-Arlington, TX
- State GDP YoY
- ▲ 3.95%
- F500 in state
- 110
Industry mix (Fortune 500 HQ in TX)
| Industry | F500 HQs | Revenue |
|---|---|---|
| Energy | 16 | $1,198B |
|
||
| Technology | 5 | $198B |
|
||
| Engineering / Construction | 4 | $72B |
|
||
| Energy Services | 3 | $60B |
|
||
| Utilities | 3 | $41B |
|
||
| Healthcare | 2 | $330B |
|
||
Price history
2 events — show timeline
- 2026-01-05 Listed $175,000 NTREIS
- 2002-04-05 Sold (Public Records) — Public Records
Property tax history
+5.4%/yrLatest (2025): $5,070 · +14.7% YoY. Source: county tax records.
Cash-flow waterfall
monthlySold comps — $/sqft
last 12 mo · ≤1 miLoading sold comps…