 Duplex
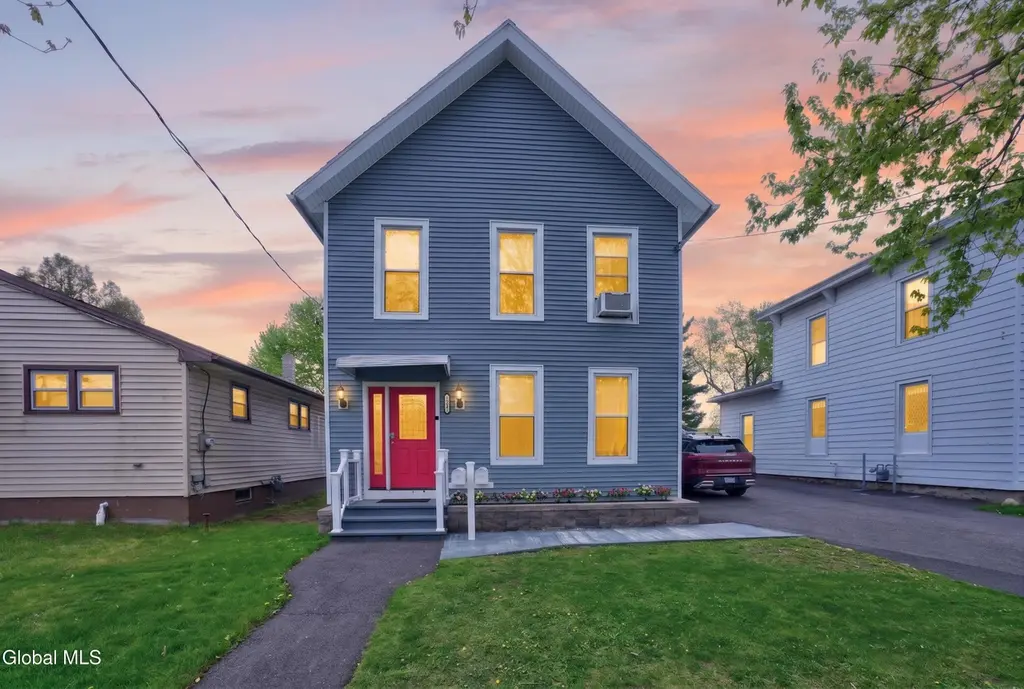
141 Second St · Waterford, NY
Flood risk 10/10 · Severe
- FEMA flood zone
- AE
- Chance of flooding over 30 yrs
- 0.99%
- Est. flood insurance / yr
- $2,026 – $9,024
Fire risk 1/10 · Minimal
- Est. fire insurance / yr
- $691 – $1,283
Heat risk 4/10 · Minor
- Hot days now (above 95°F)
- 7 days/yr
- Hot days in 30 yrs
- 17 days/yr
Wind risk 3/10 · Minor
- Chance of severe wind over 30 yrs
- 6.0%
Air-quality risk 2/10 · Minimal
- Unhealthy air days now
- 0 days/yr
- Unhealthy air days in 30 yrs
- 1 days/yr
Risk factors via First Street. Map © Google.
Why this score? — see what drove the B- grade
The composite is a weighted blend of 9 inputs, each scored 0–100. Each bar is that input's sub-score; the figure is the points it added to the 100-point composite (weight × sub-score).
- Cash flow +24.0/30.0
- ARV discount +15.0/15.0
- DSCR +7.7/10.0
- 1% rule +6.6/10.0
- Schools +5.1/10.0
- Livability +3.7/5.0
- Rent growth +2.5/5.0
- Condition / age +2.5/5.0
- Appreciation +0.0/10.0
$289,900
🖨 Deal sheet (PDF) 📄 Offer letter ✓ Due diligence
Multi-family units
County records classify this as Multi-Family (2-4 Unit). Listing-text estimate: 2 units. confirmed
Listing remarks
* * Multiple Offers Deadline 5/11/26 @ 6:00pm * * Check out this well-maintained up-and-down two-family with Hudson River frontage. Discover an amazing opportunity with this spacious 1984 sq ft home offering flexibility for owner-occupants or investors. Both units are well-designed, light-filled, and feature generous living spaces. First Floor Unit: Large living room, formal dining room or sitting room, eat-in kitchen, 2 bedrooms and full bath. Additional office or den overlooking the backyard - ideal for remote work. Second Floor Unit: Comfortable living room, formal dining room or bonus room, eat-in kitchen, 2 bedrooms and full bath. This unit includes an office or den in the front of
Key facts
- Expansive lawn
- Stunning deck
- Above-ground pool
Tags
Property features AI
Exterior
- Parking: Off-street paved driveway parking (4 spaces total)
- Utilities: Public water; Public sewer
- Home design: Duplex; Living area 1,984; Vinyl siding construction
- Construction: Shingle/asphalt roof
- Exterior features: Deck; Shed(s); Level, landscaped lot with views; Riverfront on the Hudson River; Above-ground pool
Interior
- Kitchen: Unit 1: 1 kitchen (1st floor); Unit 2: 1 kitchen (2nd floor)
- Bedrooms: Unit 1: 2 bedrooms (1st floor); Unit 2: 2 bedrooms (2nd floor)
- Bathrooms: 2 full bathrooms total; Unit 1: 1 full bathroom (1st floor); Unit 2: 1 full bathroom (2nd floor)
- Heating & cooling: Baseboard heating; Hot water heating; Natural gas heating
- Interior features: Paddle fan
- Laundry & utility: Laundry on main level; Laundry on upper level
Neighborhood map
What this means for you Summary
Snapshot
- This is a 2 × 2-bed/1.0-bath units multifamily listed at $290k.
Deal economics
- At list price, monthly cash flow is $108 ($1k/yr) — positive. Per door: $54/mo.
- The deal already cash-flows at list — no discount required.
- Meets the 1% rule at list price ($3k rent vs $290k).
Location & tenants
- Location reads 74/100 on livability (#285 in NY, #4,586 nationally) — a middle-class / working-renter tenant base. Strengths: housing A+, health & safety A+, crime A-; Watch: commute D+, amenities D.
- Waterford-Halfmoon Union Free School District (rural): math 60% / reading 54% proficiency, ranked #322 of 755 in NY (top 43%) — acceptable for families but not a draw, mixed tenant base, ~2y average lease.
- Zoned schools: Waterford-Halfmoon Elementary School (math 42% / reading 62%, grade C-, #988 of 2,108 statewide, top 49%, 402 students, 45% FRL); Waterford-Halfmoon Junior-Senior High School (math 62% / reading 44%, grade C-, #934 of 1,100 statewide, top 86%, 336 students, 36% FRL).
- Market conditions: 48 active listings in the ZIP; 1 comparable units currently listed for rent nearby; solid renter incomes; 1,132 units permitted in Saratoga County in 2024 (378 in 5+ unit buildings).
- This rent runs 44% of the median local income ($92k/yr) — at the standard rent-burdened threshold; future hikes will face affordability resistance.
Forward outlook
- Local home prices are declining (-3.0%/yr); year-one equity from $2k of loan paydown is wiped out by about $9k of value loss. Plan a longer hold.
- Saratoga County population projected at +4% by 2050 — modest demand growth; plan on rents tracking national, not racing it.
Negotiation context
- Only 9 days on market — expect competitive offers; lowballing is unlikely to land.
Risks & watch-outs
- Watch-outs: flood insurance adds $460/mo; built in 1860 — expect roof / HVAC / electrical / plumbing capex.
- Climate carrying-cost: in FEMA flood zone AE (mandatory federal flood insurance) — expect insurance premiums to compound above CPI over the hold.
Questions for the listing agent
- Can we see the unit-by-unit rent roll, current vacancy, and any below-market leases? What's the average tenancy length?
- What capital expenditures (roof, boiler, parking lot, exteriors) have been made in the last 5 years, and what's planned in the next 2?
- Built in 1860 — when were the roof, HVAC, electrical panel, plumbing, and water heater last replaced?
- What's the actual annual flood-insurance premium (NFIP or private), and is the property in a SFHA with mandatory coverage?
- Is there a deadline driving the sale (1031 exchange, divorce, estate, relocation)? That informs how much negotiation room exists.
- What's the average days-on-market for RENTAL listings here right now (not sales)? A rising rental-DOM trend means longer vacancies and softer asking-rent achievability than the comps imply.
- What's the recent tenant-quality profile in this submarket — average credit score on applications, eviction rate, late-payment / NSF rate, and stable-employment percentage? A property-management company in the area should have these aggregated.
- How much new apartment / multifamily construction is in the pipeline within 1–3 miles? Heavy new supply (>2% of stock underway) typically softens rents 12–24 months out; light construction supports rent growth.
Investment metrics
- 1% rule
- 1.16% ✓
- Cap rate
- 8.65%
- Cash-on-cash
- 8.41%
- DSCR
- 1.37
- GRM
- 7.2
CMA / ARV
- ARV (median comp)
- $487,699
- List price
- $289,900
- Delta
- -40.56%
- Verdict
- UNDERPRICED
- Comps
- 20 within 1.0 mi
Show comp detail 6 sales within ~0.75 mi
| Address | Dist | Beds/Ba | Sqft | Sold | Price | $/sf | Match |
|---|---|---|---|---|---|---|---|
| 141 Second St | 0.00mi | 4/2.0 | 1,984 (0%) | 0mo | $350,000 | $176 | 100 |
| 60-62 4th St | 0.30mi | 4/2.5 | 1,800 (-9%) | 19mo | $298,700 | $166 | 53 |
| 878 3rd Ave | 0.69mi | 4/2.0 | 2,042 (+3%) | 14mo | $165,000 | $81 | 51 |
| 2 Knox St | 0.49mi | 5/2.0 (+1) | 1,855 (-6%) | 15mo | $315,000 | $170 | 48 |
| 902 3rd Ave | 0.64mi | 4/2.0 | 2,244 (+13%) | 1mo | $231,540 | $103 | 48 |
| 2 Short 6th St | 0.60mi | 4/2.0 | 1,720 (-13%) | 2mo | $324,000 | $188 | 48 |
Match score weights: distance 35% · size 25% · config 20% · recency 20%. Top-matched comps best support the ARV.
Projected returns pro-forma
-3.0% appreciation · 3.0% rent growth · sell at horizon
- IRR
- -13.6%
- Equity multiple
- 0.51×
- Total profit
- $-39,710
- Equity at exit
- $43,225
- IRR
- -4.5%
- Equity multiple
- 0.70×
- Total profit
- $-24,170
- Equity at exit
- $25,065
Cash invested: $81,172 (down + closing). Projections, not guarantees.
Landlord ↔ Tenant lean methodology
- Overall (STATE)
- 15 Strongly Tenant-Friendly
- State New York
- 15 Strongly Tenant-Friendly · D+10
- County
- — inherits STATE
- City
- — inherits STATE
ZIP-level market 12188
- Home prices YoY
- -13.3%
- Active inventory
- 48
- Price-to-rent
- 14.4×
Monthly cashflow live
- Estimated rent
- $3,350 high interval (Pro) →
- Mortgage (P&I)
- −$1,520
- Tax from tax record
- −$437 /mo · $5,243/yr
- Insurance
- −$121
- Flood insurance flood zone
- −$460 /mo · $5,525/yr
- HOA
- −$0
- Vacancy / Maint / Mgmt
- −$704
- Net cashflow
- $108
Break-even live
Sensitivity live
| Price | -10% $272 | -5% $190 | +0% $108 | +5% $26 | +10% $-56 |
|---|---|---|---|---|---|
| Rent | -10% $-157 | -5% $-24 | +0% $108 | +5% $240 | +10% $373 |
| Rate | -1.0pp $254 | -0.5pp $182 | base $108 | +0.5pp $33 | +1.0pp $-43 |
2-unit breakdown (identical units grouped — click to expand)
| Units | Beds | Baths | Est. rent |
|---|---|---|---|
| 2× units | 2 | 1 | $3,350 |
| #1 | 2 | 1 | $1,675 |
| #2 | 2 | 1 | $1,675 |
| Total (2 units) | $3,350 | ||
UW: 25.0% down · 7.5% · 30yr · 1.5% tax · 5.0% vac · 8.0% maint · 8.0% mgmt
Financing live
Cash to close
- Down payment
- $72,475
- Closing costs
- $8,697
- Reserves months
- —
- Total cash needed
- —
Loan-product check · same deal, 3 products live
Conventional
25% down · 7.5% · 30yr
- Down + closing
- —
- Monthly P&I
- —
- Monthly cashflow
- —
- DSCR
- —
- Eligible?
- —
Personal DTI + credit; lowest rate.
DSCR
20% down · 8.5% · 30yr
- Down + closing
- —
- Monthly P&I
- —
- Monthly cashflow
- —
- DSCR
- —
- Eligible?
- —
No personal income docs; deal must DSCR.
Hard money
10% down · 12.0% · 12mo
- Down + closing
- —
- Monthly P&I
- —
- Monthly cashflow
- —
- DSCR
- —
- Eligible?
- —
Short-term bridge; refi at stabilization.
Rent comps 1 comps
| Address | Beds | Baths | Sqft | Rent | $/sqft | DOM | Units | Dist |
|---|---|---|---|---|---|---|---|---|
| 750 2nd Ave Troy, NY | 1.0–3.0 | 1.0–1.5 | 1185 | $1,711 | $1.44 | 15d | 1 | 0.96mi |
Listing history 3 events
-
2026-05-17status Pending 1778-char remark
-
2026-05-07$289,900 Active 1778-char remark
-
1998-08-25soldstatus $68,000
ⓘ Source: listings_history table (triggers on properties + properties_extension) + one-shot
backfill from property_details.listing_events for pre-trigger history.
Tax reassessment forecast NY · Partial reset (capped growth)
- Current annual tax
- $5,243 · $437/mo
- Projected year-2 tax
- $5,243 · $437/mo
- Expected delta
- $0/yr ($0/mo · 0.0%)
ⓘ Screening estimate from a state-policy table — verify with the county assessor before closing.
Climate risk First Street
- Flood 10/10 Extreme FEMA zone AE · 99% chance over 30 yrs
- Wildfire 1/10 Low
- Heat 4/10 Moderate 7 d/yr ≥95°F today · 17 d/yr by 30 yrs out
- Wind 3/10 Moderate 6% chance of damaging wind over 30 yrs
- Air quality 2/10 Low 0 unhealthy d/yr today · 1 by 30 yrs out
Nearby sold comps map
Loading sold comps map…
Walkable amenities ~0.75 mi
Loading nearby amenities…
Taxation est. · year 1
- Rental income
- $40,200
- − Mortgage interest
- −$16,239
- − Property taxes
- −$5,243
- − Insurance
- −$6,974
- − Repairs & maintenance
- −$3,216
- − Management
- −$3,216
- − Depreciation
- −$8,433
- Taxable loss
- −$3,122
- Est. tax savings @ 24.0%
- +$749
- After-tax cash flow
- $2,047/yr
For passive investors: Depreciation is non-cash, so a rental often shows a tax loss while cash-flowing — sheltering income. Rental losses are passive: they offset passive income freely, and up to $25,000/yr can offset ordinary (W-2) income if you actively participate and your MAGI is under $100k (phasing out to $0 by $150k); unused losses carry forward. On sale, claimed depreciation is recaptured at up to 25%, and gains may owe capital-gains tax (a 1031 exchange can defer both). Figures are a year-1 estimate at your 24.0% rate — not tax advice; consult a CPA.
Schools (NCES district)
- District
- Waterford-Halfmoon Union Free School District
- NCES district ID
- 3630060
- Math proficiency
- 60% ▲ 3.00%
- Reading proficiency
- 54% ▲ 2.00%
- Median HH income
- $53,359
- Composite
- 50.65/100
- National rank
- #3943
- State rank
- #322 of 755 in NY
Livability — Waterford
- Score
- 74/100
- State rank
- #285
- US rank
- #4586
Category grades
Schools grade is shown separately in the Schools card above.
Census & demographics
- Census place
- Waterford, NY
- County
- Saratoga County · 166,192 people
- City population
- 10,988
- Metro
- Albany-Schenectady-Troy, NY
- Population (ZIP)
- 10,988
- Household income
- $92,279
- Rent vs Own
- Severe rent burden
- 129.0
Population outlook (Saratoga County) Hauer SSP2
- Today (2025)
- 238,889 people
- By 2030
- 243,681 · +2.0%
- By 2040
- 249,118 · +4.3%
- By 2050
- 248,638 · +4.1%
- By 2075
- 241,675 · +1.2%
- By 2100
- 213,150 · -10.8%
Race, ethnicity, and origin ACS 2023
- Neighborhood character
- Predominantly White (88%)
- Race & ethnicity
- White 88% Hispanic / Latino 4% Two or more races 4% Black 3% Native American 2% Asian 1%
- Common ancestry
- Lithuanian 8% Romanian 4% German 2%
- Foreign-born
- 5% · Canada
- Languages at home
- 94% English-only · French/Haitian/Cajun 2% Other Indo-European 2% Spanish 1%
Political lean MEDSL · Saratoga
- 2024 margin
- Toss-up / Even · D 50.9% · R 49.1%
- 2008→2024 swing
- -1.6pp toward R · 2008: 3.4pp · 2024: 1.8pp
- All cycles
- 2024: D+1.8 2020: D+5.4 2016: R+4.4 2012: D+2.1 2008: D+3.4
Not yet ingested
- Civics
- —
Market trends
- HPI YoY
- ▼ -48.55%
- Current HPI
- 316.5619
- Rent YoY
- —
- Metro
- Albany-Schenectady-Troy, NY
- State GDP YoY
- ▲ 2.60%
- F500 in state
- 92
Industry mix (Fortune 500 HQ in NY)
| Industry | F500 HQs | Revenue |
|---|---|---|
| Financial Services | 10 | $950B |
|
||
| Consumer Goods | 9 | $162B |
|
||
| Insurance | 4 | $225B |
|
||
| Telecommunications | 2 | $144B |
|
||
| Pharmaceuticals | 2 | $112B |
|
||
| Media / Entertainment | 2 | $69B |
|
||
Price history
+414.7% since first listed4 events — show timeline
- 2026-06-16 Sold (MLS) $350,000 Global MLS
- 2026-05-17 Pending — Global MLS
- 2026-05-07 Listed $289,900 Global MLS
- 1998-08-25 Sold (Public Records) $68,000 Public Records
Property tax history
+8.8%/yrLatest (2025): $5,243 · +2.0% YoY. Source: county tax records.
Cash-flow waterfall
monthlySold comps — $/sqft
last 12 mo · ≤1 miLoading sold comps…