 🏗️ New Construction
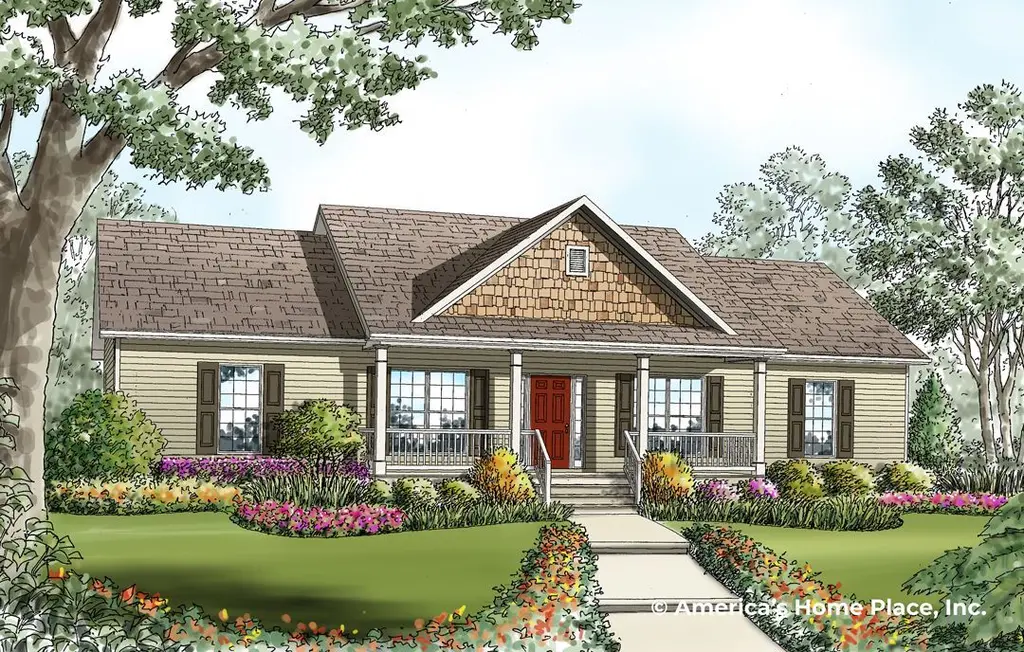
Bedford A Plan · Greensboro, NC
Flood risk No data
- FEMA flood zone
- —
- Chance of flooding over 30 yrs
- —
- Est. flood insurance / yr
- —
Fire risk No data
- Est. fire insurance / yr
- —
Heat risk No data
- Hot days now (above threshold)
- —
- Hot days in 30 yrs
- —
Wind risk No data
- Chance of severe wind over 30 yrs
- —
Air-quality risk No data
- Unhealthy air days now
- —
- Unhealthy air days in 30 yrs
- —
Risk factors via First Street. Map © Google.
Why this score? — see what drove the F grade
The composite is a weighted blend of 9 inputs, each scored 0–100. Each bar is that input's sub-score; the figure is the points it added to the 100-point composite (weight × sub-score).
- ARV discount +7.5/15.0
- Cash flow +6.7/30.0
- Condition / age +4.8/5.0
- Livability +4.0/5.0
- Rent growth +3.9/5.0
- Schools +3.6/10.0
- 1% rule +1.7/10.0
- DSCR +0.9/10.0
- Appreciation +0.0/10.0
$258,290
🖨 Deal sheet (PDF) 📄 Offer letter ✓ Due diligence
Listing remarks
This classic cottage welcomes you with a charming covered porch that opens into a thoughtfully designed four-bedroom floor plan. The master suite is set apart from the other bedrooms by the spacious central living area. From the dining room, step through the back door and discover the potential for a perfect outdoor entertainment space. The Bedford A offers endless opportunities for comfort and style.
Key facts
- Covered porch
- Listed 15 days
Tags
Property features AI
Finance
- Financial info: List price $258,290
Exterior
- Home design: Single-family plan named Bedford A; Entry listed as Bedford A Plan, Greensboro, NC
- Construction: New construction (Plan); Living area approximately 1,720 (as listed)
Interior
- Bedrooms: 4 bedrooms
- Bathrooms: 2 full bathrooms
- Interior features: Plan: Bedford A (new construction plan)
Neighborhood map
What this means for you Summary
Snapshot
- This is a 4-bed/2.0-bath single-family listed at $258k. Condition is rated excellent.
Deal economics
- At list price, monthly cash flow is $-529 ($-6k/yr) — negative.
- To cash-flow at today's rent, offer at most $254k (1.8% below list).
- To meet the 1% rule (rent ≥ 1% of price), the offer needs to be $222k (14.1% below list).
- Recommended offer: $222k (14.1% below list) — sets the bar for 1% rule.
Location & tenants
- Location reads 81/100 on livability (#12 in NC, #1,335 nationally) — a professional / high-income tenant draw. Strengths: amenities A+, commute A+, cost of living A+; Watch: employment D, crime F.
- Guilford County Schools (urban): math 39% / reading 45% proficiency, ranked #99 of 178 in NC (top 56%) — families likely to look elsewhere, expect single-tenant / working-renter base with shorter leases.
- Market conditions: Rents rising fast (+5.6%/yr); 324 active listings in the ZIP; 7 comparable units currently listed for rent nearby; rentals at typical pace (median 20d on market — plan ~3-4 weeks tenant-placement turnaround); solid renter incomes; 3,843 units permitted in Guilford County in 2024 (2,397 in 5+ unit buildings).
- This rent runs 31% of the median local income ($85k/yr) — at the standard rent-burdened threshold; future hikes will face affordability resistance.
Forward outlook
- Local home prices are declining (-3.0%/yr); year-one equity from $2k of loan paydown is wiped out by about $10k of value loss. Plan a longer hold.
- Guilford County population projected at +26% by 2050 — long-run rental-demand tailwind backs the buy-and-hold thesis.
Negotiation context
- It's been on market 15 days — a 2% lower offer ($254k) is reasonable based on typical stale-listing flexibility.
Questions for the listing agent
- What do current leases actually rent for vs. the listed asking? Can we see a recent rent roll and the last 12 months of T-12 income?
- Is there a deadline driving the sale (1031 exchange, divorce, estate, relocation)? That informs how much negotiation room exists.
- Crime grade is F in this area — have there been break-ins, vandalism, or insurance claims at this property in the last 3 years? What carrier currently insures it and at what premium?
- The area grade is low — what's the realistic commute time and amenity access for the typical tenant pool here? Any planned neighborhood developments (good or bad) we should know about?
- What's the average days-on-market for RENTAL listings here right now (not sales)? A rising rental-DOM trend means longer vacancies and softer asking-rent achievability than the comps imply.
- What's the recent tenant-quality profile in this submarket — average credit score on applications, eviction rate, late-payment / NSF rate, and stable-employment percentage? A property-management company in the area should have these aggregated.
- How much new for-sale + rental construction is in the pipeline within 1–3 miles? Heavy new supply typically softens prices + rents 12–24 months out; constrained supply supports both.
Investment metrics
- 1% rule
- 0.67% ✗
- Cap rate
- 4.37%
- Cash-on-cash
- -6.86%
- DSCR
- 0.69
- GRM
- 12.4
CMA / ARV
- ARV (on-the-fly)
- $330,240
- Comps found
- 7
Show comp detail 7 sales within ~0.75 mi
| Address | Dist | Beds/Ba | Sqft | Sold | Price | $/sf | Match |
|---|---|---|---|---|---|---|---|
| 3904 Talmaga Ln | 0.30mi | 4/2.0 | 1,696 (-1%) | 1mo | $319,900 | $189 | 82 |
| 3803 Plantation Dr | 0.25mi | 3/2.0 (-1) | 1,971 (+15%) | 8mo | $379,000 | $192 | 52 |
| 3015 Amidon Dr | 0.44mi | 4/3.0 | 1,618 (-6%) | 18mo | $324,500 | $201 | 50 |
| 5610 Bledsoe Dr | 0.72mi | 3/2.0 (-1) | 1,558 (-9%) | 7mo | $260,000 | $167 | 39 |
| 3497 Hancock Dr | 0.54mi | 3/2.5 (-1) | 1,615 (-6%) | 22mo | $356,000 | $220 | 39 |
| 3103 Bannock Ln | 0.50mi | 4/2.5 | 1,948 (+13%) | 19mo | $360,000 | $185 | 36 |
| 3406 Bardwell Rd | 0.71mi | 3/2.5 (-1) | 1,588 (-8%) | 17mo | $345,000 | $217 | 32 |
Match score weights: distance 35% · size 25% · config 20% · recency 20%. Top-matched comps best support the ARV.
Projected returns pro-forma
-3.0% appreciation · 5.57% rent growth · sell at horizon
- IRR
- -25.4%
- Equity multiple
- 0.12×
- Total profit
- $-81,262
- Equity at exit
- $49,240
- IRR
- -15.3%
- Equity multiple
- 0.04×
- Total profit
- $-88,516
- Equity at exit
- $28,553
Cash invested: $92,467 (down + closing). Projections, not guarantees.
Landlord ↔ Tenant lean methodology
- Overall (STATE)
- 85 Strongly Landlord-Friendly
- State North Carolina
- 85 Strongly Landlord-Friendly · R+3
- County
- — inherits STATE
- City
- — inherits STATE
ZIP-level market 27410
- Rents YoY
- 5.6%
- Active inventory
- 324
- Price-to-rent
- 9.7×
Monthly cashflow live
- Estimated rent
- $2,220 high interval (Pro) →
- Mortgage (P&I)
- −$1,732
- Tax est. 1.5%
- −$413 /mo · $4,954/yr
- Insurance
- −$138
- HOA
- −$0
- Vacancy / Maint / Mgmt
- −$466
- Net cashflow
- $-529
Break-even live
Sensitivity live
| Price | -10% $-300 | -5% $-415 | +0% $-529 | +5% $-643 | +10% $-757 |
|---|---|---|---|---|---|
| Rent | -10% $-704 | -5% $-616 | +0% $-529 | +5% $-441 | +10% $-353 |
| Rate | -1.0pp $-362 | -0.5pp $-445 | base $-529 | +0.5pp $-614 | +1.0pp $-701 |
UW: 25.0% down · 7.5% · 30yr · 1.5% tax · 5.0% vac · 8.0% maint · 8.0% mgmt
Financing live
Cash to close
- Down payment
- $82,560
- Closing costs
- $9,907
- Reserves months
- —
- Total cash needed
- —
Loan-product check · same deal, 3 products live
Conventional
25% down · 7.5% · 30yr
- Down + closing
- —
- Monthly P&I
- —
- Monthly cashflow
- —
- DSCR
- —
- Eligible?
- —
Personal DTI + credit; lowest rate.
DSCR
20% down · 8.5% · 30yr
- Down + closing
- —
- Monthly P&I
- —
- Monthly cashflow
- —
- DSCR
- —
- Eligible?
- —
No personal income docs; deal must DSCR.
Hard money
10% down · 12.0% · 12mo
- Down + closing
- —
- Monthly P&I
- —
- Monthly cashflow
- —
- DSCR
- —
- Eligible?
- —
Short-term bridge; refi at stabilization.
Rent comps 7 comps
| Address | Beds | Baths | Sqft | Rent | $/sqft | DOM | Units | Dist |
|---|---|---|---|---|---|---|---|---|
| 1509 New Garden Rd Greensboro, NC | 1.0–3.0 | 1.0–2.0 | 1060 | $1,795 | $1.69 | 15d | 15 | 0.58mi |
| 1815 New Bedford Dr Greensboro, NC | 3.0 | 2.0 | 1212 | $1,825 | $1.51 | 20d | 1 | 0.62mi |
| 12 Tannenbaum Cir Unit 1 Greensboro, NC | 3.0 | 2.5 | 1355 | $1,850 | $1.37 | 24d | 1 | 0.73mi |
| 4126 Macbeth ST Greensboro, NC | 3.0–4.0 | 2.5–3.5 | 1917 | $3,762 | $1.96 | 24d | 24 | 0.77mi |
| 1921 New Garden Rd Greensboro, NC | 1.0–3.0 | 1.0–2.0 | 993 | $1,756 | $1.77 | 15d | 8 | 0.99mi |
| 3520 Drawbridge Pkwy Greensboro, NC | 1.0–3.0 | 1.0–2.0 | 1034 | $1,595 | $1.54 | 20d | 7 | 1.40mi |
| 907 Elderberry Way Greensboro, NC | 3.0 | 2.5 | 1618 | $1,995 | $1.23 | 24d | 1 | 1.48mi |
Listing history 11 events
-
2026-06-18days on market $258,290 Active 15 DOM
-
2026-06-17days on market $258,290 Active 14 DOM
-
2026-06-16days on market $258,290 Active 13 DOM
-
2026-06-15days on market $258,290 Active 12 DOM
-
2026-06-14days on market $258,290 Active 10 DOM
-
2026-06-10days on market $258,290 Active 7 DOM
-
2026-06-09days on market $258,290 Active 6 DOM
-
2026-06-08days on market $258,290 Active 5 DOM
-
2026-06-07days on market $258,290 Active 4 DOM
-
2026-06-03remarks 404-char remark
-
2026-06-03$258,290 Active 1 DOM
ⓘ Source: listings_history table (triggers on properties + properties_extension) + one-shot
backfill from property_details.listing_events for pre-trigger history.
Nearby sold comps map
Loading sold comps map…
Walkable amenities ~0.75 mi
Loading nearby amenities…
Taxation est. · year 1
- Rental income
- $26,637
- − Mortgage interest
- −$18,499
- − Property taxes
- −$4,954
- − Insurance
- −$1,651
- − Repairs & maintenance
- −$2,131
- − Management
- −$2,131
- − Depreciation
- −$9,607
- Taxable loss
- −$12,336
- Est. tax savings @ 24.0%
- +$2,961
- After-tax cash flow
- $-3,383/yr
For passive investors: Depreciation is non-cash, so a rental often shows a tax loss while cash-flowing — sheltering income. Rental losses are passive: they offset passive income freely, and up to $25,000/yr can offset ordinary (W-2) income if you actively participate and your MAGI is under $100k (phasing out to $0 by $150k); unused losses carry forward. On sale, claimed depreciation is recaptured at up to 25%, and gains may owe capital-gains tax (a 1031 exchange can defer both). Figures are a year-1 estimate at your 24.0% rate — not tax advice; consult a CPA.
Condition & rehab AI · 13 photos
This classic cottage is in excellent condition with a well-maintained exterior and interior. It offers a spacious floor plan and modern finishes, making it an attractive option for both buyers and renters.
Value-add opportunities
- Both Landscaping and curb appeal improvements — Enhances the home's curb appeal and can attract more buyers or renters.
- Both Painting interior walls — Fresh paint can make the home feel more inviting and can increase its value.
- Both Landscaping and curb appeal improvements — Enhances the home's curb appeal and can attract more buyers or renters.
Renovation cost estimate screening
Value-add ROI direction
- Both Landscaping and curb appeal improvements — Enhances the home's curb appeal and can attract more buyers or renters. ↑
- Both Painting interior walls — Fresh paint can make the home feel more inviting and can increase its value. ↑
- Both Landscaping and curb appeal improvements — Enhances the home's curb appeal and can attract more buyers or renters. ↑
ⓘ Cost ranges are severity-bucket heuristics (US national rule-of-thumb). Get contractor quotes + a written scope before underwriting a rehab budget.
Schools (NCES district)
- District
- Guilford County Schools
- NCES district ID
- 3701920
- Math proficiency
- 39% ▲ 1.00%
- Reading proficiency
- 45% ▲ 1.00%
- Median HH income
- $46,315
- Composite
- 35.78/100
- National rank
- #4842
- State rank
- #99 of 178 in NC
Livability — Greensboro
- Score
- 81/100
- State rank
- #12
- US rank
- #1335
Category grades
Schools grade is shown separately in the Schools card above.
Census & demographics
- Census place
- Greensboro, NC
- County
- Guilford County · 487,190 people
- City population
- 329,421
- Metro
- Greensboro-High Point, NC
- Population (ZIP)
- 54,921
- Household income
- $85,291
- Rent vs Own
- Severe rent burden
- 2696.0
Population outlook (Guilford County) Hauer SSP2
- Today (2025)
- 584,596 people
- By 2030
- 616,851 · +5.5%
- By 2040
- 678,451 · +16.1%
- By 2050
- 734,788 · +25.7%
- By 2075
- 862,985 · +47.6%
- By 2100
- 948,704 · +62.3%
Race, ethnicity, and origin ACS 2023
- Neighborhood character
- Predominantly White (68%)
- Race & ethnicity
- White 68% Black 15% Two or more races 8% Hispanic / Latino 7% Asian 5%
- Hispanic origin (detail)
- Mexican 2% Puerto Rican 2%
- Common ancestry
- Italian 3% Serbian 3% Slovak 3%
- Foreign-born
- 11% · Canada, South Korea, China
- Languages at home
- 86% English-only · Spanish 4% Other Indo-European 3% Other Asian/Pacific 1%
Political lean MEDSL · Guilford
- 2024 margin
- Strong D (+21.8) · D 60.2% · R 38.4% · Other 1.4%
- 2008→2024 swing
- +3.5pp toward D · 2008: 18.4pp · 2024: 21.8pp
- All cycles
- 2024: D+21.8 2020: D+23.1 2016: D+20.0 2012: D+16.5 2008: D+18.4
Not yet ingested
- Civics
- —
Market trends
- HPI YoY
- ▼ -245.81%
- Current HPI
- 222.1685
- Rent YoY
- ▲ 5.57%
- Metro
- Greensboro-High Point, NC
- State GDP YoY
- ▲ 3.28%
- F500 in state
- 26
Industry mix (Fortune 500 HQ in NC)
| Industry | F500 HQs | Revenue |
|---|---|---|
| Financial Services | 2 | $213B |
|
||
| Retail | 2 | $95B |
|
||
| Industrial Conglomerate | 1 | $38B |
|
||
| Metals / Steel | 1 | $35B |
|
||
| Utilities | 1 | $30B |
|
||
| Industrial Machinery | 1 | $19B |
|
||
Cash-flow waterfall
monthlySold comps — $/sqft
last 12 mo · ≤1 miLoading sold comps…