2407 Pearson Cir · Harrisonville, MO
Flood risk 7/10 · Major
- FEMA flood zone
- X (unshaded)
- Chance of flooding over 30 yrs
- 0.76%
- Est. flood insurance / yr
- $473 – $860
Fire risk 2/10 · Minimal
- Est. fire insurance / yr
- $1,054 – $1,958
Heat risk 4/10 · Minor
- Hot days now (above 109°F)
- 7 days/yr
- Hot days in 30 yrs
- 17 days/yr
Wind risk 2/10 · Minimal
- Chance of severe wind over 30 yrs
- —
Air-quality risk 2/10 · Minimal
- Unhealthy air days now
- 1 days/yr
- Unhealthy air days in 30 yrs
- 1 days/yr
Risk factors via First Street. Map © Google.
Why this score? — see what drove the D grade
The composite is a weighted blend of 9 inputs, each scored 0–100. Each bar is that input's sub-score; the figure is the points it added to the 100-point composite (weight × sub-score).
- ARV discount +15.0/15.0
- Cash flow +10.1/30.0
- Schools +3.4/10.0
- Livability +3.3/5.0
- DSCR +2.9/10.0
- Rent growth +2.5/5.0
- Condition / age +2.5/5.0
- 1% rule +2.2/10.0
- Appreciation +0.0/10.0
$205,000
🖨 Deal sheet 📄 Offer letter ✓ Due diligence
Listing remarks MLS
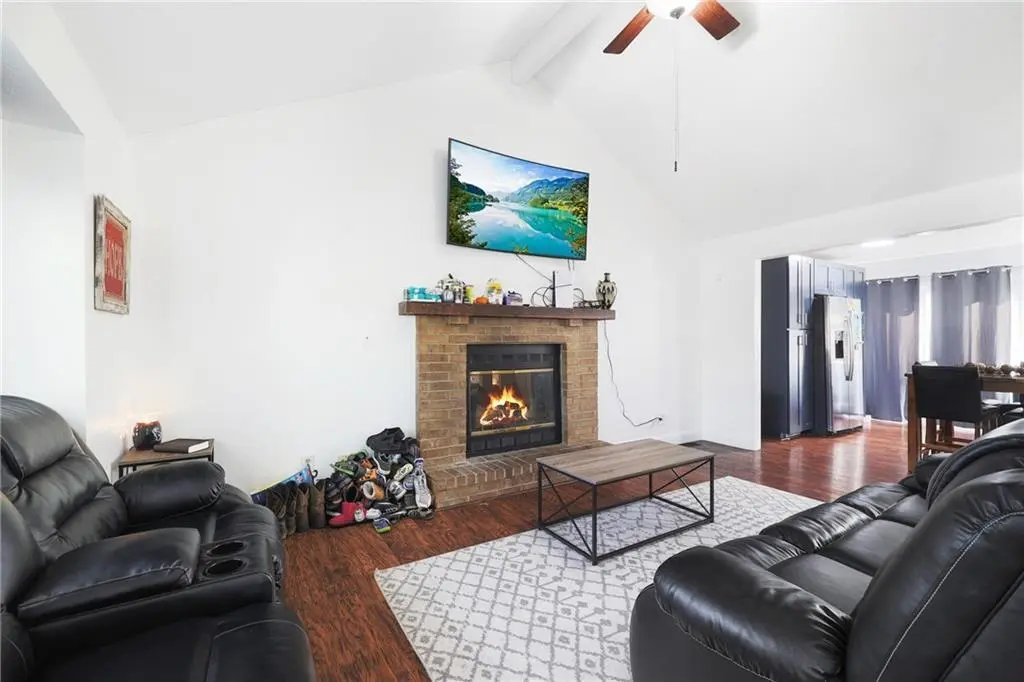
BACK ON MARKET- NO FAULT OF SELLERS! 3 bedroom 2 bath duplex offers comfortable main-level living with a finished walk-out basement for additional living space. The inviting living room features a cozy fireplace, perfect for relaxing evenings. Enjoy outdoor living with both a wood deck and a lower patio area overlooking a fenced-in backyard. The home also includes a one-car garage and a long driveway providing plenty of parking. Major updates include a 6-year-old roof. Convenient location with easy access to local amenities while still offering a peaceful neighborhood setting.
Key facts
- Garage
- Built 1986
- Listed 75 days
Neighborhood map
What this means for you Summary
Snapshot
- This is a 3-bed/2.0-bath single-family listed at $205k.
Deal economics
- At list price, monthly cash flow is $-175 ($-2k/yr) — negative.
- To cash-flow at today's rent, offer at most $174k (15.1% below list).
- To meet the 1% rule (rent ≥ 1% of price), the offer needs to be $147k (28.3% below list).
- Recommended offer: $147k (28.3% below list) — sets the bar for 1% rule.
- Cap rate 5.6% vs local median 3.2% in Harrisonville — top-decile yield for the area; either an underpriced asset or a hidden risk that comps aren't pricing in. Stress-test before assuming the spread holds.
Location & tenants
- Location reads 66/100 on livability (#231 in MO) — a middle-class / working-renter tenant base. Strengths: cost of living A+, housing A+; Watch: health & safety C-, crime F, amenities F.
- Harrisonville R-IX (town): math 32% / reading 46% proficiency, ranked #150 of 324 in MO (top 46%) — families likely to look elsewhere, expect single-tenant / working-renter base with shorter leases.
- Market conditions: 119 active listings in the ZIP; 7 comparable units currently listed for rent nearby; rentals leasing fast (median 2d on market — plan ~1-2 weeks tenant-placement turnaround); 588 units permitted in Cass County in 2024 (0 in 5+ unit buildings).
Forward outlook
- Local home prices are declining (-3.0%/yr); year-one equity from $1k of loan paydown is wiped out by about $6k of value loss. Plan a longer hold.
- Cass County population projected to shrink 3% by 2050 — rents likely to lag national; underwrite the cash flow, not the appreciation.
Negotiation context
- It's been on market 75 days — a 6% lower offer ($193k) is reasonable based on typical stale-listing flexibility.
- 5 sale attempts since 12y ago with the ask held roughly flat each time — persistent listings suggest the price (not the market) is what's stuck; bring a comps-based counter.
Risks & watch-outs
- Watch-outs: flood insurance adds $56/mo.
- Climate carrying-cost: major flood risk — expect insurance premiums to compound above CPI over the hold.
Questions for the listing agent
- What do current leases actually rent for vs. the listed asking? Can we see a recent rent roll and the last 12 months of T-12 income?
- It's been on market 75 days. Have you received any prior offers? Is the seller open to a 28% concession, seller financing, or rate buy-down credit?
- What's the actual annual flood-insurance premium (NFIP or private), and is the property in a SFHA with mandatory coverage?
- Why hasn't it sold? Are there any deal-killer items the seller is aware of (foundation, flood, title, zoning, code violations)?
- Is there a deadline driving the sale (1031 exchange, divorce, estate, relocation)? That informs how much negotiation room exists.
- Schools are B-rated — typically a magnet for longer-tenancy family renters. What's the average tenant stay here, and is there a school-zone premium baked into asking?
- Crime grade is F in this area — have there been break-ins, vandalism, or insurance claims at this property in the last 3 years? What carrier currently insures it and at what premium?
- The area grade is low — what's the realistic commute time and amenity access for the typical tenant pool here? Any planned neighborhood developments (good or bad) we should know about?
- What's the average days-on-market for RENTAL listings here right now (not sales)? A rising rental-DOM trend means longer vacancies and softer asking-rent achievability than the comps imply.
- What's the recent tenant-quality profile in this submarket — average credit score on applications, eviction rate, late-payment / NSF rate, and stable-employment percentage? A property-management company in the area should have these aggregated.
- How much new for-sale + rental construction is in the pipeline within 1–3 miles? Heavy new supply typically softens prices + rents 12–24 months out; constrained supply supports both.
Investment metrics
- 1% rule
- 0.72% ✗
- Cap rate
- 5.60%
- Cash-on-cash
- -2.49%
- DSCR
- 0.89
- GRM
- 11.6
CMA / ARV
- ARV (median comp)
- $252,334
- List price
- $205,000
- Delta
- -18.76%
- Verdict
- UNDERPRICED
- Comps
- 20 within 1.0 mi
Show comp detail 12 sales within ~0.75 mi
| Address | Dist | Beds/Ba | Sqft | Sold | Price | $/sf | Match |
|---|---|---|---|---|---|---|---|
| 501 Pheasant St | 0.13mi | 3/2.0 | 1,301 (-9%) | 0mo | $249,900 | $192 | 79 |
| 2001 Quail St | 0.25mi | 3/1.5 | 1,383 (-3%) | 14mo | $243,750 | $176 | 69 |
| 405 Osage St | 0.10mi | 3/1.0 | 1,214 (-15%) | 3mo | $269,000 | $222 | 64 |
| 2200 Meadowlark Dr | 0.25mi | 3/2.0 | 1,627 (+14%) | 4mo | $320,000 | $197 | 61 |
| 602 Bird Ave | 0.43mi | 3/1.5 | 1,368 (-4%) | 15mo | $200,000 | $146 | 59 |
| 2205 Meadowlark Dr | 0.26mi | 3/1.0 | 1,241 (-13%) | 6mo | $235,000 | $189 | 57 |
| 1403 E Mechanic St | 0.51mi | 4/2.5 (+1) | 1,536 (+8%) | 9mo | $269,999 | $176 | 49 |
| 1600 Blueberry Dr | 0.74mi | 3/2.0 | 1,296 (-9%) | 12mo | $235,000 | $181 | 40 |
| 1609 Stacy Rd | 0.70mi | 3/1.5 | 1,600 (+12%) | 7mo | $259,900 | $162 | 39 |
| 1702 Blueberry Dr | 0.68mi | 4/2.0 (+1) | 1,568 (+10%) | 10mo | $290,000 | $185 | 38 |
| 1100 E Pine St | 0.70mi | 3/2.0 | 1,588 (+12%) | 15mo | $265,000 | $167 | 36 |
| 1000 E Mechanic St | 0.71mi | 4/2.0 (+1) | 1,628 (+14%) | 12mo | $295,000 | $181 | 28 |
Match score weights: distance 35% · size 25% · config 20% · recency 20%. Top-matched comps best support the ARV.
Projected returns pro-forma
-3.0% appreciation · 3.0% rent growth · sell at horizon
- IRR
- -22.5%
- Equity multiple
- 0.23×
- Total profit
- $-44,375
- Equity at exit
- $30,566
- IRR
- -16.7%
- Equity multiple
- 0.08×
- Total profit
- $-53,081
- Equity at exit
- $17,725
Cash invested: $57,400 (down + closing). Projections, not guarantees.
Landlord ↔ Tenant lean methodology
- Overall (STATE)
- 81 Strongly Landlord-Friendly
- State Missouri
- 81 Strongly Landlord-Friendly · R+10
- County
- — inherits STATE
- City
- — inherits STATE
ZIP-level market 64701
- Active inventory
- 119
- Price-to-rent
- 11.6×
Monthly cashflow live
- Estimated rent
- $1,470 high interval (Pro) →
- Mortgage (P&I)
- −$1,075
- Tax from tax record
- −$120 /mo · $1,443/yr
- Insurance
- −$85
- Flood insurance flood zone
- −$56 /mo · $666/yr
- HOA
- −$0
- Vacancy / Maint / Mgmt
- −$309
- Net cashflow
- $-175
Break-even live
UW: 25.0% down · 7.5% · 30yr · 1.5% tax · 5.0% vac · 8.0% maint · 8.0% mgmt
Financing live
Cash to close
- Down payment
- $51,250
- Closing costs
- $6,150
- Reserves months
- —
- Total cash needed
- —
Loan-product check · same deal, 3 products live
Conventional
25% down · 7.5% · 30yr
- Down + closing
- —
- Monthly P&I
- —
- Monthly cashflow
- —
- DSCR
- —
- Eligible?
- —
Personal DTI + credit; lowest rate.
DSCR
20% down · 8.5% · 30yr
- Down + closing
- —
- Monthly P&I
- —
- Monthly cashflow
- —
- DSCR
- —
- Eligible?
- —
No personal income docs; deal must DSCR.
Hard money
10% down · 12.0% · 12mo
- Down + closing
- —
- Monthly P&I
- —
- Monthly cashflow
- —
- DSCR
- —
- Eligible?
- —
Short-term bridge; refi at stabilization.
Rent comps 7 comps
| Address | Beds | Baths | Sqft | Rent | $/sqft | DOM | Units | Dist |
|---|---|---|---|---|---|---|---|---|
| 900 Mission Rd Harrisonville, MO | 3.0 | 2.0 | 1300 | $1,575 | $1.21 | 7d | 1 | 0.32mi |
| 902 Mission Rd Harrisonville, MO | 3.0 | 2.0 | 1300 | $1,495 | $1.15 | 1d | 1 | 0.32mi |
| 2201 Twin Oaks Dr Apt 1 Harrisonville, MO | 3.0 | 1.5 | 1100 | $1,300 | $1.18 | 1d | 1 | 0.34mi |
| 1001 Twin Oaks Ter Unit 52 Harrisonville, MO | 3.0 | 2.0 | 1100 | $1,400 | $1.27 | 1d | 1 | 0.34mi |
| 2002 Ann Ave Harrisonville, MO | 3.0 | 2.0 | 1066 | $1,649 | $1.55 | 16d | 1 | 0.69mi |
| 701 Linwood Dr Harrisonville, MO | 2.0 | 1.5 | 915 | $1,275 | $1.39 | 1d | 1 | 1.02mi |
| 300 N Independence St Unit B Harrisonville, MO | 3.0 | 2.0 | 1520 | $1,600 | $1.05 | 43d | 1 | 1.16mi |
Listing history 23 events
-
2026-06-09days on market $205,000 Active 75 DOM
-
2026-06-08days on market $205,000 Active 74 DOM
-
2026-06-07days on market $205,000 Active 73 DOM
-
2026-06-03days on market $205,000 Active 69 DOM
-
2026-06-02days on market $205,000 Active 68 DOM
-
2026-06-01days on market $205,000 Active 67 DOM
-
2026-05-31days on market $205,000 Active 66 DOM
-
2026-05-02status Active 583-char remark
Show marketing remark (583 chars)
BACK ON MARKET- NO FAULT OF SELLERS! 3 bedroom 2 bath duplex offers comfortable main-level living with a finished walk-out basement for additional living space. The inviting living room features a cozy fireplace, perfect for relaxing evenings. Enjoy outdoor living with both a wood deck and a lower patio area overlooking a fenced-in backyard. The home also includes a one-car garage and a long driveway providing plenty of parking. Major updates include a 6-year-old roof. Convenient location with easy access to local amenities while still offering a peaceful neighborhood setting.
-
2026-04-30historical Active Under Contract 583-char remark
Show marketing remark (583 chars)
BACK ON MARKET- NO FAULT OF SELLERS! 3 bedroom 2 bath duplex offers comfortable main-level living with a finished walk-out basement for additional living space. The inviting living room features a cozy fireplace, perfect for relaxing evenings. Enjoy outdoor living with both a wood deck and a lower patio area overlooking a fenced-in backyard. The home also includes a one-car garage and a long driveway providing plenty of parking. Major updates include a 6-year-old roof. Convenient location with easy access to local amenities while still offering a peaceful neighborhood setting.
-
2026-04-15status Pending 583-char remark
Show marketing remark (583 chars)
BACK ON MARKET- NO FAULT OF SELLERS! 3 bedroom 2 bath duplex offers comfortable main-level living with a finished walk-out basement for additional living space. The inviting living room features a cozy fireplace, perfect for relaxing evenings. Enjoy outdoor living with both a wood deck and a lower patio area overlooking a fenced-in backyard. The home also includes a one-car garage and a long driveway providing plenty of parking. Major updates include a 6-year-old roof. Convenient location with easy access to local amenities while still offering a peaceful neighborhood setting.
-
2026-04-04price $205,000 583-char remark
Show marketing remark (583 chars)
BACK ON MARKET- NO FAULT OF SELLERS! 3 bedroom 2 bath duplex offers comfortable main-level living with a finished walk-out basement for additional living space. The inviting living room features a cozy fireplace, perfect for relaxing evenings. Enjoy outdoor living with both a wood deck and a lower patio area overlooking a fenced-in backyard. The home also includes a one-car garage and a long driveway providing plenty of parking. Major updates include a 6-year-old roof. Convenient location with easy access to local amenities while still offering a peaceful neighborhood setting.
-
2026-03-12$215,000 Active 583-char remark
Show marketing remark (583 chars)
BACK ON MARKET- NO FAULT OF SELLERS! 3 bedroom 2 bath duplex offers comfortable main-level living with a finished walk-out basement for additional living space. The inviting living room features a cozy fireplace, perfect for relaxing evenings. Enjoy outdoor living with both a wood deck and a lower patio area overlooking a fenced-in backyard. The home also includes a one-car garage and a long driveway providing plenty of parking. Major updates include a 6-year-old roof. Convenient location with easy access to local amenities while still offering a peaceful neighborhood setting.
-
2026-03-11historical $215,000 583-char remark
Show marketing remark (583 chars)
BACK ON MARKET- NO FAULT OF SELLERS! 3 bedroom 2 bath duplex offers comfortable main-level living with a finished walk-out basement for additional living space. The inviting living room features a cozy fireplace, perfect for relaxing evenings. Enjoy outdoor living with both a wood deck and a lower patio area overlooking a fenced-in backyard. The home also includes a one-car garage and a long driveway providing plenty of parking. Major updates include a 6-year-old roof. Convenient location with easy access to local amenities while still offering a peaceful neighborhood setting.
-
2023-10-06soldstatus
-
2017-03-06soldstatus
-
2017-03-03soldstatus Sold
-
2017-01-24status Pending
-
2016-12-09$89,950 Active
-
2016-12-01historical
-
2016-05-20$89,950 Active
-
2014-11-25soldstatus
-
2014-11-21soldstatus
-
2014-07-31$79,900
ⓘ Source: listings_history table (triggers on properties + properties_extension) + one-shot
backfill from property_details.listing_events for pre-trigger history.
Tax reassessment forecast MO · Resets to sale price
- Current annual tax
- $1,443 · $120/mo
- Projected year-2 tax
- $1,988 · $166/mo
- Expected delta
- +$545/yr (+$45/mo · 37.8%)
ⓘ Screening estimate from a state-policy table — verify with the county assessor before closing.
Climate risk First Street
- Flood 7/10 Severe FEMA zone X (unshaded) · 76% chance over 30 yrs
- Wildfire 2/10 Low
- Heat 4/10 Moderate 7 d/yr ≥109°F today · 17 d/yr by 30 yrs out
- Wind 2/10 Low
- Air quality 2/10 Low 1 unhealthy d/yr today · 1 by 30 yrs out
Nearby sold comps map
Loading sold comps map…
Walkable amenities ~0.75 mi
Loading nearby amenities…
Taxation est. · year 1
- Rental income
- $17,644
- − Mortgage interest
- −$11,483
- − Property taxes
- −$1,443
- − Insurance
- −$1,692
- − Repairs & maintenance
- −$1,411
- − Management
- −$1,411
- − Depreciation
- −$5,964
- Taxable loss
- −$5,761
- Est. tax savings @ 24.0%
- +$1,383
- After-tax cash flow
- $-714/yr
For passive investors: Depreciation is non-cash, so a rental often shows a tax loss while cash-flowing — sheltering income. Rental losses are passive: they offset passive income freely, and up to $25,000/yr can offset ordinary (W-2) income if you actively participate and your MAGI is under $100k (phasing out to $0 by $150k); unused losses carry forward. On sale, claimed depreciation is recaptured at up to 25%, and gains may owe capital-gains tax (a 1031 exchange can defer both). Figures are a year-1 estimate at your 24.0% rate — not tax advice; consult a CPA.
Schools (NCES district)
- District
- Harrisonville R-IX
- NCES district ID
- 2913760
- Math proficiency
- 32% ▼ -6.00%
- Reading proficiency
- 46% ▬ 0.00%
- Median HH income
- $49,997
- Composite
- 33.61/100
- National rank
- #5409
- State rank
- #150 of 324 in MO
Livability — Harrisonville
- Score
- 66/100
- State rank
- #231
- US rank
- #11262
Category grades
Schools grade is shown separately in the Schools card above.
Census & demographics
- Census place
- Harrisonville, MO
- Population (ZIP)
- 14,462
Population outlook (Cass County) Hauer SSP2
- Today (2025)
- 105,292 people
- By 2030
- 106,109 · +0.8%
- By 2040
- 105,786 · +0.5%
- By 2050
- 102,062 · -3.1%
- By 2075
- 88,569 · -15.9%
- By 2100
- 68,293 · -35.1%
Race, ethnicity, and origin ACS 2023
- Neighborhood character
- Predominantly White (92%)
- Race & ethnicity
- White 92% Two or more races 5% Hispanic / Latino 3%
- Common ancestry
- Serbian 3% Lithuanian 2% Iranian 2%
- Foreign-born
- 2% · Canada
- Languages at home
- 97% English-only · Spanish 3%
Political lean MEDSL · Cass
- 2024 margin
- Solid R (+32.1) · D 33.3% · R 65.4% · Other 1.3%
- 2008→2024 swing
- -12.5pp toward R · 2008: -19.6pp · 2024: -32.1pp
- All cycles
- 2024: R+32.1 2020: R+31.6 2016: R+35.9 2012: R+28.4 2008: R+19.6
Not yet ingested
- Civics
- —
Market trends
- HPI YoY
- ▼ -118.32%
- Current HPI
- 204.7926
- Rent YoY
- —
- Metro
- —
- State GDP YoY
- ▲ 1.84%
- F500 in state
- 20
Industry mix (Fortune 500 HQ in MO)
| Industry | F500 HQs | Revenue |
|---|---|---|
| Healthcare | 1 | $163B |
|
||
| Insurance | 1 | $21B |
|
||
| Industrial Technology | 1 | $17B |
|
||
| Retail | 1 | $16B |
|
||
| Industrial Distribution | 1 | $10B |
|
||
| Utilities | 1 | $9B |
|
||
Price history
+156.6% since first listed16 events — show timeline
- 2026-05-02 Relisted — Heartland MLS as Distributed by MLS Grid
- 2026-04-30 Contingent — Heartland MLS as Distributed by MLS Grid
- 2026-04-15 Pending — Heartland MLS as Distributed by MLS Grid
- 2026-04-04 Price Changed $205,000 Heartland MLS as Distributed by MLS Grid
- 2026-03-12 Listed $215,000 Heartland MLS as Distributed by MLS Grid
- 2026-03-11 Coming Soon $215,000 Heartland MLS as Distributed by MLS Grid
- 2023-10-06 Sold (Public Records) — Public Records
- 2017-03-06 Sold (Public Records) — Public Records
- 2017-03-03 Sold (MLS) — Heartland MLS as Distributed by MLS Grid
- 2017-01-24 Pending — Heartland MLS as Distributed by MLS Grid
- 2016-12-09 Listed $89,950 Heartland MLS as Distributed by MLS Grid
- 2016-12-01 Listing Removed — Heartland MLS as Distributed by MLS Grid
- 2016-05-20 Listed $89,950 Heartland MLS as Distributed by MLS Grid
- 2014-11-25 Sold (Public Records) — Public Records
- 2014-11-21 Sold (MLS) — Heartland MLS as Distributed by MLS Grid
- 2014-07-31 Listed $79,900 Heartland MLS as Distributed by MLS Grid
Property tax history
+5.7%/yrLatest (2025): $1,443 · +12.7% YoY. Source: county tax records.
Cash-flow waterfall
monthlySold comps — $/sqft
last 12 mo · ≤1 miLoading sold comps…