 🏷️ Likely Rental
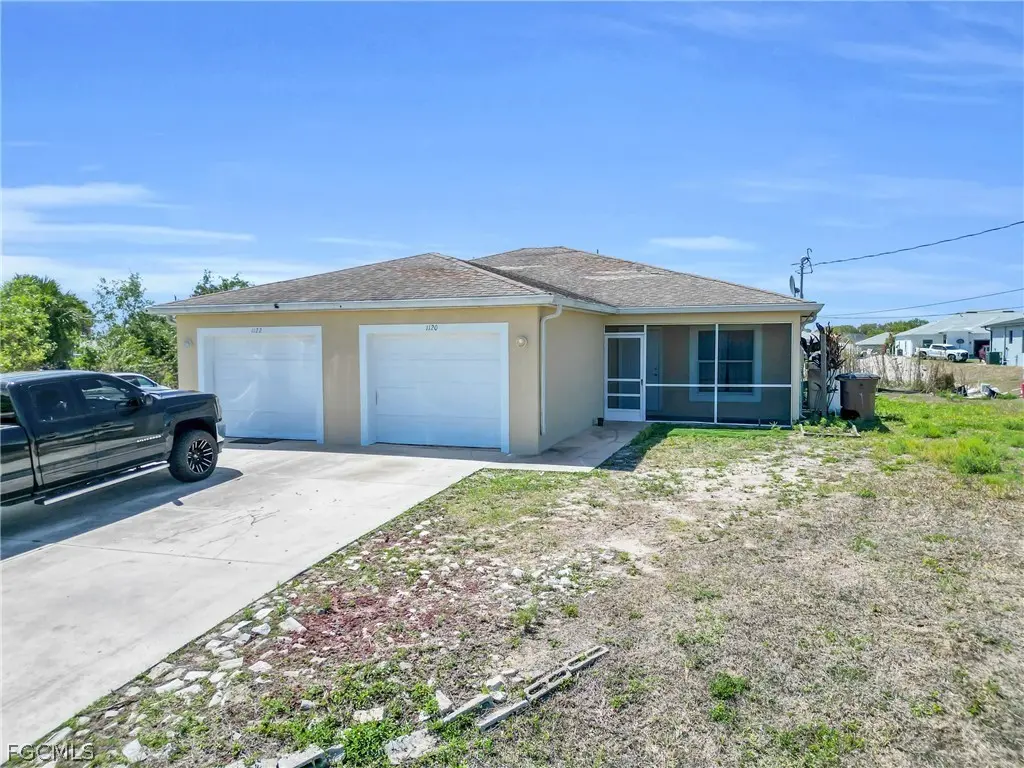
1120/1122 Gordon Ave S · Lehigh Acres, FL
Flood risk 1/10 · Minimal
- FEMA flood zone
- X (unshaded)
- Chance of flooding over 30 yrs
- 0.0%
- Est. flood insurance / yr
- $507 – $1,088
Fire risk 4/10 · Minor
- Est. fire insurance / yr
- $947 – $1,759
Heat risk 10/10 · Severe
- Hot days now (above 107°F)
- 7 days/yr
- Hot days in 30 yrs
- 30 days/yr
Wind risk 10/10 · Severe
- Chance of severe wind over 30 yrs
- 99.0%
Air-quality risk 2/10 · Minimal
- Unhealthy air days now
- 1 days/yr
- Unhealthy air days in 30 yrs
- 1 days/yr
Risk factors via First Street. Map © Google.
Why this score? — see what drove the C- grade
The composite is a weighted blend of 9 inputs, each scored 0–100. Each bar is that input's sub-score; the figure is the points it added to the 100-point composite (weight × sub-score).
- ARV discount +15.0/15.0
- Cash flow +14.8/30.0
- DSCR +4.5/10.0
- 1% rule +4.1/10.0
- Schools +4.1/10.0
- Condition / age +3.8/5.0
- Livability +3.0/5.0
- Appreciation +0.8/10.0
- Rent growth +0.8/5.0
$379,000
🖨 Deal sheet (PDF) 📄 Offer letter ✓ Due diligence
Multi-family units
County records classify this as Multi-Family (2-4 Unit). Listing-text estimate: 2 units. confirmed
Listing remarks
JUST REPOSITIONED PRICE!! Great opportunity for investors seeking immediate cash flow. Discover a prime multi-family opportunity in one of Southwest Florida’s fastest-growing rental markets. This duplex in Lehigh Acres offers the perfect blend of cash flow potential, long-term appreciation, and high tenant demand, making it ideal for both seasoned investors and owner-occupants looking to offset their mortgage. Two units each with 3 bedrooms and 2 bathrooms with a car garage and screened lanai porch entrance. Freshly painted on the exterior and interior, automatic door garage, well maintained duplex to give the peace of mind that next owner deserves. Don’t miss this chance to own
Key facts
- 0.29 acre lot
- 2 garage spots
- Built 2006
Tags
Property features AI
Finance
- Financial info: Gross scheduled income: $3,300; Operating expenses: $500; Actual rents shown: $1,600 and $1,700 per unit; Tenant pays electricity, grounds care, and internet; Pets allowed
- HOA & community: No association fee; Non-gated community
Exterior
- Parking: Each unit includes one attached garage space (2 attached garages total)
- Utilities: Well water; Septic tank sewer; Cable not available
- Home design: Multi-family property with 2 units; Resale condition; Zoned RM-2
- Construction: Shingle roof; Block, concrete, and stucco construction
- Exterior features: Patio; Rectangular lot; Paved road access
Interior
- Kitchen: Each unit includes a range and refrigerator
- Bedrooms: Two units each with 3 bedrooms (one unit on each level)
- Flooring: Tile
- Bathrooms: Four full bathrooms total (two in each unit)
- Heating & cooling: Central electric heating; Central electric cooling (air conditioning)
- Interior features: Single-hung windows; Tile flooring
- Laundry & utility: Each unit has washer/dryer hookup; Water softener (owned)
Neighborhood map
What this means for you Summary
Snapshot
- This is a 2 × 3-bed/2.0-bath units multifamily listed at $379k. Condition is rated good.
Deal economics
- At list price, monthly cash flow is $106 ($1k/yr) — positive. Per door: $53/mo.
- The deal already cash-flows at list — no discount required.
- To meet the 1% rule (rent ≥ 1% of price), the offer needs to be $345k (9.0% below list).
- Recommended offer: $345k (9.0% below list) — sets the bar for 1% rule.
- Cap rate 6.6% vs local median 4.7% in Lehigh Acres — top-decile yield for the area; either an underpriced asset or a hidden risk that comps aren't pricing in. Stress-test before assuming the spread holds.
Location & tenants
- Location reads 59/100 on livability (#826 in FL) — a working-class tenant base; expect higher turnover. Strengths: cost of living A+, housing A+; Watch: crime C-, employment D+, amenities F.
- Lee (suburban): math 47% / reading 50% proficiency, ranked #42 of 73 in FL (top 58%) — families likely to look elsewhere, expect single-tenant / working-renter base with shorter leases.
- Zoned schools: Veterans Park Academy For The Arts (math 41% / reading 45%, grade F, #1,366 of 2,144 statewide, top 64%, 2,133 students, 36% FRL); Oak Hammock Middle School (math 43% / reading 41%, grade D-, #340 of 571 statewide, top 61%, 1,563 students, 56% FRL); Lehigh Senior High School (math 23% / reading 45%, grade F, #394 of 667 statewide, top 60%, 2,476 students, 57% FRL).
- Market conditions: Rents falling (-7.0%/yr); 295 active listings in the ZIP; 2 comparable units currently listed for rent nearby; 15,411 units permitted in Lee County in 2024 (4,686 in 5+ unit buildings).
- At $3,450/mo this rent would consume 68% of the median local household income ($61k/yr) (locally 1142% of renters already pay >50% of income on rent) — very limited rent-growth headroom before tenants either downsize or default.
Forward outlook
- Local home prices are declining (-3.0%/yr); year-one equity from $3k of loan paydown is wiped out by about $11k of value loss. Plan a longer hold.
- Lee County population projected at +44% by 2050 — long-run rental-demand tailwind backs the buy-and-hold thesis.
Negotiation context
- It's been on market 86 days — a 6% lower offer ($356k) is reasonable based on typical stale-listing flexibility.
Risks & watch-outs
- Climate carrying-cost: severe wind risk, 99% chance of damaging wind over 30y; extreme-heat days projected 7→30/yr by 2055 (HVAC capex compounding) — expect insurance premiums to compound above CPI over the hold.
Questions for the listing agent
- It's been on market 86 days. Have you received any prior offers? Is the seller open to a 9% concession, seller financing, or rate buy-down credit?
- Can we see the unit-by-unit rent roll, current vacancy, and any below-market leases? What's the average tenancy length?
- What capital expenditures (roof, boiler, parking lot, exteriors) have been made in the last 5 years, and what's planned in the next 2?
- Why hasn't it sold? Are there any deal-killer items the seller is aware of (foundation, flood, title, zoning, code violations)?
- Is there a deadline driving the sale (1031 exchange, divorce, estate, relocation)? That informs how much negotiation room exists.
- Schools are D-rated, which usually means shorter tenancies and higher turnover. Who's the typical renter profile here, and what's been the actual vacancy rate?
- What's the average days-on-market for RENTAL listings here right now (not sales)? A rising rental-DOM trend means longer vacancies and softer asking-rent achievability than the comps imply.
- What's the recent tenant-quality profile in this submarket — average credit score on applications, eviction rate, late-payment / NSF rate, and stable-employment percentage? A property-management company in the area should have these aggregated.
- How much new apartment / multifamily construction is in the pipeline within 1–3 miles? Heavy new supply (>2% of stock underway) typically softens rents 12–24 months out; light construction supports rent growth.
Investment metrics
- 1% rule
- 0.91% ✗
- Cap rate
- 6.63%
- Cash-on-cash
- 1.20%
- DSCR
- 1.05
- GRM
- 9.2
CMA / ARV
- ARV (on-the-fly)
- $542,880
- Comps found
- 12
Show comp detail 12 sales within ~0.75 mi
| Address | Dist | Beds/Ba | Sqft | Sold | Price | $/sf | Match |
|---|---|---|---|---|---|---|---|
| 1116 Harold Ave S | 0.06mi | 6/4.0 | 2,360 (+1%) | 9mo | $550,000 | $233 | 88 |
| 1121-1123 Harry Ave S | 0.08mi | 6/4.0 | 2,364 (+1%) | 10mo | $549,900 | $233 | 86 |
| 1541/1543 Hightower Ave S | 0.44mi | 6/4.0 | 2,400 (+3%) | 2mo | $345,000 | $144 | 74 |
| 725/727 Ivan Ave S | 0.39mi | 6/4.0 | 2,316 (-1%) | 15mo | $425,000 | $184 | 68 |
| 4525/4527 21st St SW | 0.54mi | 6/4.0 | 2,306 (-2%) | 6mo | $435,000 | $189 | 67 |
| 309 Ichabod Ave S | 0.51mi | 6/4.0 | 2,360 (+1%) | 9mo | $550,000 | $233 | 67 |
| 713-715 Homer Ave S #719 | 0.35mi | 6/4.0 | 2,360 (+1%) | 18mo | $549,900 | $233 | 67 |
| 1141-1143 Ichabod Ave S | 0.29mi | 6/4.0 | 2,390 (+2%) | 22mo | $562,000 | $235 | 65 |
| 312-314 Harry Ave S | 0.53mi | 6/4.0 | 2,392 (+2%) | 23mo | $549,900 | $230 | 53 |
| 22nd SW Unit 4417/4419 | 0.65mi | 6/4.0 | 2,396 (+2%) | 17mo | $550,000 | $230 | 52 |
| 724 Jenna Ave S | 0.58mi | 6/4.0 | 2,238 (-4%) | 20mo | $449,000 | $201 | 49 |
| 133-135 Hightower Ave S | 0.67mi | 6/4.0 | 2,392 (+2%) | 22mo | $554,900 | $232 | 46 |
Match score weights: distance 35% · size 25% · config 20% · recency 20%. Top-matched comps best support the ARV.
Projected returns pro-forma
-3.0% appreciation · 0.0% rent growth · sell at horizon
- IRR
- -17.8%
- Equity multiple
- 0.39×
- Total profit
- $-64,701
- Equity at exit
- $56,510
- IRR
- -17.1%
- Equity multiple
- 0.19×
- Total profit
- $-86,484
- Equity at exit
- $32,769
Cash invested: $106,120 (down + closing). Projections, not guarantees.
Landlord ↔ Tenant lean methodology
- Overall (STATE)
- 87 Strongly Landlord-Friendly
- State Florida
- 87 Strongly Landlord-Friendly · R+3
- County
- — inherits STATE
- City
- — inherits STATE
ZIP-level market 33973
- Home prices YoY
- -3.4%
- Rents YoY
- -7.0%
- Active inventory
- 295
- Price-to-rent
- 18.3×
Monthly cashflow live
- Estimated rent
- $3,450 high interval (Pro) →
- Mortgage (P&I)
- −$1,988
- Tax est. 1.5%
- −$474 /mo · $5,685/yr
- Insurance
- −$158
- HOA
- −$0
- Vacancy / Maint / Mgmt
- −$724
- Net cashflow
- $106
Break-even live
Sensitivity live
| Price | -10% $368 | -5% $237 | +0% $106 | +5% $-25 | +10% $-156 |
|---|---|---|---|---|---|
| Rent | -10% $-166 | -5% $-30 | +0% $106 | +5% $243 | +10% $379 |
| Rate | -1.0pp $297 | -0.5pp $203 | base $106 | +0.5pp $8 | +1.0pp $-92 |
2-unit breakdown (identical units grouped — click to expand)
| Units | Beds | Baths | Est. rent |
|---|---|---|---|
| 2× units | 3 | 2 | $3,450 |
| #1 | 3 | 2 | $1,725 |
| #2 | 3 | 2 | $1,725 |
| Total (2 units) | $3,450 | ||
UW: 25.0% down · 7.5% · 30yr · 1.5% tax · 5.0% vac · 8.0% maint · 8.0% mgmt
Financing live
Cash to close
- Down payment
- $94,750
- Closing costs
- $11,370
- Reserves months
- —
- Total cash needed
- —
Loan-product check · same deal, 3 products live
Conventional
25% down · 7.5% · 30yr
- Down + closing
- —
- Monthly P&I
- —
- Monthly cashflow
- —
- DSCR
- —
- Eligible?
- —
Personal DTI + credit; lowest rate.
DSCR
20% down · 8.5% · 30yr
- Down + closing
- —
- Monthly P&I
- —
- Monthly cashflow
- —
- DSCR
- —
- Eligible?
- —
No personal income docs; deal must DSCR.
Hard money
10% down · 12.0% · 12mo
- Down + closing
- —
- Monthly P&I
- —
- Monthly cashflow
- —
- DSCR
- —
- Eligible?
- —
Short-term bridge; refi at stabilization.
Rent comps 2 comps
| Address | Beds | Baths | Sqft | Rent | $/sqft | DOM | Units | Dist |
|---|---|---|---|---|---|---|---|---|
| 1133 Ichabod Ave Lehigh Acres, FL | 6.0 | 4.0 | 2376 | $2,100 | $0.88 | 25d | 1 | 0.29mi |
| 10849 Timber Creek Dr Fort Myers, FL | 5.0 | 4.5 | 3357 | $4,000 | $1.19 | 25d | 1 | 1.37mi |
Listing history 13 events
-
2026-06-17days on market $379,000 Active 86 DOM
-
2026-06-16days on market $379,000 Active 85 DOM
-
2026-06-15days on market $379,000 Active 84 DOM
-
2026-06-13days on market $379,000 Active 82 DOM
-
2026-06-10days on market $379,000 Active 79 DOM
-
2026-06-09days on market $379,000 Active 78 DOM
-
2026-06-07days on market $379,000 Active 76 DOM
-
2026-06-03days on market $379,000 Active 72 DOM
-
2026-06-02days on market $379,000 Active 71 DOM
-
2026-06-01days on market $379,000 Active 70 DOM
-
2026-06-01days on market $379,000 Active 69 DOM
-
2026-05-04price $379,000
-
2026-03-23$399,000 Active
ⓘ Source: listings_history table (triggers on properties + properties_extension) + one-shot
backfill from property_details.listing_events for pre-trigger history.
Climate risk First Street
- Flood 1/10 Low FEMA zone X (unshaded) · 0% chance over 30 yrs
- Wildfire 4/10 Moderate
- Heat 10/10 Extreme 7 d/yr ≥107°F today · 30 d/yr by 30 yrs out
- Wind 10/10 Extreme 99% chance of damaging wind over 30 yrs
- Air quality 2/10 Low 1 unhealthy d/yr today · 1 by 30 yrs out
Nearby sold comps map
Loading sold comps map…
Walkable amenities ~0.75 mi
Loading nearby amenities…
Taxation est. · year 1
- Rental income
- $41,400
- − Mortgage interest
- −$21,230
- − Property taxes
- −$5,685
- − Insurance
- −$1,895
- − Repairs & maintenance
- −$3,312
- − Management
- −$3,312
- − Depreciation
- −$11,025
- Taxable loss
- −$5,059
- Est. tax savings @ 24.0%
- +$1,214
- After-tax cash flow
- $2,490/yr
For passive investors: Depreciation is non-cash, so a rental often shows a tax loss while cash-flowing — sheltering income. Rental losses are passive: they offset passive income freely, and up to $25,000/yr can offset ordinary (W-2) income if you actively participate and your MAGI is under $100k (phasing out to $0 by $150k); unused losses carry forward. On sale, claimed depreciation is recaptured at up to 25%, and gains may owe capital-gains tax (a 1031 exchange can defer both). Figures are a year-1 estimate at your 24.0% rate — not tax advice; consult a CPA.
Condition & rehab AI · 13 photos
This well-maintained multi-family property offers a good investment opportunity with minimal repairs and updates needed to maximize its value.
Value-add opportunities
- Both Paint exterior and interior — Fresh paint enhances curb appeal and interior aesthetics, increasing both resale and rental value.
- Both Landscaping — Improved landscaping can significantly enhance curb appeal and attract more tenants or buyers.
Renovation cost estimate screening
Value-add ROI direction
- Both Paint exterior and interior — Fresh paint enhances curb appeal and interior aesthetics, increasing both resale and rental value. ↑
- Both Landscaping — Improved landscaping can significantly enhance curb appeal and attract more tenants or buyers. ↑
ⓘ Cost ranges are severity-bucket heuristics (US national rule-of-thumb). Get contractor quotes + a written scope before underwriting a rehab budget.
Schools (NCES district)
- District
- Lee
- NCES district ID
- 1201080
- Math proficiency
- 47% ▼ -11.00%
- Reading proficiency
- 50% ▼ -4.00%
- Median HH income
- $49,518
- Composite
- 41.49/100
- National rank
- #3458
- State rank
- #42 of 73 in FL
Livability — Lehigh Acres
- Score
- 59/100
- State rank
- #826
- US rank
- #20055
Category grades
Schools grade is shown separately in the Schools card above.
Census & demographics
- Census place
- Lehigh Acres, FL
- County
- Lee County · 788,662 people
- City population
- 130,638
- Metro
- Cape Coral-Fort Myers, FL
- Population (ZIP)
- 14,392
- Household income
- $60,530
- Rent vs Own
- Severe rent burden
- 1142.0
Population outlook (Lee County) Hauer SSP2
- Today (2025)
- 871,946 people
- By 2030
- 955,468 · +9.6%
- By 2040
- 1,113,587 · +27.7%
- By 2050
- 1,256,891 · +44.1%
- By 2075
- 1,560,270 · +78.9%
- By 2100
- 1,726,848 · +98.0%
Race, ethnicity, and origin ACS 2023
- Neighborhood character
- Diverse neighborhood (Simpson 0.67)
- Race & ethnicity
- Hispanic / Latino 41% Black 36% Two or more races 21% White 18%
- Hispanic origin (detail)
- Mexican 21% Puerto Rican 7% Cuban 4% Dominican 1%
- Common ancestry
- Hispanic 14% Russian 1% Estonian 1%
- Foreign-born
- 23% · Canada, China
- Languages at home
- 54% English-only · Spanish 31% French/Haitian/Cajun 13% Other Indo-European 1%
Political lean MEDSL · Lee
- 2024 margin
- Strong R (+28.4) · D 35.5% · R 63.9%
- 2008→2024 swing
- -18.0pp toward R · 2008: -10.4pp · 2024: -28.4pp
- All cycles
- 2024: R+28.4 2020: R+19.2 2016: R+20.4 2012: R+16.6 2008: R+10.4
Not yet ingested
- Civics
- —
Market trends
- HPI YoY
- ▼ -8.43%
- Current HPI
- 237.694
- Rent YoY
- ▼ -6.99%
- Metro
- Cape Coral-Fort Myers, FL
- State GDP YoY
- ▲ 3.28%
- F500 in state
- 36
Industry mix (Fortune 500 HQ in FL)
| Industry | F500 HQs | Revenue |
|---|---|---|
| Industrial Technology | 2 | $29B |
|
||
| Insurance | 2 | $17B |
|
||
| Retail | 1 | $60B |
|
||
| Technology Distribution | 1 | $58B |
|
||
| Homebuilding | 1 | $35B |
|
||
| Technology Manufacturing | 1 | $35B |
|
||
Price history
-5.0% since first listed2 events — show timeline
- 2026-05-04 Price Changed $379,000 FORTMLS
- 2026-03-23 Listed $399,000 FORTMLS
Cash-flow waterfall
monthlySold comps — $/sqft
last 12 mo · ≤1 miLoading sold comps…