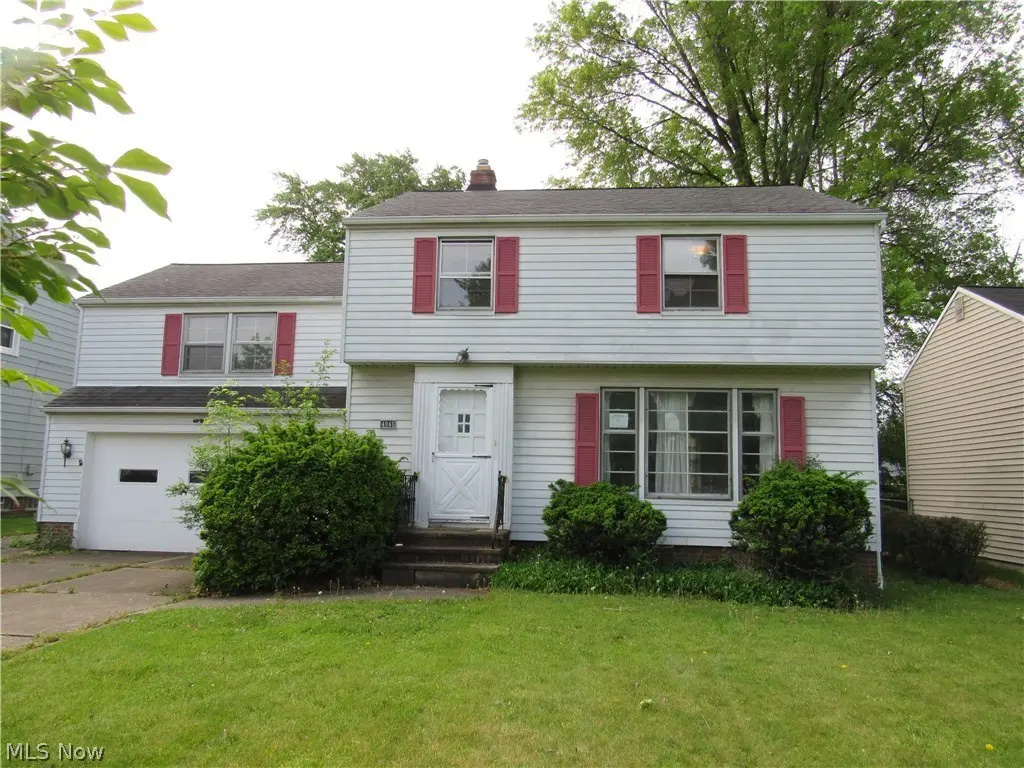
4946 Fairlawn Rd · Lyndhurst, OH
Flood risk 1/10 · Minimal
- FEMA flood zone
- X (unshaded)
- Chance of flooding over 30 yrs
- 0.0%
- Est. flood insurance / yr
- $473 – $860
Fire risk 1/10 · Minimal
- Est. fire insurance / yr
- $713 – $1,323
Heat risk 2/10 · Minimal
- Hot days now (above 95°F)
- 7 days/yr
- Hot days in 30 yrs
- 17 days/yr
Wind risk 1/10 · Minimal
- Chance of severe wind over 30 yrs
- —
Air-quality risk 3/10 · Minor
- Unhealthy air days now
- 2 days/yr
- Unhealthy air days in 30 yrs
- 5 days/yr
Risk factors via First Street. Map © Google.
Why this score? — see what drove the C grade
The composite is a weighted blend of 9 inputs, each scored 0–100. Each bar is that input's sub-score; the figure is the points it added to the 100-point composite (weight × sub-score).
- Cash flow +18.6/30.0
- ARV discount +14.0/15.0
- 1% rule +6.0/10.0
- DSCR +5.9/10.0
- Livability +4.1/5.0
- Rent growth +3.6/5.0
- Schools +3.1/10.0
- Condition / age +2.5/5.0
- Appreciation +0.0/10.0
$229,900
🖨 Deal sheet 📄 Offer letter ✓ Due diligence
Listing remarks
Opportunity awaits in this spacious 4-bedroom, 1.5-bath Colonial located in the highly desirable Lyndhurst community. Offering approximately 1,815 square feet of living space on a generous lot, this home is ready for its next owner to bring their vision and make it shine. The first floor features comfortable living and dining areas along with an eat-in kitchen complete with a cozy breakfast nook, perfect for casual meals and morning coffee. Upstairs you'll find four bedrooms, including two bedrooms with exposed hardwood floors. It is believed hardwood flooring may also exist beneath the carpeting in other areas, offering additional potential for restoration and added value. The basement pro
Key facts
- Breakfast nook
- Hardwood flooring
- Basement
Tags
Property features AI
Finance
- Financial info: Annual tax information available
Exterior
- Parking: Attached garage; Driveway; 2-car garage
- Utilities: Public water; Public sewer
- Home design: Two-story home; Above-grade finished area approximately 1,815
- Construction: Aluminum siding; Asphalt/fiberglass roof
- Exterior features: Lot approximately 0.22 acres
Interior
- Bedrooms: Total of 7 rooms (includes living spaces and bedrooms)
- Bathrooms: 1 full bathroom; 1 half bathroom; One main-level bathroom
- Heating & cooling: Central air conditioning; Forced air heating
- Interior features: Full unfinished basement; One fireplace
Neighborhood map
What this means for you Summary
Snapshot
- This is a 4-bed/1.5-bath single-family listed at $230k.
Deal economics
- At list price, monthly cash flow is $223 ($3k/yr) — positive.
- The deal already cash-flows at list — no discount required.
- Meets the 1% rule at list price ($3k rent vs $230k).
- Cap rate 7.5% vs local median 5.4% in Lyndhurst — top-decile yield for the area; either an underpriced asset or a hidden risk that comps aren't pricing in. Stress-test before assuming the spread holds.
Location & tenants
- Location reads 82/100 on livability (#76 in OH, #1,152 nationally) — a professional / high-income tenant draw. Strengths: cost of living A+, housing A+, health & safety A+; Watch: amenities C-, commute F.
- South Euclid-Lyndhurst City (suburban): math 23% / reading 45% proficiency, ranked #556 of 656 in OH (top 85%) — families likely to look elsewhere, expect single-tenant / working-renter base with shorter leases.
- Market conditions: Rents rising fast (+4.5%/yr); 176 active listings in the ZIP; 5 comparable units currently listed for rent nearby; rentals lingering (median 44d on market — plan ~5-8 weeks vacancy on turnover, expect pricing pressure); 60% of comp listings sitting > 30 days — soft ceiling on asking rent; solid renter incomes; 1,441 units permitted in Cuyahoga County in 2024 (700 in 5+ unit buildings).
- This rent runs 37% of the median local income ($82k/yr) — at the standard rent-burdened threshold; future hikes will face affordability resistance.
Forward outlook
- Local home prices are declining (-3.0%/yr); year-one equity from $2k of loan paydown is wiped out by about $7k of value loss. Plan a longer hold.
- Cuyahoga County population projected to shrink 8% by 2050 — rents likely to lag national; underwrite the cash flow, not the appreciation.
Negotiation context
- Only 9 days on market — expect competitive offers; lowballing is unlikely to land.
Risks & watch-outs
- Watch-outs: built in 1957 — expect roof / HVAC / electrical / plumbing capex.
Questions for the listing agent
- Built in 1957 — when were the roof, HVAC, electrical panel, plumbing, and water heater last replaced?
- Is there a deadline driving the sale (1031 exchange, divorce, estate, relocation)? That informs how much negotiation room exists.
- Schools are A-rated — typically a magnet for longer-tenancy family renters. What's the average tenant stay here, and is there a school-zone premium baked into asking?
- What's the average days-on-market for RENTAL listings here right now (not sales)? A rising rental-DOM trend means longer vacancies and softer asking-rent achievability than the comps imply.
- What's the recent tenant-quality profile in this submarket — average credit score on applications, eviction rate, late-payment / NSF rate, and stable-employment percentage? A property-management company in the area should have these aggregated.
- How much new for-sale + rental construction is in the pipeline within 1–3 miles? Heavy new supply typically softens prices + rents 12–24 months out; constrained supply supports both.
Investment metrics
- 1% rule
- 1.10% ✓
- Cap rate
- 7.46%
- Cash-on-cash
- 4.17%
- DSCR
- 1.19
- GRM
- 7.6
CMA / ARV
- ARV (on-the-fly)
- $268,620
- Comps found
- 12
Show comp detail 12 sales within ~0.75 mi
| Address | Dist | Beds/Ba | Sqft | Sold | Price | $/sf | Match |
|---|---|---|---|---|---|---|---|
| 4946 Fairlawn Rd | 0.00mi | 4/1.5 | 1,815 (0%) | 0mo | $232,500 | $128 | 100 |
| 4933 Fairlawn Rd | 0.04mi | 4/1.5 | 1,776 (-2%) | 0mo | $301,250 | $170 | 94 |
| 4971 S Sedgewick Rd | 0.13mi | 4/2.0 | 1,673 (-8%) | 3mo | $315,000 | $188 | 77 |
| 4776 Burger Rd | 0.34mi | 4/1.5 | 1,657 (-9%) | 1mo | $155,000 | $94 | 69 |
| 4784 Burger Rd | 0.32mi | 3/1.5 (-1) | 1,686 (-7%) | 2mo | $242,500 | $144 | 66 |
| 5180 Hickory Dr | 0.62mi | 4/2.5 | 1,792 (-1%) | 4mo | $315,000 | $176 | 62 |
| 4859 Delevan Dr | 0.64mi | 3/2.0 (-1) | 1,789 (-1%) | 2mo | $265,000 | $148 | 59 |
| 4948 Anderson Rd | 0.46mi | 3/1.0 (-1) | 1,684 (-7%) | 3mo | $136,000 | $81 | 57 |
| 4872 Oakland Dr | 0.30mi | 3/1.0 (-1) | 1,550 (-15%) | 2mo | $212,200 | $137 | 53 |
| 1393 Dorsh Rd | 0.60mi | 3/2.0 (-1) | 1,672 (-8%) | 0mo | $225,000 | $135 | 52 |
| 5156 Thornbury Rd | 0.48mi | 3/2.5 (-1) | 1,621 (-11%) | 4mo | $303,000 | $187 | 48 |
| 4876 Monticello Blvd | 0.68mi | 3/1.5 (-1) | 1,572 (-13%) | 1mo | $242,000 | $154 | 40 |
Match score weights: distance 35% · size 25% · config 20% · recency 20%. Top-matched comps best support the ARV.
Projected returns pro-forma
-3.0% appreciation · 4.45% rent growth · sell at horizon
- IRR
- -7.9%
- Equity multiple
- 0.70×
- Total profit
- $-19,121
- Equity at exit
- $34,279
- IRR
- 3.6%
- Equity multiple
- 1.28×
- Total profit
- $18,132
- Equity at exit
- $19,878
Cash invested: $64,372 (down + closing). Projections, not guarantees.
Landlord ↔ Tenant lean methodology
- Overall (STATE)
- 73 Landlord-Friendly
- State Ohio
- 73 Landlord-Friendly · R+6
- County
- — inherits STATE
- City
- — inherits STATE
ZIP-level market 44124
- Rents YoY
- 4.5%
- Active inventory
- 176
- Price-to-rent
- 7.6×
Monthly cashflow live
- Estimated rent
- $2,531 high interval (Pro) →
- Mortgage (P&I)
- −$1,206
- Tax from tax record
- −$474 /mo · $5,693/yr
- Insurance
- −$96
- HOA
- −$0
- Vacancy / Maint / Mgmt
- −$531
- Net cashflow
- $223
Break-even live
UW: 25.0% down · 7.5% · 30yr · 1.5% tax · 5.0% vac · 8.0% maint · 8.0% mgmt
Financing live
Cash to close
- Down payment
- $57,475
- Closing costs
- $6,897
- Reserves months
- —
- Total cash needed
- —
Loan-product check · same deal, 3 products live
Conventional
25% down · 7.5% · 30yr
- Down + closing
- —
- Monthly P&I
- —
- Monthly cashflow
- —
- DSCR
- —
- Eligible?
- —
Personal DTI + credit; lowest rate.
DSCR
20% down · 8.5% · 30yr
- Down + closing
- —
- Monthly P&I
- —
- Monthly cashflow
- —
- DSCR
- —
- Eligible?
- —
No personal income docs; deal must DSCR.
Hard money
10% down · 12.0% · 12mo
- Down + closing
- —
- Monthly P&I
- —
- Monthly cashflow
- —
- DSCR
- —
- Eligible?
- —
Short-term bridge; refi at stabilization.
Rent comps 5 comps
| Address | Beds | Baths | Sqft | Rent | $/sqft | DOM | Units | Dist |
|---|---|---|---|---|---|---|---|---|
| 4994 N Sedgewick Rd Cleveland, OH | 3.0 | 1.5 | 1400 | $3,000 | $2.14 | 43d | 1 | 0.15mi |
| 1270 Roland Rd Cleveland, OH | 4.0 | 2.0 | 1720 | $2,450 | $1.42 | 43d | 1 | 0.72mi |
| 4409 Adrian Rd Cleveland, OH | 4.0 | 2.5 | 1542 | $1,855 | $1.20 | 1d | 1 | 1.01mi |
| 963 Chelston Rd Cleveland, OH | 4.0 | 2.0 | 1974 | $1,950 | $0.99 | 43d | 1 | 1.28mi |
| 4456 Donna Dr Richmond Heights, OH | 3.0 | 2.5 | 1940 | $2,295 | $1.18 | 1d | 1 | 1.46mi |
Listing history 3 events
-
2026-06-01status $229,900 Pending 9 DOM
-
2026-05-31days on market $229,900 Active 9 DOM
-
2026-05-22$229,900 Active
ⓘ Source: listings_history table (triggers on properties + properties_extension) + one-shot
backfill from property_details.listing_events for pre-trigger history.
Tax reassessment forecast OH · Partial reset (capped growth)
- Current annual tax
- $5,693 · $474/mo
- Projected year-2 tax
- $5,693 · $474/mo
- Expected delta
- $0/yr ($0/mo · 0.0%)
ⓘ Screening estimate from a state-policy table — verify with the county assessor before closing.
Climate risk First Street
- Flood 1/10 Low FEMA zone X (unshaded) · 0% chance over 30 yrs
- Wildfire 1/10 Low
- Heat 2/10 Low 7 d/yr ≥95°F today · 17 d/yr by 30 yrs out
- Wind 1/10 Low
- Air quality 3/10 Moderate 2 unhealthy d/yr today · 5 by 30 yrs out
Nearby sold comps map
Loading sold comps map…
Walkable amenities ~0.75 mi
Loading nearby amenities…
Taxation est. · year 1
- Rental income
- $30,370
- − Mortgage interest
- −$12,878
- − Property taxes
- −$5,693
- − Insurance
- −$1,150
- − Repairs & maintenance
- −$2,430
- − Management
- −$2,430
- − Depreciation
- −$6,688
- Taxable loss
- −$898
- Est. tax savings @ 24.0%
- +$216
- After-tax cash flow
- $2,897/yr
For passive investors: Depreciation is non-cash, so a rental often shows a tax loss while cash-flowing — sheltering income. Rental losses are passive: they offset passive income freely, and up to $25,000/yr can offset ordinary (W-2) income if you actively participate and your MAGI is under $100k (phasing out to $0 by $150k); unused losses carry forward. On sale, claimed depreciation is recaptured at up to 25%, and gains may owe capital-gains tax (a 1031 exchange can defer both). Figures are a year-1 estimate at your 24.0% rate — not tax advice; consult a CPA.
Schools (NCES district)
- District
- South Euclid-Lyndhurst City
- NCES district ID
- 3904479
- Math proficiency
- 23% ▼ -22.00%
- Reading proficiency
- 45% ▼ -11.00%
- Median HH income
- $61,244
- Composite
- 30.51/100
- National rank
- #6212
- State rank
- #556 of 656 in OH
Livability — Lyndhurst
- Score
- 82/100
- State rank
- #76
- US rank
- #1152
Category grades
Schools grade is shown separately in the Schools card above.
Census & demographics
- Census place
- Lyndhurst, OH
- County
- Cuyahoga County · 1,090,369 people
- Metro
- Cleveland-Elyria, OH
- Population (ZIP)
- 39,779
- Household income
- $82,392
- Rent vs Own
- Severe rent burden
- 1286.0
Population outlook (Cuyahoga County) Hauer SSP2
- Today (2025)
- 1,244,621 people
- By 2030
- 1,230,093 · -1.2%
- By 2040
- 1,189,108 · -4.5%
- By 2050
- 1,145,706 · -7.9%
- By 2075
- 1,076,557 · -13.5%
- By 2100
- 978,987 · -21.3%
Race, ethnicity, and origin ACS 2023
- Neighborhood character
- Predominantly White (69%)
- Race & ethnicity
- White 69% Black 15% Two or more races 7% Asian 6% Hispanic / Latino 4%
- Common ancestry
- Romanian 6% Scotch-Irish 4% Lithuanian 3%
- Foreign-born
- 14% · Canada, China, Vietnam
- Languages at home
- 84% English-only · Russian/Polish/Slavic 4% Other Indo-European 4% Spanish 3%
Political lean MEDSL · Cuyahoga
- 2024 margin
- Solid D (+31.5) · D 65.4% · R 33.9%
- 2008→2024 swing
- -7.4pp toward R · 2008: 38.9pp · 2024: 31.5pp
- All cycles
- 2024: D+31.5 2020: D+34.1 2016: D+35.0 2012: D+38.7 2008: D+38.9
Not yet ingested
- Civics
- —
Market trends
- HPI YoY
- ▼ -212.96%
- Current HPI
- 164.108
- Rent YoY
- ▲ 4.45%
- Metro
- Cleveland-Elyria, OH
- State GDP YoY
- ▲ 1.98%
- F500 in state
- 48
Industry mix (Fortune 500 HQ in OH)
| Industry | F500 HQs | Revenue |
|---|---|---|
| Insurance | 3 | $145B |
|
||
| Industrial Machinery | 3 | $49B |
|
||
| Financial Services | 3 | $24B |
|
||
| Consumer Goods | 2 | $93B |
|
||
| Aerospace / Defense | 2 | $47B |
|
||
| Utilities | 2 | $33B |
|
||
Price history
1 event — show timeline
- 2026-05-22 Listed $229,900 MLSNOW
Property tax history
+4.2%/yrLatest (2025): $5,693 · +30.8% YoY. Source: county tax records.
Cash-flow waterfall
monthlySold comps — $/sqft
last 12 mo · ≤1 miLoading sold comps…