122 W Palm Beach Dr · Corpus Christi, TX
Flood risk 9/10 · Severe
- FEMA flood zone
- AE
- Chance of flooding over 30 yrs
- 0.99%
- Est. flood insurance / yr
- $1,737 – $8,500
Fire risk 4/10 · Minor
- Est. fire insurance / yr
- $1,222 – $2,270
Heat risk 10/10 · Severe
- Hot days now (above 106°F)
- 7 days/yr
- Hot days in 30 yrs
- 27 days/yr
Wind risk 10/10 · Severe
- Chance of severe wind over 30 yrs
- 99.0%
Air-quality risk 1/10 · Minimal
- Unhealthy air days now
- 0 days/yr
- Unhealthy air days in 30 yrs
- 0 days/yr
Risk factors via First Street. Map © Google.
Why this score? — see what drove the C+ grade
The composite is a weighted blend of 9 inputs, each scored 0–100. Each bar is that input's sub-score; the figure is the points it added to the 100-point composite (weight × sub-score).
- Cash flow +27.9/30.0
- DSCR +9.9/10.0
- 1% rule +7.6/10.0
- Schools +5.1/10.0
- Livability +3.9/5.0
- Rent growth +2.5/5.0
- Condition / age +2.5/5.0
- ARV discount +1.6/15.0
- Appreciation +0.0/10.0
$174,900
🖨 Deal sheet 📄 Offer letter ✓ Due diligence
Listing remarks
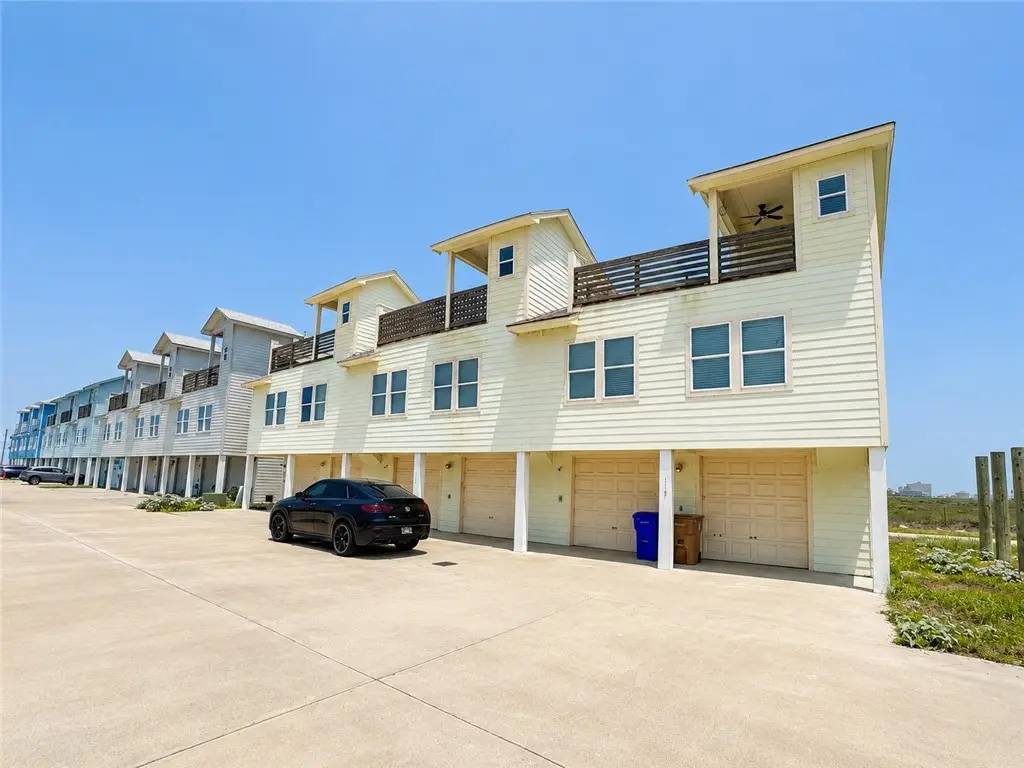
No HOA! Port Aransas Coastal Townhome – Beach Access & Water Views! Discover the perfect blend of location and potential in this 2 bedroom, 2 bathroom townhome in the heart of Port Aransas! Built in 2021, this 868 sq ft property offers modern construction with room to personalize and make it your own. Just a short golf cart ride to the beach, this is coastal living at its finest! Enjoy water views from the 3rd floor deck, ideal for morning coffee or sunset cocktails. The 2-car garage offers plenty of space for vehicles, storage, or your beach toys. Inside, the layout is efficient and welcoming, and the home awaits your finishing touches to truly shine. Don’t miss your chan
Key facts
- Modern construction
- Water views
- Coastal living
Tags
Property features AI
Finance
- HOA & community: Short-term rentals allowed
Exterior
- Parking: Attached front-entry garage; 2 covered garage spaces
- Security: Smoke detector(s)
- Utilities: Public water; Public sewer
- Home design: Single-story; Slab foundation
- Construction: Frame construction; Shingle roof; Built as single-story
- Exterior features: Open patio; Interior lot; Has a view
Interior
- Flooring: Luxury vinyl plank
- Bathrooms: 2 full bathrooms
- Heating & cooling: Central heating (electric); Central air conditioning
- Interior features: Home office; Breakfast bar
- Laundry & utility: Washer hookup; Dryer hookup
Neighborhood map
What this means for you Summary
Snapshot
- This is a 2-bed/2.0-bath townhouse listed at $175k.
Deal economics
- At list price, monthly cash flow is $113 ($1k/yr) — positive.
- The deal already cash-flows at list — no discount required.
- Meets the 1% rule at list price ($2k rent vs $175k).
- Recommended offer: $172k (1.5% below list) — sets the bar for market timing.
- Cap rate 10.0% vs local median 3.6% in Corpus Christi — top-decile yield for the area; either an underpriced asset or a hidden risk that comps aren't pricing in. Stress-test before assuming the spread holds.
Location & tenants
- Location reads 78/100 on livability (#66 in TX, #2,404 nationally) — a middle-class / working-renter tenant base. Strengths: commute A+, cost of living A+, housing A+; Watch: crime F.
- Port Aransas ISD (rural): math 57% / reading 63% proficiency, ranked #68 of 826 in TX (top 8%) — acceptable for families but not a draw, mixed tenant base, ~2y average lease.
- Market conditions: 1012 active listings in the ZIP; 1,397 units permitted in Nueces County in 2024 (47 in 5+ unit buildings).
Forward outlook
- Local home prices are declining (-3.0%/yr); year-one equity from $1k of loan paydown is wiped out by about $5k of value loss. Plan a longer hold.
- Nueces County population projected at +36% by 2050 — long-run rental-demand tailwind backs the buy-and-hold thesis.
Negotiation context
- It's been on market 20 days — a 2% lower offer ($172k) is reasonable based on typical stale-listing flexibility.
- 2 sale attempts with the ask held roughly flat each time — persistent listings suggest the price (not the market) is what's stuck; bring a comps-based counter.
Risks & watch-outs
- Watch-outs: flood insurance adds $427/mo.
- Climate carrying-cost: in FEMA flood zone AE (mandatory federal flood insurance); severe wind risk, 99% chance of damaging wind over 30y; extreme-heat days projected 7→27/yr by 2055 (HVAC capex compounding) — expect insurance premiums to compound above CPI over the hold.
Questions for the listing agent
- What's the actual annual flood-insurance premium (NFIP or private), and is the property in a SFHA with mandatory coverage?
- Is there a deadline driving the sale (1031 exchange, divorce, estate, relocation)? That informs how much negotiation room exists.
- Crime grade is F in this area — have there been break-ins, vandalism, or insurance claims at this property in the last 3 years? What carrier currently insures it and at what premium?
- What's the average days-on-market for RENTAL listings here right now (not sales)? A rising rental-DOM trend means longer vacancies and softer asking-rent achievability than the comps imply.
- What's the recent tenant-quality profile in this submarket — average credit score on applications, eviction rate, late-payment / NSF rate, and stable-employment percentage? A property-management company in the area should have these aggregated.
- How much new for-sale + rental construction is in the pipeline within 1–3 miles? Heavy new supply typically softens prices + rents 12–24 months out; constrained supply supports both.
Investment metrics
- 1% rule
- 1.26% ✓
- Cap rate
- 9.99%
- Cash-on-cash
- 13.21%
- DSCR
- 1.59
- GRM
- 6.6
CMA / ARV
- ARV (on-the-fly)
- $154,504
- Comps found
- 12
Show comp detail 12 sales within ~0.75 mi
| Address | Dist | Beds/Ba | Sqft | Sold | Price | $/sf | Match |
|---|---|---|---|---|---|---|---|
| 126 W Palm Beach Rd | 0.01mi | 2/2.0 | 868 (0%) | 3mo | $154,900 | $178 | 97 |
| 150 West Palm Beach Rd | 0.03mi | 2/2.0 | 868 (0%) | 2mo | $189,950 | $219 | 97 |
| 154 West Palm Beach Rd | 0.04mi | 2/2.0 | 868 (0%) | 4mo | $189,950 | $219 | 95 |
| 158 West Palm Beach Rd | 0.04mi | 2/2.0 | 868 (0%) | 3mo | $169,750 | $196 | 95 |
| 170 West Palm Bch | 0.05mi | 2/2.0 | 868 (0%) | 4mo | $125,000 | $144 | 94 |
| 166 West Palm Bch | 0.05mi | 2/2.0 | 868 (0%) | 5mo | $100,000 | $115 | 94 |
| 166 West Palm Beach Rd | 0.05mi | 2/2.0 | 868 (0%) | 5mo | $100,000 | $115 | 94 |
| 174 West Palm Bch | 0.06mi | 2/2.0 | 868 (0%) | 4mo | $125,000 | $144 | 94 |
| 138 W Palm Beach Rd | 0.07mi | 2/2.0 | 868 (0%) | 4mo | $144,900 | $167 | 94 |
| 118 W Palm Beach Rd | 0.07mi | 2/2.0 | 868 (0%) | 4mo | $160,000 | $184 | 93 |
| 142 W Palm Beach Rd | 0.07mi | 2/2.0 | 868 (0%) | 5mo | $154,900 | $178 | 93 |
| 7477 State Highway 361 #217 | 0.39mi | 1/1.0 (-1) | 873 (+1%) | 1mo | $267,000 | $306 | 72 |
Match score weights: distance 35% · size 25% · config 20% · recency 20%. Top-matched comps best support the ARV.
Projected returns pro-forma
-3.0% appreciation · 3.0% rent growth · sell at horizon
- IRR
- -11.7%
- Equity multiple
- 0.57×
- Total profit
- $-20,876
- Equity at exit
- $26,078
- IRR
- -2.3%
- Equity multiple
- 0.84×
- Total profit
- $-7,746
- Equity at exit
- $15,122
Cash invested: $48,972 (down + closing). Projections, not guarantees.
Landlord ↔ Tenant lean methodology
- Overall (STATE)
- 87 Strongly Landlord-Friendly
- State Texas
- 87 Strongly Landlord-Friendly · R+5
- County
- — inherits STATE
- City
- — inherits STATE
ZIP-level market 78373
- Active inventory
- 1012
- Price-to-rent
- 6.6×
Monthly cashflow live
- Estimated rent
- $2,212 medium interval (Pro) →
- Mortgage (P&I)
- −$917
- Tax est. 1.5%
- −$219 /mo · $2,624/yr
- Insurance
- −$73
- Flood insurance flood zone
- −$427 /mo · $5,118/yr
- HOA
- −$0
- Vacancy / Maint / Mgmt
- −$465
- Net cashflow
- $113
Break-even live
UW: 25.0% down · 7.5% · 30yr · 1.5% tax · 5.0% vac · 8.0% maint · 8.0% mgmt
Financing live
Cash to close
- Down payment
- $43,725
- Closing costs
- $5,247
- Reserves months
- —
- Total cash needed
- —
Loan-product check · same deal, 3 products live
Conventional
25% down · 7.5% · 30yr
- Down + closing
- —
- Monthly P&I
- —
- Monthly cashflow
- —
- DSCR
- —
- Eligible?
- —
Personal DTI + credit; lowest rate.
DSCR
20% down · 8.5% · 30yr
- Down + closing
- —
- Monthly P&I
- —
- Monthly cashflow
- —
- DSCR
- —
- Eligible?
- —
No personal income docs; deal must DSCR.
Hard money
10% down · 12.0% · 12mo
- Down + closing
- —
- Monthly P&I
- —
- Monthly cashflow
- —
- DSCR
- —
- Eligible?
- —
Short-term bridge; refi at stabilization.
Listing history 16 events
-
2026-06-18days on market $174,900 Active 20 DOM
-
2026-06-17days on market $174,900 Active 19 DOM
-
2026-06-16days on market $174,900 Active 18 DOM
-
2026-06-15days on market $174,900 Active 17 DOM
-
2026-06-14days on market $174,900 Active 15 DOM
-
2026-06-13days on market $174,900 Active 14 DOM
-
2026-06-10days on market $174,900 Active 12 DOM
-
2026-06-09days on market $174,900 Active 11 DOM
-
2026-06-08days on market $174,900 Active 10 DOM
-
2026-06-07days on market $174,900 Active 9 DOM
-
2026-06-03days on market $174,900 Active 5 DOM
-
2026-06-02days on market $174,900 Active 4 DOM
-
2026-06-01days on market $174,900 Active 3 DOM
-
2026-05-31days on market $174,900 Active 2 DOM
-
2026-05-30remarks 683-char remark
-
2026-05-30$174,900 Active 1 DOM
ⓘ Source: listings_history table (triggers on properties + properties_extension) + one-shot
backfill from property_details.listing_events for pre-trigger history.
Climate risk First Street
- Flood 9/10 Extreme FEMA zone AE · 99% chance over 30 yrs
- Wildfire 4/10 Moderate
- Heat 10/10 Extreme 7 d/yr ≥106°F today · 27 d/yr by 30 yrs out
- Wind 10/10 Extreme 99% chance of damaging wind over 30 yrs
- Air quality 1/10 Low 0 unhealthy d/yr today · 0 by 30 yrs out
Nearby sold comps map
Loading sold comps map…
Walkable amenities ~0.75 mi
Loading nearby amenities…
Taxation est. · year 1
- Rental income
- $26,549
- − Mortgage interest
- −$9,797
- − Property taxes
- −$2,624
- − Insurance
- −$5,993
- − Repairs & maintenance
- −$2,124
- − Management
- −$2,124
- − Depreciation
- −$5,088
- Taxable loss
- −$1,201
- Est. tax savings @ 24.0%
- +$288
- After-tax cash flow
- $1,639/yr
For passive investors: Depreciation is non-cash, so a rental often shows a tax loss while cash-flowing — sheltering income. Rental losses are passive: they offset passive income freely, and up to $25,000/yr can offset ordinary (W-2) income if you actively participate and your MAGI is under $100k (phasing out to $0 by $150k); unused losses carry forward. On sale, claimed depreciation is recaptured at up to 25%, and gains may owe capital-gains tax (a 1031 exchange can defer both). Figures are a year-1 estimate at your 24.0% rate — not tax advice; consult a CPA.
Schools (NCES district)
- District
- Port Aransas ISD
- NCES district ID
- 4835370
- Math proficiency
- 57% ▼ -9.00%
- Reading proficiency
- 63% ▼ -2.00%
- Median HH income
- $47,528
- Composite
- 50.82/100
- National rank
- #1803
- State rank
- #68 of 826 in TX
Livability — Corpus Christi
- Score
- 78/100
- State rank
- #66
- US rank
- #2404
Category grades
Schools grade is shown separately in the Schools card above.
Census & demographics
- Census place
- Corpus Christi, TX
- City population
- 296,836
- Population (ZIP)
- 3,314
Population outlook (Nueces County) Hauer SSP2
- Today (2025)
- 418,037 people
- By 2030
- 447,123 · +7.0%
- By 2040
- 505,911 · +21.0%
- By 2050
- 567,522 · +35.8%
- By 2075
- 729,686 · +74.6%
- By 2100
- 847,087 · +102.6%
Race, ethnicity, and origin ACS 2023
- Neighborhood character
- Predominantly White (87%)
- Race & ethnicity
- White 87% Two or more races 9% Hispanic / Latino 4%
- Common ancestry
- Serbian 2% Slovak 2% Iranian 2%
- Foreign-born
- 8% · Canada
- Languages at home
- 92% English-only · Other Indo-European 4% Spanish 3%
Political lean MEDSL · Nueces
- 2024 margin
- R (+11.5) · D 43.8% · R 55.3%
- 2008→2024 swing
- -7.1pp toward R · 2008: -4.4pp · 2024: -11.5pp
- All cycles
- 2024: R+11.5 2020: R+2.9 2016: R+1.5 2012: R+3.2 2008: R+4.4
Not yet ingested
- Civics
- —
Market trends
- HPI YoY
- ▼ -205.54%
- Current HPI
- 268.699
- Rent YoY
- —
- Metro
- —
- State GDP YoY
- ▲ 3.95%
- F500 in state
- 110
Industry mix (Fortune 500 HQ in TX)
| Industry | F500 HQs | Revenue |
|---|---|---|
| Energy | 16 | $1,198B |
|
||
| Technology | 5 | $198B |
|
||
| Engineering / Construction | 4 | $72B |
|
||
| Energy Services | 3 | $60B |
|
||
| Utilities | 3 | $41B |
|
||
| Healthcare | 2 | $330B |
|
||
Price history
+9.4% since first listed2 events — show timeline
- 2026-05-28 Listed $174,900 CBMLS
- 2026-02-28 Listed $159,900 CBMLS
Property tax history
+50.9%/yrLatest (2025): $10,150 · +22.4% YoY. Source: county tax records.
Cash-flow waterfall
monthlySold comps — $/sqft
last 12 mo · ≤1 miLoading sold comps…