 🏷️ Likely Rental
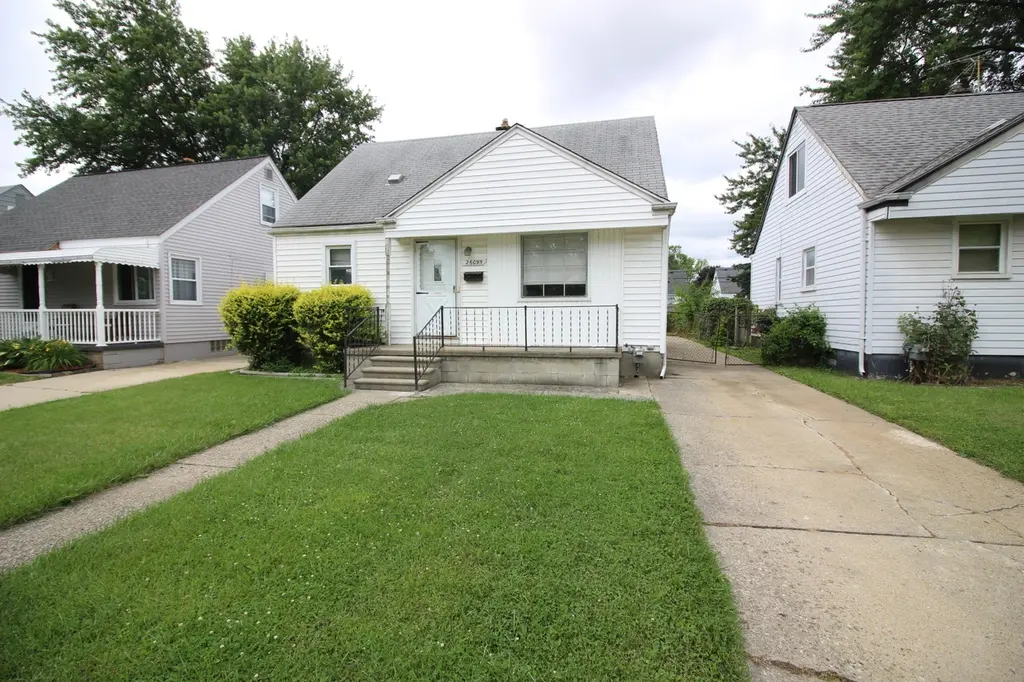
26095 Pattow St · Roseville, MI
Flood risk 1/10 · Minimal
- FEMA flood zone
- X (unshaded)
- Chance of flooding over 30 yrs
- 0.0%
- Est. flood insurance / yr
- $473 – $860
Fire risk 1/10 · Minimal
- Est. fire insurance / yr
- $784 – $1,456
Heat risk 3/10 · Minor
- Hot days now (above 96°F)
- 7 days/yr
- Hot days in 30 yrs
- 15 days/yr
Wind risk 1/10 · Minimal
- Chance of severe wind over 30 yrs
- —
Air-quality risk 4/10 · Minor
- Unhealthy air days now
- 4 days/yr
- Unhealthy air days in 30 yrs
- 5 days/yr
Risk factors via First Street. Map © Google.
Why this score? — see what drove the C- grade
The composite is a weighted blend of 9 inputs, each scored 0–100. Each bar is that input's sub-score; the figure is the points it added to the 100-point composite (weight × sub-score).
- Cash flow +17.9/30.0
- ARV discount +15.0/15.0
- 1% rule +6.0/10.0
- DSCR +5.6/10.0
- Livability +3.6/5.0
- Rent growth +2.6/5.0
- Condition / age +2.5/5.0
- Schools +1.5/10.0
- Appreciation +0.0/10.0
$130,000
🖨 Deal sheet 📄 Offer letter ✓ Due diligence
Listing remarks MLS
* TENANT OCCUPIED HOME * This 3 bedroom Bungalow located in Roseville offers a large kitchen and dining area. Full Basement. Tenant since 2020, currently month to month paying $1,397.
Key facts
- Dining area
- Large kitchen
- Full basement
Tags
Neighborhood map
What this means for you Summary
Snapshot
- This is a 3-bed/1.0-bath single-family listed at $130k.
Deal economics
- At list price, monthly cash flow is $110 ($1k/yr) — positive.
- The deal already cash-flows at list — no discount required.
- Meets the 1% rule at list price ($1k rent vs $130k).
- Recommended offer: $122k (6.0% below list) — sets the bar for market timing.
- Cap rate 7.3% vs local median 6.0% in Roseville — meaningfully above typical; check what's discounted (condition, days-on-market, listing class) to confirm the premium yield is real.
Location & tenants
- Location reads 72/100 on livability (#258 in MI) — a middle-class / working-renter tenant base. Strengths: commute A+, cost of living A+, housing A+; Watch: health & safety D+, employment D, schools F.
- Roseville Community Schools (suburban): math 11% / reading 24% proficiency, ranked #483 of 540 in MI (top 89%) — low school quality limits family demand, transient renter base, plan for 1-2y turnover; 60% free/reduced lunch — lower-income household profile, screen leases tightly.
- Market conditions: Rents flat; 265 active listings in the ZIP; 20 comparable units currently listed for rent nearby; rentals at typical pace (median 24d on market — plan ~3-4 weeks tenant-placement turnaround); 40% of comp listings sitting > 30 days — soft ceiling on asking rent; 1,321 units permitted in Macomb County in 2024 (86 in 5+ unit buildings).
Forward outlook
- Local home prices are declining (-3.0%/yr); year-one equity from $899 of loan paydown is wiped out by about $4k of value loss. Plan a longer hold.
- Macomb County population projected at +9% by 2050 — modest demand growth; plan on rents tracking national, not racing it.
Negotiation context
- It's been on market 61 days — a 6% lower offer ($122k) is reasonable based on typical stale-listing flexibility.
- 9 sale attempts since 12y ago with the ask held roughly flat each time — persistent listings suggest the price (not the market) is what's stuck; bring a comps-based counter.
- Current owner paid $875; list at $130k implies a 14757% gain — meaningful room to come down on a strong offer.
Risks & watch-outs
- Watch-outs: property tax is 2.6% of price; built in 1952 — expect roof / HVAC / electrical / plumbing capex.
Questions for the listing agent
- It's been on market 61 days. Have you received any prior offers? Is the seller open to a 6% concession, seller financing, or rate buy-down credit?
- Built in 1952 — when were the roof, HVAC, electrical panel, plumbing, and water heater last replaced?
- Property tax is high relative to price — has the assessment been appealed recently, and will the sale trigger a re-assessment?
- Why hasn't it sold? Are there any deal-killer items the seller is aware of (foundation, flood, title, zoning, code violations)?
- Is there a deadline driving the sale (1031 exchange, divorce, estate, relocation)? That informs how much negotiation room exists.
- Schools are F-rated, which usually means shorter tenancies and higher turnover. Who's the typical renter profile here, and what's been the actual vacancy rate?
- Crime grade is F in this area — have there been break-ins, vandalism, or insurance claims at this property in the last 3 years? What carrier currently insures it and at what premium?
- What's the average days-on-market for RENTAL listings here right now (not sales)? A rising rental-DOM trend means longer vacancies and softer asking-rent achievability than the comps imply.
- What's the recent tenant-quality profile in this submarket — average credit score on applications, eviction rate, late-payment / NSF rate, and stable-employment percentage? A property-management company in the area should have these aggregated.
- How much new for-sale + rental construction is in the pipeline within 1–3 miles? Heavy new supply typically softens prices + rents 12–24 months out; constrained supply supports both.
Investment metrics
- 1% rule
- 1.10% ✓
- Cap rate
- 7.31%
- Cash-on-cash
- 3.64%
- DSCR
- 1.16
- GRM
- 7.6
CMA / ARV
- ARV (median comp)
- $173,084
- List price
- $130,000
- Delta
- -24.89%
- Verdict
- UNDERPRICED
- Comps
- 20 within 1.0 mi
Show comp detail 12 sales within ~0.75 mi
| Address | Dist | Beds/Ba | Sqft | Sold | Price | $/sf | Match |
|---|---|---|---|---|---|---|---|
| 26095 Pattow St | 0.00mi | 3/1.0 | 1,180 (0%) | 1mo | $112,500 | $95 | 100 |
| 25914 Normandy St | 0.16mi | 3/1.5 | 1,161 (-2%) | 2mo | $105,500 | $91 | 87 |
| 26414 Waldorf St | 0.22mi | 3/1.0 | 1,290 (+9%) | 0mo | $180,000 | $140 | 74 |
| 20312 Yale St | 0.64mi | 3/1.5 | 1,188 (+1%) | 1mo | $230,000 | $194 | 66 |
| 20305 Frazho St | 0.58mi | 3/1.0 | 1,105 (-6%) | 0mo | $232,500 | $210 | 62 |
| 25355 Koontz St | 0.57mi | 3/1.0 | 1,080 (-8%) | 1mo | $215,000 | $199 | 59 |
| 26313 Princeton St | 0.58mi | 3/1.0 | 1,050 (-11%) | 0mo | $230,000 | $219 | 54 |
| 18305 Marquette St | 0.50mi | 3/1.0 | 1,026 (-13%) | 2mo | $172,000 | $168 | 53 |
| 27540 KAUFMAN St | 0.74mi | 3/1.0 | 1,092 (-8%) | 0mo | $160,000 | $147 | 52 |
| 27540 Kaufman St | 0.74mi | 3/1.0 | 1,092 (-8%) | 0mo | $160,000 | $147 | 52 |
| 25886 Hoffmeyer St | 0.51mi | 3/2.0 | 1,014 (-14%) | 2mo | $190,000 | $187 | 47 |
| 27520 Bohnhoff St | 0.71mi | 3/2.0 | 1,064 (-10%) | 0mo | $242,000 | $227 | 46 |
Match score weights: distance 35% · size 25% · config 20% · recency 20%. Top-matched comps best support the ARV.
Projected returns pro-forma
-3.0% appreciation · 0.39% rent growth · sell at horizon
- IRR
- -13.8%
- Equity multiple
- 0.52×
- Total profit
- $-17,590
- Equity at exit
- $19,383
- IRR
- -10.4%
- Equity multiple
- 0.45×
- Total profit
- $-20,096
- Equity at exit
- $11,240
Cash invested: $36,400 (down + closing). Projections, not guarantees.
Landlord ↔ Tenant lean methodology
- Overall (STATE)
- 62 Landlord-Friendly
- State Michigan
- 62 Landlord-Friendly · EVEN
- County
- — inherits STATE
- City
- — inherits STATE
ZIP-level market 48066
- Rents YoY
- 0.4%
- Active inventory
- 265
- Price-to-rent
- 7.6×
Monthly cashflow live
- Estimated rent
- $1,426 high interval (Pro) →
- Mortgage (P&I)
- −$682
- Tax from tax record
- −$280 /mo · $3,362/yr
- Insurance
- −$54
- HOA
- −$0
- Vacancy / Maint / Mgmt
- −$299
- Net cashflow
- $110
Break-even live
UW: 25.0% down · 7.5% · 30yr · 1.5% tax · 5.0% vac · 8.0% maint · 8.0% mgmt
Financing live
Cash to close
- Down payment
- $32,500
- Closing costs
- $3,900
- Reserves months
- —
- Total cash needed
- —
Loan-product check · same deal, 3 products live
Conventional
25% down · 7.5% · 30yr
- Down + closing
- —
- Monthly P&I
- —
- Monthly cashflow
- —
- DSCR
- —
- Eligible?
- —
Personal DTI + credit; lowest rate.
DSCR
20% down · 8.5% · 30yr
- Down + closing
- —
- Monthly P&I
- —
- Monthly cashflow
- —
- DSCR
- —
- Eligible?
- —
No personal income docs; deal must DSCR.
Hard money
10% down · 12.0% · 12mo
- Down + closing
- —
- Monthly P&I
- —
- Monthly cashflow
- —
- DSCR
- —
- Eligible?
- —
Short-term bridge; refi at stabilization.
Rent comps 20 comps
| Address | Beds | Baths | Sqft | Rent | $/sqft | DOM | Units | Dist |
|---|---|---|---|---|---|---|---|---|
| 27067 Lawnwood St Roseville, MI | 3.0 | 1.0 | 960 | $1,500 | $1.56 | 43d | 1 | 0.49mi |
| 27547 O Neil Roseville, MI | 3.0 | 1.0 | 1014 | $1,350 | $1.33 | 4d | 1 | 0.74mi |
| 26251 Pinehurst St Unit 251d Roseville, MI | 2.0 | 1.0 | 1000 | $1,200 | $1.20 | 43d | 1 | 0.76mi |
| 26221 Pinehurst St Roseville, MI | 2.0 | 1.0 | 1000 | $1,200 | $1.20 | 1d | 1 | 0.77mi |
| 18635 Meier St Unit : Back Roseville, MI | 2.0 | 1.0 | 900 | $1,100 | $1.22 | 24d | 1 | 0.83mi |
| 27881 O Neil Roseville, MI | 3.0 | 1.0 | 1300 | $1,300 | $1.00 | 24d | 1 | 0.91mi |
| 17639 Oakdale St Roseville, MI | 2.0 | 1.0 | 812 | $1,200 | $1.48 | 44d | 1 | 1.00mi |
| 17392 Tennyson St Roseville, MI | 3.0 | 1.0 | 900 | $1,649 | $1.83 | 2d | 1 | 1.19mi |
| 16944 E 11 Mile Rd Unit C2 Roseville, MI | 2.0 | 1.0 | 900 | $1,295 | $1.44 | 24d | 1 | 1.21mi |
| 17405 Ivanhoe St Roseville, MI | 3.0 | 1.0 | 969 | $1,600 | $1.65 | 43d | 1 | 1.23mi |
| 26324 Harper Unit 4 St Clair Shores, MI | 2.0 | 1.0 | 700 | $1,195 | $1.71 | 24d | 1 | 1.27mi |
| 26324 Harper Ave Unit 6 St Clair Shores, MI | 3.0 | 1.0 | 1100 | $1,345 | $1.22 | 24d | 1 | 1.28mi |
| 16840 E 11 Mile Rd Unit 109 Roseville, MI | 2.0 | 1.0 | 900 | $1,400 | $1.56 | 43d | 1 | 1.28mi |
| 16840 E Eleven Mile Rd Unit 103 Roseville, MI | 2.0 | 1.0 | 900 | $1,250 | $1.39 | 43d | 1 | 1.28mi |
| 16840 E Eleven Mile Rd Unit 104 Roseville, MI | 2.0 | 1.0 | 900 | $1,200 | $1.33 | 43d | 1 | 1.28mi |
| 16840 E Eleven Mile Rd Roseville, MI | 2.0 | 1.0 | 900 | $1,300 | $1.44 | 24d | 3 | 1.28mi |
| 16840 E Eleven Mile Rd Roseville, MI | 2.0 | 1.0 | 900 | $1,300 | $1.44 | 21d | 3 | 1.28mi |
| 18410 Tranquil St Roseville, MI | 3.0 | 1.0 | 1140 | $1,800 | $1.58 | 14d | 1 | 1.40mi |
| 18410 Tranquil St Roseville, MI | 3.0 | 1.0 | 1140 | $1,800 | $1.58 | 43d | 1 | 1.40mi |
| 23005 Kelly Rd Eastpointe, MI | 2.0 | 1.0 | 850 | $1,250 | $1.47 | 23d | 1 | 1.46mi |
Listing history 20 events
-
2026-05-04status Pending 185-char remark
Show marketing remark (185 chars)
* TENANT OCCUPIED HOME * This 3 bedroom Bungalow located in Roseville offers a large kitchen and dining area. Full Basement. Tenant since 2020, currently month to month paying $1,397.
-
2026-05-04status Pending 185-char remark
Show marketing remark (185 chars)
* TENANT OCCUPIED HOME * This 3 bedroom Bungalow located in Roseville offers a large kitchen and dining area. Full Basement. Tenant since 2020, currently month to month paying $1,397.
-
2026-05-04status Pending
Show marketing remark (185 chars)
* TENANT OCCUPIED HOME * This 3 bedroom Bungalow located in Roseville offers a large kitchen and dining area. Full Basement. Tenant since 2020, currently month to month paying $1,397.
-
2026-04-02status Active 185-char remark
Show marketing remark (185 chars)
* TENANT OCCUPIED HOME * This 3 bedroom Bungalow located in Roseville offers a large kitchen and dining area. Full Basement. Tenant since 2020, currently month to month paying $1,397.
-
2026-04-02status Active 185-char remark
Show marketing remark (185 chars)
* TENANT OCCUPIED HOME * This 3 bedroom Bungalow located in Roseville offers a large kitchen and dining area. Full Basement. Tenant since 2020, currently month to month paying $1,397.
-
2026-04-02status Active
Show marketing remark (185 chars)
* TENANT OCCUPIED HOME * This 3 bedroom Bungalow located in Roseville offers a large kitchen and dining area. Full Basement. Tenant since 2020, currently month to month paying $1,397.
-
2026-02-10status Pending 185-char remark
Show marketing remark (185 chars)
* TENANT OCCUPIED HOME * This 3 bedroom Bungalow located in Roseville offers a large kitchen and dining area. Full Basement. Tenant since 2020, currently month to month paying $1,397.
-
2026-02-10status Pending 185-char remark
Show marketing remark (185 chars)
* TENANT OCCUPIED HOME * This 3 bedroom Bungalow located in Roseville offers a large kitchen and dining area. Full Basement. Tenant since 2020, currently month to month paying $1,397.
-
2026-02-10status Pending
Show marketing remark (185 chars)
* TENANT OCCUPIED HOME * This 3 bedroom Bungalow located in Roseville offers a large kitchen and dining area. Full Basement. Tenant since 2020, currently month to month paying $1,397.
-
2026-01-12$130,000 Active 185-char remark
Show marketing remark (185 chars)
* TENANT OCCUPIED HOME * This 3 bedroom Bungalow located in Roseville offers a large kitchen and dining area. Full Basement. Tenant since 2020, currently month to month paying $1,397.
-
2026-01-12$130,000 Active 185-char remark
Show marketing remark (185 chars)
* TENANT OCCUPIED HOME * This 3 bedroom Bungalow located in Roseville offers a large kitchen and dining area. Full Basement. Tenant since 2020, currently month to month paying $1,397.
-
2026-01-12$130,000 Active
Show marketing remark (185 chars)
* TENANT OCCUPIED HOME * This 3 bedroom Bungalow located in Roseville offers a large kitchen and dining area. Full Basement. Tenant since 2020, currently month to month paying $1,397.
-
2014-11-18soldstatus $875
-
2014-11-06historical
-
2014-07-29$825
-
2014-05-06soldstatus $39,000
-
2014-05-06soldstatus $39,000
-
2014-04-17historical
-
2014-03-31$44,900
-
2014-03-31$44,900
ⓘ Source: listings_history table (triggers on properties + properties_extension) + one-shot
backfill from property_details.listing_events for pre-trigger history.
Tax reassessment forecast MI · Partial reset (capped growth)
- Current annual tax
- $3,362 · $280/mo
- Projected year-2 tax
- $3,362 · $280/mo
- Expected delta
- $0/yr ($0/mo · 0.0%)
ⓘ Screening estimate from a state-policy table — verify with the county assessor before closing.
Climate risk First Street
- Flood 1/10 Low FEMA zone X (unshaded) · 0% chance over 30 yrs
- Wildfire 1/10 Low
- Heat 3/10 Moderate 7 d/yr ≥96°F today · 15 d/yr by 30 yrs out
- Wind 1/10 Low
- Air quality 4/10 Moderate 4 unhealthy d/yr today · 5 by 30 yrs out
Nearby sold comps map
Loading sold comps map…
Walkable amenities ~0.75 mi
Loading nearby amenities…
Taxation est. · year 1
- Rental income
- $17,111
- − Mortgage interest
- −$7,282
- − Property taxes
- −$3,362
- − Insurance
- −$650
- − Repairs & maintenance
- −$1,369
- − Management
- −$1,369
- − Depreciation
- −$3,782
- Taxable loss
- −$703
- Est. tax savings @ 24.0%
- +$169
- After-tax cash flow
- $1,493/yr
For passive investors: Depreciation is non-cash, so a rental often shows a tax loss while cash-flowing — sheltering income. Rental losses are passive: they offset passive income freely, and up to $25,000/yr can offset ordinary (W-2) income if you actively participate and your MAGI is under $100k (phasing out to $0 by $150k); unused losses carry forward. On sale, claimed depreciation is recaptured at up to 25%, and gains may owe capital-gains tax (a 1031 exchange can defer both). Figures are a year-1 estimate at your 24.0% rate — not tax advice; consult a CPA.
Schools (NCES district)
- District
- Roseville Community Schools
- NCES district ID
- 2630210
- Math proficiency
- 11% ▼ -8.00%
- Reading proficiency
- 24% ▼ -7.00%
- Median HH income
- $41,590
- Composite
- 14.98/100
- National rank
- #9363
- State rank
- #483 of 540 in MI
Livability — Roseville
- Score
- 72/100
- State rank
- #258
- US rank
- #6400
Category grades
Schools grade is shown separately in the Schools card above.
Census & demographics
- Census place
- Roseville, MI
- County
- Macomb County · 638,552 people
- City population
- 47,123
- Metro
- Detroit-Warren-Dearborn, MI
- Population (ZIP)
- 47,123
- Household income
- $62,182
- Rent vs Own
- Severe rent burden
- 1712.0
Population outlook (Macomb County) Hauer SSP2
- Today (2025)
- 925,296 people
- By 2030
- 948,226 · +2.5%
- By 2040
- 983,961 · +6.3%
- By 2050
- 1,010,200 · +9.2%
- By 2075
- 1,076,222 · +16.3%
- By 2100
- 1,077,065 · +16.4%
Race, ethnicity, and origin ACS 2023
- Neighborhood character
- Predominantly White (65%)
- Race & ethnicity
- White 65% Black 23% Two or more races 7% Hispanic / Latino 4% Asian 2%
- Common ancestry
- Romanian 12% Lithuanian 4% Slovak 2%
- Foreign-born
- 5% · Canada
- Languages at home
- 93% English-only · Spanish 2% Russian/Polish/Slavic 1% Other Indo-European 1%
Political lean MEDSL · Macomb
- 2024 margin
- R (+13.7) · D 42.2% · R 55.9% · Other 1.9%
- 2008→2024 swing
- -22.3pp toward R · 2008: 8.6pp · 2024: -13.7pp
- All cycles
- 2024: R+13.7 2020: R+8.1 2016: R+11.6 2012: D+4.0 2008: D+8.6
Not yet ingested
- Civics
- —
Market trends
- HPI YoY
- ▼ -232.95%
- Current HPI
- 217.4171
- Rent YoY
- ▲ 0.39%
- Metro
- Detroit-Warren-Dearborn, MI
- State GDP YoY
- ▲ 1.37%
- F500 in state
- 28
Industry mix (Fortune 500 HQ in MI)
| Industry | F500 HQs | Revenue |
|---|---|---|
| Automotive Parts | 3 | $48B |
|
||
| Automotive | 2 | $372B |
|
||
| Chemicals | 1 | $45B |
|
||
| Automotive Retail | 1 | $29B |
|
||
| Healthcare / Medical Devices | 1 | $23B |
|
||
| Automotive Technology | 1 | $20B |
|
||
Price history
+189.5% since first listed20 events — show timeline
- 2026-05-04 Pending — REALCOMP
- 2026-05-04 Pending — MiRealSource-MiMLS
- 2026-05-04 Pending — SW Michigan MLS
- 2026-04-02 Relisted — MiRealSource-MiMLS
- 2026-04-02 Relisted — REALCOMP
- 2026-04-02 Relisted — SW Michigan MLS
- 2026-02-10 Pending — REALCOMP
- 2026-02-10 Pending — MiRealSource-MiMLS
- 2026-02-10 Pending — SW Michigan MLS
- 2026-01-12 Listed $130,000 REALCOMP
- 2026-01-12 Listed $130,000 SW Michigan MLS
- 2026-01-12 Listed $130,000 MiRealSource-MiMLS
- 2014-11-18 Sold (MLS) $875 MiRealSource-MiMLS
- 2014-11-06 Listing Removed — MiRealSource-MiMLS
- 2014-07-29 Listed $825 MiRealSource-MiMLS
- 2014-05-06 Sold (MLS) $39,000 MiRealSource-MiMLS
- 2014-05-06 Sold (MLS) $39,000 REALCOMP
- 2014-04-17 Listing Removed — MiRealSource-MiMLS
- 2014-03-31 Listed $44,900 MiRealSource-MiMLS
- 2014-03-31 Listed $44,900 REALCOMP
Property tax history
+10.3%/yrLatest (2025): $3,362 · +4.0% YoY. Source: county tax records.
Cash-flow waterfall
monthlySold comps — $/sqft
last 12 mo · ≤1 miLoading sold comps…