 Multi-family
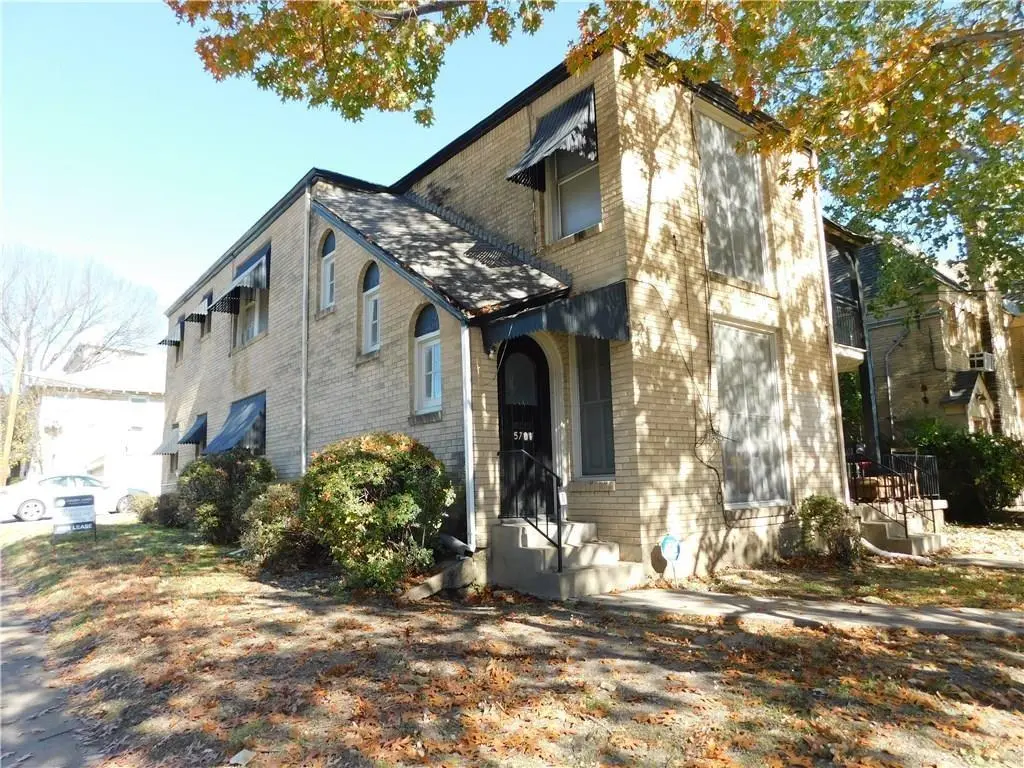
5701 Ross Ave · Dallas, TX
Flood risk 1/10 · Minimal
- FEMA flood zone
- X (unshaded)
- Chance of flooding over 30 yrs
- 0.0%
- Est. flood insurance / yr
- $507 – $1,088
Fire risk 1/10 · Minimal
- Est. fire insurance / yr
- $1,222 – $2,270
Heat risk 7/10 · Major
- Hot days now (above 109°F)
- 7 days/yr
- Hot days in 30 yrs
- 23 days/yr
Wind risk 6/10 · Moderate
- Chance of severe wind over 30 yrs
- 27.0%
Air-quality risk 3/10 · Minor
- Unhealthy air days now
- 2 days/yr
- Unhealthy air days in 30 yrs
- 3 days/yr
Risk factors via First Street. Map © Google.
Why this score? — see what drove the C grade
The composite is a weighted blend of 9 inputs, each scored 0–100. Each bar is that input's sub-score; the figure is the points it added to the 100-point composite (weight × sub-score).
- Cash flow +19.8/30.0
- ARV discount +15.0/15.0
- DSCR +6.3/10.0
- 1% rule +5.7/10.0
- Livability +4.0/5.0
- Rent growth +2.8/5.0
- Schools +2.8/10.0
- Condition / age +2.5/5.0
- Appreciation +0.0/10.0
$579,000
🖨 Deal sheet 📄 Offer letter ✓ Due diligence
Multi-family units
County records classify this as Multi-Family (2-4 Unit). Listing-text estimate: 1 unit. estimate disagrees with records
Key facts
- 6,882 sq ft lot
- 2 garage spots
- Built 1935
Neighborhood map
What this means for you Summary
Snapshot
- This is a 4-bed/2.0-bath multifamily listed at $579k.
Deal economics
- At list price, monthly cash flow is $693 ($8k/yr) — positive.
- The deal already cash-flows at list — no discount required.
- Meets the 1% rule at list price ($6k rent vs $579k).
- Cap rate 7.7% vs local median 2.3% in Dallas — top-decile yield for the area; either an underpriced asset or a hidden risk that comps aren't pricing in. Stress-test before assuming the spread holds.
Location & tenants
- Location reads 81/100 on livability (#24 in TX, #1,380 nationally) — a professional / high-income tenant draw. Strengths: amenities A+, commute A+, housing A+; Watch: crime F.
- Dallas ISD (urban): math 31% / reading 36% proficiency, ranked #559 of 826 in TX (top 68%) — families likely to look elsewhere, expect single-tenant / working-renter base with shorter leases; 83% free/reduced lunch — lower-income household profile, screen leases tightly.
- Zoned schools: Geneva Heights El (math 37% / reading 47%, grade F, #1,335 of 4,322 statewide, top 33%, 341 students, 46% FRL) — zoned schools average 46% FRL vs 83% district-wide (37 pts lower); this property's tenant base skews higher-income than the district average.
- Market conditions: Rents rising (+1.3%/yr); 330 active listings in the ZIP; 40 comparable units currently listed for rent nearby; rentals lingering (median 44d on market — plan ~5-8 weeks vacancy on turnover, expect pricing pressure); 50% of comp listings sitting > 30 days — soft ceiling on asking rent; solid renter incomes; 12,577 units permitted in Dallas County in 2024 (6,829 in 5+ unit buildings).
- At $6,219/mo this rent would consume 82% of the median local household income ($91k/yr) (locally 2983% of renters already pay >50% of income on rent) — very limited rent-growth headroom before tenants either downsize or default.
Forward outlook
- Local home prices are declining (-3.0%/yr); year-one equity from $4k of loan paydown is wiped out by about $17k of value loss. Plan a longer hold.
- Dallas County population projected at +35% by 2050 — long-run rental-demand tailwind backs the buy-and-hold thesis.
Negotiation context
- Only 1 days on market — expect competitive offers; lowballing is unlikely to land.
Risks & watch-outs
- Watch-outs: built in 1935 — expect roof / HVAC / electrical / plumbing capex.
- Climate carrying-cost: major wind risk, 27% chance of damaging wind over 30y; extreme-heat days projected 7→23/yr by 2055 (HVAC capex compounding) — expect insurance premiums to compound above CPI over the hold.
Questions for the listing agent
- Built in 1935 — when were the roof, HVAC, electrical panel, plumbing, and water heater last replaced?
- Is there a deadline driving the sale (1031 exchange, divorce, estate, relocation)? That informs how much negotiation room exists.
- Crime grade is F in this area — have there been break-ins, vandalism, or insurance claims at this property in the last 3 years? What carrier currently insures it and at what premium?
- What's the average days-on-market for RENTAL listings here right now (not sales)? A rising rental-DOM trend means longer vacancies and softer asking-rent achievability than the comps imply.
- What's the recent tenant-quality profile in this submarket — average credit score on applications, eviction rate, late-payment / NSF rate, and stable-employment percentage? A property-management company in the area should have these aggregated.
- How much new apartment / multifamily construction is in the pipeline within 1–3 miles? Heavy new supply (>2% of stock underway) typically softens rents 12–24 months out; light construction supports rent growth.
Investment metrics
- 1% rule
- 1.07% ✓
- Cap rate
- 7.73%
- Cash-on-cash
- 5.13%
- DSCR
- 1.23
- GRM
- 7.8
CMA / ARV
- ARV (on-the-fly)
- $858,648
- Comps found
- 2
Show comp detail 2 sales within ~0.75 mi
| Address | Dist | Beds/Ba | Sqft | Sold | Price | $/sf | Match |
|---|---|---|---|---|---|---|---|
| 5701 Ross Ave | 0.00mi | 4/2.0 | 3,228 (0%) | 1mo | $579,000 | $179 | 99 |
| 6009 Lewis St | 0.29mi | 4/4.0 | 3,200 (-1%) | 16mo | $850,000 | $266 | 64 |
Match score weights: distance 35% · size 25% · config 20% · recency 20%. Top-matched comps best support the ARV.
Projected returns pro-forma
-3.0% appreciation · 1.26% rent growth · sell at horizon
- IRR
- -10.4%
- Equity multiple
- 0.63×
- Total profit
- $-60,139
- Equity at exit
- $86,331
- IRR
- -3.7%
- Equity multiple
- 0.77×
- Total profit
- $-36,988
- Equity at exit
- $50,061
Cash invested: $162,120 (down + closing). Projections, not guarantees.
Landlord ↔ Tenant lean methodology
- Overall (STATE)
- 87 Strongly Landlord-Friendly
- State Texas
- 87 Strongly Landlord-Friendly · R+5
- County
- — inherits STATE
- City
- — inherits STATE
ZIP-level market 75206
- Rents YoY
- 1.3%
- Active inventory
- 330
- Price-to-rent
- 15.5×
Monthly cashflow live
- Estimated rent
- $6,219 high interval (Pro) →
- Mortgage (P&I)
- −$3,036
- Tax from tax record
- −$942 /mo · $11,305/yr
- Insurance
- −$241
- HOA
- −$0
- Vacancy / Maint / Mgmt
- −$1,306
- Net cashflow
- $693
Break-even live
2-unit breakdown (identical units grouped — click to expand)
| Units | Beds | Baths | Est. rent |
|---|---|---|---|
| 2× units | 2 | 1 | $6,220 |
| #1 | 2 | 1 | $3,110 |
| #2 | 2 | 1 | $3,110 |
| Total (2 units) | $6,219 | ||
UW: 25.0% down · 7.5% · 30yr · 1.5% tax · 5.0% vac · 8.0% maint · 8.0% mgmt
Financing live
Cash to close
- Down payment
- $144,750
- Closing costs
- $17,370
- Reserves months
- —
- Total cash needed
- —
Loan-product check · same deal, 3 products live
Conventional
25% down · 7.5% · 30yr
- Down + closing
- —
- Monthly P&I
- —
- Monthly cashflow
- —
- DSCR
- —
- Eligible?
- —
Personal DTI + credit; lowest rate.
DSCR
20% down · 8.5% · 30yr
- Down + closing
- —
- Monthly P&I
- —
- Monthly cashflow
- —
- DSCR
- —
- Eligible?
- —
No personal income docs; deal must DSCR.
Hard money
10% down · 12.0% · 12mo
- Down + closing
- —
- Monthly P&I
- —
- Monthly cashflow
- —
- DSCR
- —
- Eligible?
- —
Short-term bridge; refi at stabilization.
Rent comps 40 comps
| Address | Beds | Baths | Sqft | Rent | $/sqft | DOM | Units | Dist |
|---|---|---|---|---|---|---|---|---|
| 5713 Lewis St Dallas, TX | 3.0 | 3.0 | 2401 | $3,950 | $1.65 | 7d | 1 | 0.09mi |
| 1907 Summit Ave #3 Dallas, TX | 3.0 | 3.0 | 2168 | $4,500 | $2.08 | 3d | 1 | 0.32mi |
| 1847 Euclid Ave Dallas, TX | 3.0 | 2.5 | 2811 | $5,595 | $1.99 | 43d | 1 | 0.36mi |
| 6028 Richmond Ave Dallas, TX | 5.0 | 5.5 | 4300 | $14,000 | $3.26 | 43d | 1 | 0.46mi |
| 5425 Melrose Ave Dallas, TX | 3.0 | 3.5 | 2683 | $6,500 | $2.42 | 11d | 1 | 0.58mi |
| 5413 Melrose Ave Dallas, TX | 3.0 | 4.0 | 2987 | $7,250 | $2.43 | 24d | 1 | 0.60mi |
| 4954 Camdale Ct Dallas, TX | 3.0 | 3.5 | 2392 | $5,200 | $2.17 | 6d | 1 | 0.65mi |
| 1952 Kearney Ct Dallas, TX | 3.0 | 3.5 | 2178 | $4,700 | $2.16 | 6d | 1 | 0.78mi |
| 2011 Kirby St #105 Dallas, TX | 3.0 | 3.5 | 2530 | $4,390 | $1.74 | 43d | 1 | 0.79mi |
| 6255 Belmont Ave Dallas, TX | 5.0 | 5.5 | 3397 | $8,750 | $2.58 | 7d | 1 | 0.81mi |
| 1514 Holly Ave Dallas, TX | 3.0 | 3.5 | 2826 | $5,250 | $1.86 | 7d | 1 | 0.85mi |
| 4602 Sycamore St Dallas, TX | 4.0 | 3.5 | 3000 | $6,790 | $2.26 | 43d | 1 | 0.86mi |
| 6313 Belmont Ave Dallas, TX | 4.0 | 3.0 | 2698 | $6,500 | $2.41 | 24d | 1 | 0.86mi |
| 2324 Kirby St Dallas, TX | 3.0 | 3.5 | 2754 | $6,500 | $2.36 | 19d | 1 | 0.89mi |
| 5247 Richard Ave Dallas, TX | 3.0 | 3.0 | 2176 | $5,300 | $2.44 | 11d | 1 | 0.93mi |
| 1910 N Carroll Ave Dallas, TX | 3.0 | 2.0 | 2448 | $2,550 | $1.04 | 20d | 1 | 0.94mi |
| 1910 N Carroll Ave Dallas, TX | 3.0 | 2.0 | 2448 | $2,995 | $1.22 | 43d | 1 | 0.94mi |
| 4814 Manett St Dallas, TX | 3.0 | 2.5 | 2649 | $3,895 | $1.47 | 43d | 1 | 0.94mi |
| 4315 San Jacinto St Unit 101 Dallas, TX | 3.0 | 3.5 | 2700 | $3,900 | $1.44 | 43d | 1 | 1.01mi |
| 4602 Weldon St Dallas, TX | 3.0 | 2.5 | 2502 | $5,250 | $2.10 | 24d | 1 | 1.04mi |
| 4511 Junius St Dallas, TX | 3.0 | 3.5 | 2400 | $3,000 | $1.25 | 14d | 1 | 1.04mi |
| 4303 Roseland Ave Dallas, TX | 4.0 | 4.0 | 2436 | $6,950 | $2.85 | 17d | 1 | 1.05mi |
| 2315 N Carroll Ave Dallas, TX | 3.0 | 3.0 | 2425 | $4,195 | $1.73 | 43d | 1 | 1.06mi |
| 4525 Weldon St Dallas, TX | 4.0 | 3.5 | 3395 | $8,995 | $2.65 | 43d | 1 | 1.08mi |
| 5017 Milam St Dallas, TX | 4.0 | 3.0 | 3586 | $12,000 | $3.35 | 43d | 1 | 1.16mi |
| 4119 Munger Ave Dallas, TX | 3.0 | 3.5 | 2341 | $4,399 | $1.88 | 43d | 1 | 1.17mi |
| 1005 Cavour Pl Unit 1 Dallas, TX | 3.0 | 3.5 | 2492 | $4,485 | $1.80 | 43d | 1 | 1.19mi |
| 402 S Henderson Ave Dallas, TX | 4.0 | 4.0 | 2200 | $4,250 | $1.93 | 24d | 1 | 1.19mi |
| 4526 Reiger Ave Dallas, TX | 4.0 | 2.5 | 2728 | $3,000 | $1.10 | 24d | 1 | 1.22mi |
| 4007 Brownstone Ct Dallas, TX | 3.0 | 3.5 | 2413 | $4,800 | $1.99 | 43d | 1 | 1.23mi |
| 317 Alcalde St Unit 1018276P Dallas, TX | 4.0 | 2.5 | 2292 | $22,489 | $9.81 | 24d | 1 | 1.28mi |
| 4005 Gaston Ave Dallas, TX | 3.0 | 3.5 | 3400 | $8,000 | $2.35 | 43d | 1 | 1.33mi |
| 4005 Gaston Ave Ph 1 Dallas, TX | 3.0 | 3.5 | 3600 | $12,000 | $3.33 | 43d | 1 | 1.33mi |
| 3816 Roseland Ave Unit A200 Dallas, TX | 3.0 | 2.5 | 2150 | $3,950 | $1.84 | 15d | 1 | 1.34mi |
| 5527 McCommas Blvd Dallas, TX | 4.0 | 3.0 | 3121 | $9,500 | $3.04 | 24d | 1 | 1.36mi |
| 1323 Saint Joseph St #19 Dallas, TX | 3.0 | 3.0 | 2150 | $2,750 | $1.28 | 43d | 1 | 1.37mi |
| 5227 Lindsley Ave Dallas, TX | 3.0 | 2.5 | 2250 | $3,999 | $1.78 | 43d | 1 | 1.43mi |
| 5517 Longview St Dallas, TX | 3.0 | 3.5 | 2681 | $5,995 | $2.24 | 43d | 1 | 1.43mi |
| 5552 Martel Ave Dallas, TX | 3.0 | 2.5 | 2735 | $5,500 | $2.01 | 43d | 1 | 1.44mi |
| 3030 Monticello Ave Unit 1201 Dallas, TX | 3.0 | 3.5 | 3395 | $24,000 | $7.07 | 43d | 1 | 1.46mi |
Listing history 2 events
-
2026-04-06status Pending
-
2026-03-10$579,000 Active
ⓘ Source: listings_history table (triggers on properties + properties_extension) + one-shot
backfill from property_details.listing_events for pre-trigger history.
Tax reassessment forecast TX · Resets to sale price
- Current annual tax
- $11,305 · $942/mo
- Projected year-2 tax
- $11,305 · $942/mo
- Expected delta
- $0/yr ($0/mo · 0.0%)
ⓘ Screening estimate from a state-policy table — verify with the county assessor before closing.
Climate risk First Street
- Flood 1/10 Low FEMA zone X (unshaded) · 0% chance over 30 yrs
- Wildfire 1/10 Low
- Heat 7/10 Severe 7 d/yr ≥109°F today · 23 d/yr by 30 yrs out
- Wind 6/10 Major 27% chance of damaging wind over 30 yrs
- Air quality 3/10 Moderate 2 unhealthy d/yr today · 3 by 30 yrs out
Nearby sold comps map
Loading sold comps map…
Walkable amenities ~0.75 mi
Loading nearby amenities…
Taxation est. · year 1
- Rental income
- $74,628
- − Mortgage interest
- −$32,433
- − Property taxes
- −$11,305
- − Insurance
- −$2,895
- − Repairs & maintenance
- −$5,970
- − Management
- −$5,970
- − Depreciation
- −$16,844
- Taxable loss
- −$789
- Est. tax savings @ 24.0%
- +$189
- After-tax cash flow
- $8,509/yr
For passive investors: Depreciation is non-cash, so a rental often shows a tax loss while cash-flowing — sheltering income. Rental losses are passive: they offset passive income freely, and up to $25,000/yr can offset ordinary (W-2) income if you actively participate and your MAGI is under $100k (phasing out to $0 by $150k); unused losses carry forward. On sale, claimed depreciation is recaptured at up to 25%, and gains may owe capital-gains tax (a 1031 exchange can defer both). Figures are a year-1 estimate at your 24.0% rate — not tax advice; consult a CPA.
Schools (NCES district)
- District
- Dallas ISD
- NCES district ID
- 4816230
- Math proficiency
- 31% ▼ -16.00%
- Reading proficiency
- 36% ▼ -4.00%
- Median HH income
- $42,881
- Composite
- 28.41/100
- National rank
- #6763
- State rank
- #559 of 826 in TX
Livability — Dallas
- Score
- 81/100
- State rank
- #24
- US rank
- #1380
Category grades
Schools grade is shown separately in the Schools card above.
Census & demographics
- Census place
- Dallas, TX
- County
- Dallas County · 2,612,404 people
- City population
- 1,168,437
- Metro
- Dallas-Fort Worth-Arlington, TX
- Population (ZIP)
- 38,909
- Household income
- $91,023
- Rent vs Own
- Severe rent burden
- 2983.0
Population outlook (Dallas County) Hauer SSP2
- Today (2025)
- 2,979,839 people
- By 2030
- 3,191,823 · +7.1%
- By 2040
- 3,619,611 · +21.5%
- By 2050
- 4,026,915 · +35.1%
- By 2075
- 4,957,073 · +66.4%
- By 2100
- 5,508,725 · +84.9%
Race, ethnicity, and origin ACS 2023
- Neighborhood character
- Diverse neighborhood (Simpson 0.55)
- Race & ethnicity
- White 64% Hispanic / Latino 14% Two or more races 10% Asian 9% Black 8%
- Hispanic origin (detail)
- Mexican 10%
- Common ancestry
- Lithuanian 3% Slovak 3% Romanian 2%
- Foreign-born
- 14% · Canada, China, South Korea
- Languages at home
- 81% English-only · Spanish 9% Other Indo-European 4% Chinese 1%
Political lean MEDSL · Dallas
- 2024 margin
- Strong D (+22.2) · D 60.2% · R 38.0% · Other 1.8%
- 2008→2024 swing
- +6.9pp toward D · 2008: 15.3pp · 2024: 22.2pp
- All cycles
- 2024: D+22.2 2020: D+31.6 2016: D+26.2 2012: D+15.4 2008: D+15.3
Not yet ingested
- Civics
- —
Market trends
- HPI YoY
- ▼ -852.92%
- Current HPI
- 302.4367
- Rent YoY
- ▲ 1.26%
- Metro
- Dallas-Fort Worth-Arlington, TX
- State GDP YoY
- ▲ 3.95%
- F500 in state
- 110
Industry mix (Fortune 500 HQ in TX)
| Industry | F500 HQs | Revenue |
|---|---|---|
| Energy | 16 | $1,198B |
|
||
| Technology | 5 | $198B |
|
||
| Engineering / Construction | 4 | $72B |
|
||
| Energy Services | 3 | $60B |
|
||
| Utilities | 3 | $41B |
|
||
| Healthcare | 2 | $330B |
|
||
Price history
2 events — show timeline
- 2026-04-06 Pending — NTREIS
- 2026-03-10 Listed $579,000 NTREIS
Property tax history
+6.1%/yrLatest (2025): $11,305 · -12.3% YoY. Source: county tax records.
Cash-flow waterfall
monthlySold comps — $/sqft
last 12 mo · ≤1 miLoading sold comps…