0 Cass · Blakesburg, IA
Flood risk 1/10 · Minimal
- FEMA flood zone
- X (unshaded)
- Chance of flooding over 30 yrs
- 0.0%
- Est. flood insurance / yr
- $507 – $1,088
Fire risk 3/10 · Minor
- Est. fire insurance / yr
- $902 – $1,676
Heat risk 3/10 · Minor
- Hot days now (above 104°F)
- 7 days/yr
- Hot days in 30 yrs
- 15 days/yr
Wind risk 2/10 · Minimal
- Chance of severe wind over 30 yrs
- —
Air-quality risk 2/10 · Minimal
- Unhealthy air days now
- 1 days/yr
- Unhealthy air days in 30 yrs
- 1 days/yr
Risk factors via First Street. Map © Google.
Why this score? — see what drove the B+ grade
The composite is a weighted blend of 9 inputs, each scored 0–100. Each bar is that input's sub-score; the figure is the points it added to the 100-point composite (weight × sub-score).
- Cash flow +30.0/30.0
- 1% rule +10.0/10.0
- DSCR +10.0/10.0
- ARV discount +7.5/15.0
- Appreciation +6.0/10.0
- Schools +4.9/10.0
- Livability +3.1/5.0
- Rent growth +2.5/5.0
- Condition / age +2.2/5.0
$55,000
🖨 Deal sheet 📄 Offer letter ✓ Due diligence
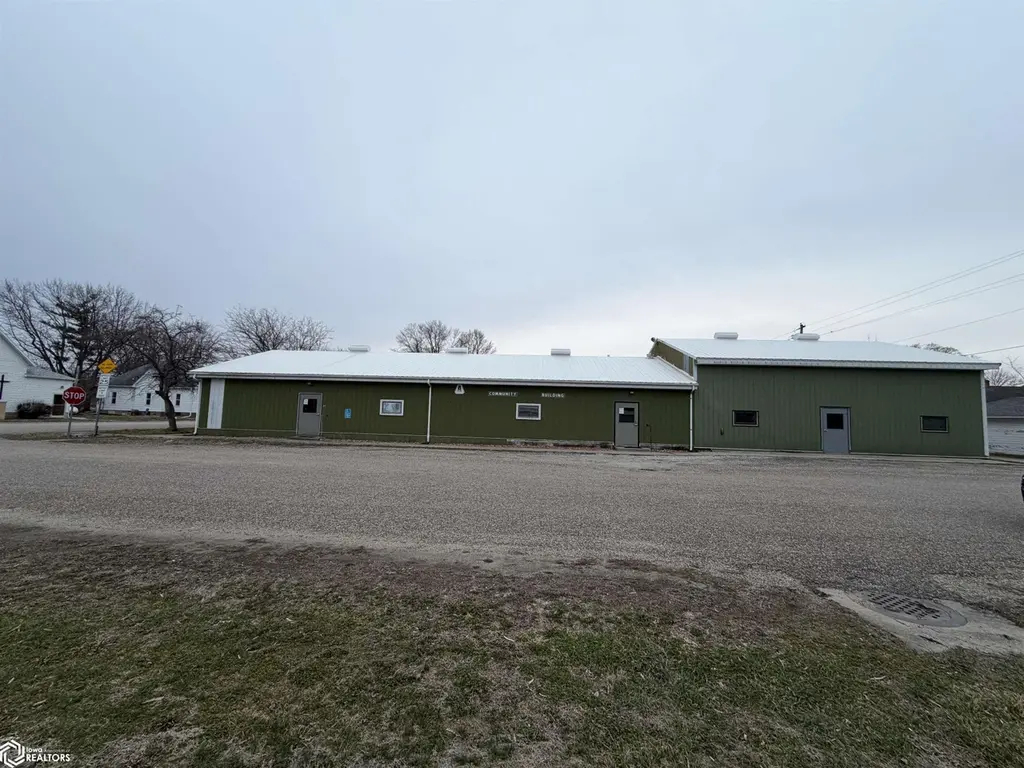
Listing remarks
Spacious and versatile community building offering incredible potential for residential conversion! This unique property can be transformed into a single-family home or thoughtfully designed into two separate apartments, providing flexibility for a variety of living or investment opportunities. Featuring a large commercial-style kitchen with 2 stoves, the space is ideal for entertaining or reimagining into a stunning open-concept living area. The property includes 3 half bathrooms and expansive open areas ready to be customized to fit your vision. There is a small area behind the building approximately 5' x 40' and 9'6" x 50' of grassy area. With solid structure and generous square foo
Key facts
- Expansive open areas
- 6,098 sq ft lot
- Built 1980
Tags
Property features AI
Finance
- Other: Directions: T61 to Cass or Hickory to Cass
- Financial info: Annual tax listed (see broker) $1,651
Exterior
- Parking: Outside parking on gravel
- Utilities: Public water; Public sewer
- Home design: Single-family residence; Residential property
- Construction: Metal siding construction
- Exterior features: Metal roof; Metal siding; Lot about 0.14 acres (approx. 47 x 132)
Interior
- Kitchen: Range; Refrigerator
- Bathrooms: Three half bathrooms
- Interior features: Range; Refrigerator; Central air; Forced air heating
Neighborhood map
What this means for you Summary
Snapshot
- This is a 2-bed/1.5-bath single-family listed at $55k. Condition is rated fair.
Deal economics
- At list price, monthly cash flow is $473 ($6k/yr) — positive.
- The deal already cash-flows at list — no discount required.
- Meets the 1% rule at list price ($1k rent vs $55k).
Location & tenants
- Location reads 61/100 on livability (#766 in IA) — a middle-class / working-renter tenant base. Strengths: cost of living A+, housing A+; Watch: amenities F, commute F, employment F.
- Eddyville-Blakesburg- Fremont CSD (rural): math 58% / reading 57% proficiency, ranked #253 of 289 in IA (top 88%) — acceptable for families but not a draw, mixed tenant base, ~2y average lease.
- Market conditions: 4 active listings in the ZIP; 44 units permitted in Wapello County in 2024 (0 in 5+ unit buildings).
Forward outlook
- In year one you build about $1k of equity ($380 loan paydown + $1k appreciation (2.0% local appreciation)).
- Wapello County population projected at +5% by 2050 — modest demand growth; plan on rents tracking national, not racing it.
- At projected returns (2.0% appreciation + 3.0% rent growth), your $15k cash investment doubles in ~3 years — after that, you're playing with house money.
Negotiation context
- Only 9 days on market — expect competitive offers; lowballing is unlikely to land.
Questions for the listing agent
- Have any recent inspections been done? Can we get a copy of the seller's disclosures and any deferred-maintenance estimates?
- Is there a deadline driving the sale (1031 exchange, divorce, estate, relocation)? That informs how much negotiation room exists.
- What's the average days-on-market for RENTAL listings here right now (not sales)? A rising rental-DOM trend means longer vacancies and softer asking-rent achievability than the comps imply.
- What's the recent tenant-quality profile in this submarket — average credit score on applications, eviction rate, late-payment / NSF rate, and stable-employment percentage? A property-management company in the area should have these aggregated.
- How much new for-sale + rental construction is in the pipeline within 1–3 miles? Heavy new supply typically softens prices + rents 12–24 months out; constrained supply supports both.
Investment metrics
- 1% rule
- 1.96% ✓
- Cap rate
- 16.62%
- Cash-on-cash
- 36.88%
- DSCR
- 2.64
- GRM
- 4.2
CMA / ARV
No comps found within radius.
Projected returns pro-forma
1.98% appreciation · 3.0% rent growth · sell at horizon
- IRR
- 40.9%
- Equity multiple
- 3.20×
- Total profit
- $33,879
- Equity at exit
- $21,641
- IRR
- 41.8%
- Equity multiple
- 6.34×
- Total profit
- $82,164
- Equity at exit
- $31,124
Cash invested: $15,400 (down + closing). Projections, not guarantees.
Landlord ↔ Tenant lean methodology
- Overall (STATE)
- 83 Strongly Landlord-Friendly
- State Iowa
- 83 Strongly Landlord-Friendly · R+6
- County
- — inherits STATE
- City
- — inherits STATE
ZIP-level market 52536
- Home prices YoY
- 1.1%
- Active inventory
- 4
- Price-to-rent
- 4.2×
Monthly cashflow live
- Estimated rent
- $1,080 medium interval (Pro) →
- Mortgage (P&I)
- −$288
- Tax est. 1.5%
- −$69 /mo · $825/yr
- Insurance
- −$23
- HOA
- −$0
- Vacancy / Maint / Mgmt
- −$227
- Net cashflow
- $473
Break-even live
UW: 25.0% down · 7.5% · 30yr · 1.5% tax · 5.0% vac · 8.0% maint · 8.0% mgmt
Financing live
Cash to close
- Down payment
- $13,750
- Closing costs
- $1,650
- Reserves months
- —
- Total cash needed
- —
Loan-product check · same deal, 3 products live
Conventional
25% down · 7.5% · 30yr
- Down + closing
- —
- Monthly P&I
- —
- Monthly cashflow
- —
- DSCR
- —
- Eligible?
- —
Personal DTI + credit; lowest rate.
DSCR
20% down · 8.5% · 30yr
- Down + closing
- —
- Monthly P&I
- —
- Monthly cashflow
- —
- DSCR
- —
- Eligible?
- —
No personal income docs; deal must DSCR.
Hard money
10% down · 12.0% · 12mo
- Down + closing
- —
- Monthly P&I
- —
- Monthly cashflow
- —
- DSCR
- —
- Eligible?
- —
Short-term bridge; refi at stabilization.
Listing history 2 events
-
2026-05-12status Pending 793-char remark
-
2026-05-04$55,000 Active 793-char remark
ⓘ Source: listings_history table (triggers on properties + properties_extension) + one-shot
backfill from property_details.listing_events for pre-trigger history.
Climate risk First Street
- Flood 1/10 Low FEMA zone X (unshaded) · 0% chance over 30 yrs
- Wildfire 3/10 Moderate
- Heat 3/10 Moderate 7 d/yr ≥104°F today · 15 d/yr by 30 yrs out
- Wind 2/10 Low
- Air quality 2/10 Low 1 unhealthy d/yr today · 1 by 30 yrs out
Nearby sold comps map
Loading sold comps map…
Walkable amenities ~0.75 mi
Loading nearby amenities…
Taxation est. · year 1
- Rental income
- $12,962
- − Mortgage interest
- −$3,081
- − Property taxes
- −$825
- − Insurance
- −$275
- − Repairs & maintenance
- −$1,037
- − Management
- −$1,037
- − Depreciation
- −$1,600
- Taxable income
- $5,107
- Est. tax owed @ 24.0%
- −$1,226
- After-tax cash flow
- $4,453/yr
For passive investors: Depreciation is non-cash, so a rental often shows a tax loss while cash-flowing — sheltering income. Rental losses are passive: they offset passive income freely, and up to $25,000/yr can offset ordinary (W-2) income if you actively participate and your MAGI is under $100k (phasing out to $0 by $150k); unused losses carry forward. On sale, claimed depreciation is recaptured at up to 25%, and gains may owe capital-gains tax (a 1031 exchange can defer both). Figures are a year-1 estimate at your 24.0% rate — not tax advice; consult a CPA.
Condition & rehab AI · 13 photos
This property requires significant repairs and maintenance, including roof replacement, exterior siding repainting, and HVAC unit replacement. These updates will significantly improve the property's condition and increase its resale and rental value.
Repairs flagged
- Major roof — The independent satellite image shows visible wear and tear on the roof, indicating potential leaks or damage.
- Major exterior siding — The independent satellite image shows weathered siding, indicating the need for repainting or replacement.
- Major HVAC units — The independent satellite image shows old HVAC units, which may need replacement or maintenance.
Value-add opportunities
- Both roof replacement — Replacing the roof will address a major issue and improve the overall condition of the property, enhancing both resale and rental value.
- Both exterior siding repainting — Repainting the exterior siding will improve the curb appeal and enhance the property's resale and rental value.
- Both HVAC unit replacement — Replacing the old HVAC units will improve the comfort and energy efficiency of the property, enhancing both resale and rental value.
Renovation cost estimate screening
| Repair item | Severity | Est. cost |
|---|---|---|
| roof · The independent satellite image shows visible wear and tear on the roof, indicating potential leaks or damage. | Major | $15,000–50,000 |
| exterior siding · The independent satellite image shows weathered siding, indicating the need for repainting or replacement. | Major | $15,000–50,000 |
| HVAC units · The independent satellite image shows old HVAC units, which may need replacement or maintenance. | Major | $15,000–50,000 |
| Total estimated repair cost · 3 items | $45,000–150,000 |
Value-add ROI direction
- Both roof replacement — Replacing the roof will address a major issue and improve the overall condition of the property, enhancing both resale and rental value. ↑
- Both exterior siding repainting — Repainting the exterior siding will improve the curb appeal and enhance the property's resale and rental value. ↑
- Both HVAC unit replacement — Replacing the old HVAC units will improve the comfort and energy efficiency of the property, enhancing both resale and rental value. ↑
ⓘ Cost ranges are severity-bucket heuristics (US national rule-of-thumb). Get contractor quotes + a written scope before underwriting a rehab budget.
Schools (NCES district)
- District
- Eddyville-Blakesburg- Fremont CSD
- NCES district ID
- 1904950
- Math proficiency
- 58% ▼ -8.00%
- Reading proficiency
- 57% ▼ -2.00%
- Median HH income
- $51,731
- Composite
- 49.18/100
- National rank
- #2041
- State rank
- #253 of 289 in IA
Livability — Blakesburg
- Score
- 61/100
- State rank
- #766
- US rank
- #17490
Category grades
Schools grade is shown separately in the Schools card above.
Census & demographics
- Population (ZIP)
- 713
Population outlook (Wapello County) Hauer SSP2
- Today (2025)
- 35,472 people
- By 2030
- 35,563 · +0.3%
- By 2040
- 36,083 · +1.7%
- By 2050
- 37,287 · +5.1%
- By 2075
- 43,898 · +23.8%
- By 2100
- 52,973 · +49.3%
Race, ethnicity, and origin ACS 2023
- Neighborhood character
- Predominantly White (93%)
- Race & ethnicity
- White 93% Two or more races 7%
- Common ancestry
- Iranian 9% Lithuanian 2% Serbian 1%
- Foreign-born
- 0%
Political lean MEDSL · Wapello
- 2024 margin
- Solid R (+31.4) · D 33.6% · R 65.0% · Other 1.4%
- 2008→2024 swing
- -45.0pp toward R · 2008: 13.5pp · 2024: -31.4pp
- All cycles
- 2024: R+31.4 2020: R+23.6 2016: R+20.8 2012: D+11.8 2008: D+13.5
Not yet ingested
- Civics
- —
Market trends
- HPI YoY
- ▲ 1.98%
- Current HPI
- 182.4207
- Rent YoY
- —
- Metro
- —
- State GDP YoY
- ▲ 2.48%
- F500 in state
- 4
Industry mix (Fortune 500 HQ in IA)
| Industry | F500 HQs | Revenue |
|---|---|---|
| Financial Services | 1 | $16B |
|
||
| Retail / Convenience | 1 | $15B |
|
||
Price history
2 events — show timeline
- 2026-05-12 Pending — IAR
- 2026-05-04 Listed $55,000 IAR
Cash-flow waterfall
monthlySold comps — $/sqft
last 12 mo · ≤1 miLoading sold comps…