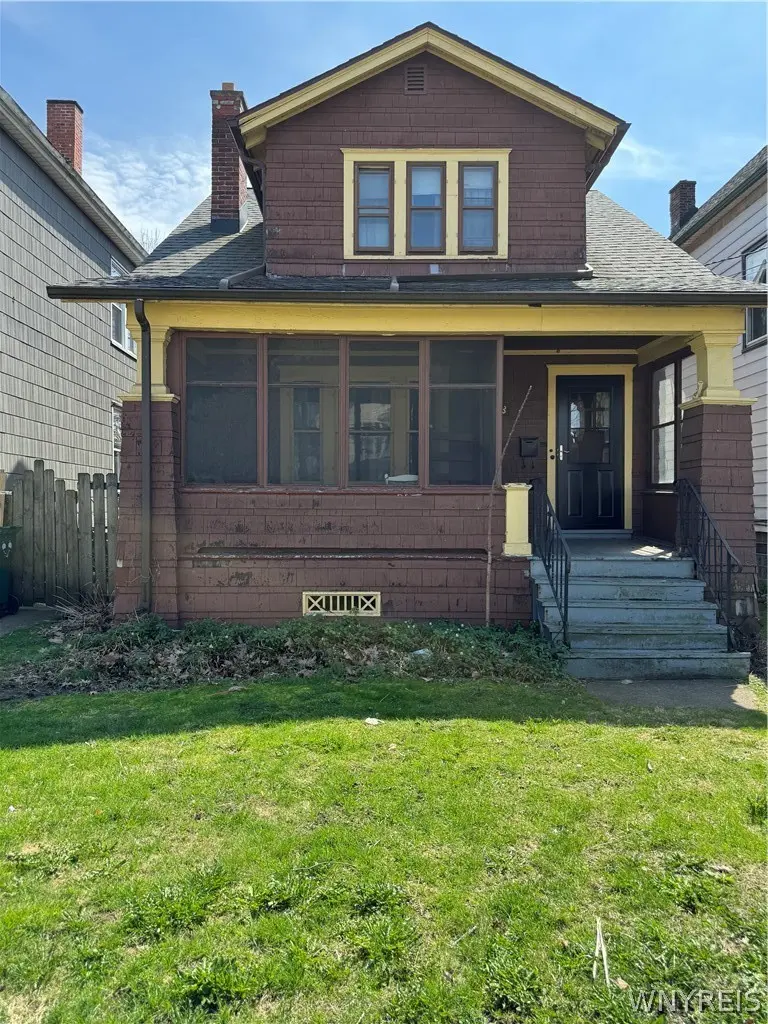
23 Aldrich Pl · Buffalo, NY
Flood risk 1/10 · Minimal
- FEMA flood zone
- X (unshaded)
- Chance of flooding over 30 yrs
- 0.0%
- Est. flood insurance / yr
- $473 – $860
Fire risk 1/10 · Minimal
- Est. fire insurance / yr
- $691 – $1,283
Heat risk 3/10 · Minor
- Hot days now (above 92°F)
- 7 days/yr
- Hot days in 30 yrs
- 15 days/yr
Wind risk 1/10 · Minimal
- Chance of severe wind over 30 yrs
- —
Air-quality risk 4/10 · Minor
- Unhealthy air days now
- 3 days/yr
- Unhealthy air days in 30 yrs
- 8 days/yr
Risk factors via First Street. Map © Google.
Why this score? — see what drove the B- grade
The composite is a weighted blend of 9 inputs, each scored 0–100. Each bar is that input's sub-score; the figure is the points it added to the 100-point composite (weight × sub-score).
- Cash flow +27.6/30.0
- DSCR +9.7/10.0
- ARV discount +7.5/15.0
- 1% rule +6.6/10.0
- Rent growth +4.4/5.0
- Livability +3.9/5.0
- Schools +3.3/10.0
- Condition / age +2.5/5.0
- Appreciation +0.0/10.0
$109,000
🖨 Deal sheet 📄 Offer letter ✓ Due diligence
Listing remarks
Location, location, location! Opportunity for owner occupy or investor. This 4 bedroom, 2 full bath bungalow conveniently located close to Botanical Gardens, South Park Lake, restaurants and plenty of shopping opportunities. This house is waiting for a new owner to bring it back to life many possibilities.
Key facts
- 7,680 sq ft lot
- Garage
- Built 1900
Neighborhood map
What this means for you Summary
Snapshot
- This is a 2-bed/2.0-bath single-family listed at $109k.
Deal economics
- At list price, monthly cash flow is $326 ($4k/yr) — positive.
- The deal already cash-flows at list — no discount required.
- Meets the 1% rule at list price ($1k rent vs $109k).
- Cap rate 9.9% vs local median 8.0% in Buffalo — meaningfully above typical; check what's discounted (condition, days-on-market, listing class) to confirm the premium yield is real.
Location & tenants
- Location reads 77/100 on livability (#195 in NY, #3,011 nationally) — a middle-class / working-renter tenant base. Strengths: commute A+, housing A+, health & safety A+; Watch: crime F, employment D-.
- Buffalo City School District (urban): math 41% / reading 40% proficiency, ranked #535 of 590 in NY (top 91%) — families likely to look elsewhere, expect single-tenant / working-renter base with shorter leases; 75% free/reduced lunch — lower-income household profile, screen leases tightly.
- Market conditions: Rents rising fast (+7.6%/yr); 136 active listings in the ZIP; 6 comparable units currently listed for rent nearby; rentals leasing fast (median 11d on market — plan ~1-2 weeks tenant-placement turnaround); 1,244 units permitted in Erie County in 2024 (563 in 5+ unit buildings).
Forward outlook
- Local home prices are declining (-3.0%/yr); year-one equity from $754 of loan paydown is wiped out by about $3k of value loss. Plan a longer hold.
- At projected returns (-3.0% appreciation + 7.6% rent growth), your $31k cash investment doubles in ~7 years — after that, you're playing with house money.
Negotiation context
- Only 5 days on market — expect competitive offers; lowballing is unlikely to land.
- Current owner paid $40k; list at $109k implies a 172% gain — meaningful room to come down on a strong offer.
Risks & watch-outs
- Watch-outs: built in 1900 — expect roof / HVAC / electrical / plumbing capex.
Questions for the listing agent
- Built in 1900 — when were the roof, HVAC, electrical panel, plumbing, and water heater last replaced?
- Is there a deadline driving the sale (1031 exchange, divorce, estate, relocation)? That informs how much negotiation room exists.
- Crime grade is F in this area — have there been break-ins, vandalism, or insurance claims at this property in the last 3 years? What carrier currently insures it and at what premium?
- What's the average days-on-market for RENTAL listings here right now (not sales)? A rising rental-DOM trend means longer vacancies and softer asking-rent achievability than the comps imply.
- What's the recent tenant-quality profile in this submarket — average credit score on applications, eviction rate, late-payment / NSF rate, and stable-employment percentage? A property-management company in the area should have these aggregated.
- How much new for-sale + rental construction is in the pipeline within 1–3 miles? Heavy new supply typically softens prices + rents 12–24 months out; constrained supply supports both.
Investment metrics
- 1% rule
- 1.16% ✓
- Cap rate
- 9.89%
- Cash-on-cash
- 12.84%
- DSCR
- 1.57
- GRM
- 7.2
CMA / ARV
- ARV (on-the-fly)
- $240,112
- Comps found
- 12
Show comp detail 12 sales within ~0.75 mi
| Address | Dist | Beds/Ba | Sqft | Sold | Price | $/sf | Match |
|---|---|---|---|---|---|---|---|
| 77 Cantwell Dr | 0.21mi | 3/1.0 (+1) | 1,275 (-9%) | 0mo | $210,000 | $165 | 66 |
| 95 Aldrich Pl | 0.14mi | 3/1.5 (+1) | 1,568 (+12%) | 1mo | $270,000 | $172 | 65 |
| 34 Downing St | 0.16mi | 3/1.5 (+1) | 1,540 (+10%) | 8mo | $250,000 | $162 | 62 |
| 98 Ridgewood Rd | 0.46mi | 3/1.0 (+1) | 1,432 (+3%) | 5mo | $295,000 | $206 | 61 |
| 114 Whitehall Ave | 0.65mi | 3/2.0 (+1) | 1,416 (+1%) | 5mo | $300,000 | $212 | 58 |
| 66 Woodside Ave | 0.66mi | 3/2.0 (+1) | 1,364 (-2%) | 3mo | $250,000 | $183 | 58 |
| 78 High Vw | 0.47mi | 3/1.0 (+1) | 1,316 (-6%) | 6mo | $145,000 | $110 | 54 |
| 289 Okell St | 0.38mi | 3/1.5 (+1) | 1,560 (+12%) | 5mo | $232,500 | $149 | 52 |
| 338 Downing St | 0.61mi | 3/1.0 (+1) | 1,270 (-9%) | 5mo | $265,000 | $209 | 43 |
| 105 Sheffield Ave | 0.70mi | 3/1.0 (+1) | 1,216 (-13%) | 0mo | $215,000 | $177 | 36 |
| 17 S Shore Blvd | 0.71mi | 3/1.5 (+1) | 1,584 (+14%) | 4mo | $260,000 | $164 | 34 |
| 60 Woodside Ave | 0.66mi | 3/1.0 (+1) | 1,568 (+12%) | 7mo | $164,900 | $105 | 33 |
Match score weights: distance 35% · size 25% · config 20% · recency 20%. Top-matched comps best support the ARV.
Projected returns pro-forma
-3.0% appreciation · 7.62% rent growth · sell at horizon
- IRR
- 7.4%
- Equity multiple
- 1.30×
- Total profit
- $9,249
- Equity at exit
- $16,252
- IRR
- 20.2%
- Equity multiple
- 3.05×
- Total profit
- $62,467
- Equity at exit
- $9,424
Cash invested: $30,520 (down + closing). Projections, not guarantees.
Landlord ↔ Tenant lean methodology
- Overall (STATE)
- 15 Strongly Tenant-Friendly
- State New York
- 15 Strongly Tenant-Friendly · D+10
- County
- — inherits STATE
- City
- — inherits STATE
ZIP-level market 14220
- Home prices YoY
- -26.7%
- Rents YoY
- 7.6%
- Active inventory
- 136
- Price-to-rent
- 7.2×
Monthly cashflow live
- Estimated rent
- $1,264 high interval (Pro) →
- Mortgage (P&I)
- −$572
- Tax from tax record
- −$55 /mo · $661/yr
- Insurance
- −$45
- HOA
- −$0
- Vacancy / Maint / Mgmt
- −$265
- Net cashflow
- $326
Break-even live
UW: 25.0% down · 7.5% · 30yr · 1.5% tax · 5.0% vac · 8.0% maint · 8.0% mgmt
Financing live
Cash to close
- Down payment
- $27,250
- Closing costs
- $3,270
- Reserves months
- —
- Total cash needed
- —
Loan-product check · same deal, 3 products live
Conventional
25% down · 7.5% · 30yr
- Down + closing
- —
- Monthly P&I
- —
- Monthly cashflow
- —
- DSCR
- —
- Eligible?
- —
Personal DTI + credit; lowest rate.
DSCR
20% down · 8.5% · 30yr
- Down + closing
- —
- Monthly P&I
- —
- Monthly cashflow
- —
- DSCR
- —
- Eligible?
- —
No personal income docs; deal must DSCR.
Hard money
10% down · 12.0% · 12mo
- Down + closing
- —
- Monthly P&I
- —
- Monthly cashflow
- —
- DSCR
- —
- Eligible?
- —
Short-term bridge; refi at stabilization.
Rent comps 6 comps
| Address | Beds | Baths | Sqft | Rent | $/sqft | DOM | Units | Dist |
|---|---|---|---|---|---|---|---|---|
| 40 Vincent Ave Unit 2 Buffalo, NY | 2.0 | 1.0 | 1075 | $875 | $0.81 | 23d | 1 | 0.27mi |
| 74 Woodside Ave Unit 1 Buffalo, NY | 3.0 | 1.0 | 1250 | $1,510 | $1.21 | 1d | 1 | 0.65mi |
| 86 Edgewood Ave Buffalo, NY | 2.0 | 2.0 | 1700 | $1,700 | $1.00 | 1d | 1 | 1.14mi |
| 111 Southside Pkwy Buffalo, NY | 1.0 | 1.0 | 1000 | $1,000 | $1.00 | 23d | 1 | 1.30mi |
| 89 Macamley St #2 Buffalo, NY | 3.0 | 1.0 | 1274 | $1,100 | $0.86 | 10d | 1 | 1.42mi |
| 298 Cumberland Ave Buffalo, NY | 3.0 | 1.5 | 1208 | $2,200 | $1.82 | 1d | 1 | 1.43mi |
Listing history 3 events
-
2026-04-22status Pending
-
2026-04-17$109,000 Active
-
2011-11-10soldstatus $40,000
ⓘ Source: listings_history table (triggers on properties + properties_extension) + one-shot
backfill from property_details.listing_events for pre-trigger history.
Tax reassessment forecast NY · Partial reset (capped growth)
- Current annual tax
- $661 · $55/mo
- Projected year-2 tax
- $1,252 · $104/mo
- Expected delta
- +$590/yr (+$49/mo · 89.3%)
ⓘ Screening estimate from a state-policy table — verify with the county assessor before closing.
Climate risk First Street
- Flood 1/10 Low FEMA zone X (unshaded) · 0% chance over 30 yrs
- Wildfire 1/10 Low
- Heat 3/10 Moderate 7 d/yr ≥92°F today · 15 d/yr by 30 yrs out
- Wind 1/10 Low
- Air quality 4/10 Moderate 3 unhealthy d/yr today · 8 by 30 yrs out
Nearby sold comps map
Loading sold comps map…
Walkable amenities ~0.75 mi
Loading nearby amenities…
Taxation est. · year 1
- Rental income
- $15,169
- − Mortgage interest
- −$6,106
- − Property taxes
- −$661
- − Insurance
- −$545
- − Repairs & maintenance
- −$1,213
- − Management
- −$1,213
- − Depreciation
- −$3,171
- Taxable income
- $2,259
- Est. tax owed @ 24.0%
- −$542
- After-tax cash flow
- $3,375/yr
For passive investors: Depreciation is non-cash, so a rental often shows a tax loss while cash-flowing — sheltering income. Rental losses are passive: they offset passive income freely, and up to $25,000/yr can offset ordinary (W-2) income if you actively participate and your MAGI is under $100k (phasing out to $0 by $150k); unused losses carry forward. On sale, claimed depreciation is recaptured at up to 25%, and gains may owe capital-gains tax (a 1031 exchange can defer both). Figures are a year-1 estimate at your 24.0% rate — not tax advice; consult a CPA.
Schools (NCES district)
- District
- Buffalo City School District
- NCES district ID
- 3605850
- Math proficiency
- 41% ▲ 11.00%
- Reading proficiency
- 40% ▲ 7.00%
- Median HH income
- $31,665
- Composite
- 33.17/100
- National rank
- #5544
- State rank
- #535 of 590 in NY
Livability — Buffalo
- Score
- 77/100
- State rank
- #195
- US rank
- #3011
Category grades
Schools grade is shown separately in the Schools card above.
Census & demographics
- Census place
- Buffalo, NY
- County
- Erie County · 714,559 people
- City population
- 440,021
- Metro
- Buffalo-Cheektowaga, NY
- Population (ZIP)
- 24,428
- Household income
- $70,963
- Rent vs Own
- Severe rent burden
- 602.0
Population outlook (Erie County) Hauer SSP2
- Today (2025)
- 933,037 people
- By 2030
- 935,181 · +0.2%
- By 2040
- 928,531 · -0.5%
- By 2050
- 905,725 · -2.9%
- By 2075
- 834,037 · -10.6%
- By 2100
- 708,033 · -24.1%
Race, ethnicity, and origin ACS 2023
- Neighborhood character
- Predominantly White (76%)
- Race & ethnicity
- White 76% Hispanic / Latino 13% Two or more races 6% Black 5% Asian 2%
- Hispanic origin (detail)
- Puerto Rican 10% Cuban 1%
- Common ancestry
- Romanian 16% Lithuanian 1% Subsaharan African 1%
- Foreign-born
- 4% · Canada, Jamaica, China
- Languages at home
- 90% English-only · Spanish 4% Chinese 1%
Political lean MEDSL · Erie
- 2024 margin
- Lean D (+9.7) · D 54.8% · R 45.2%
- 2008→2024 swing
- -7.9pp toward R · 2008: 17.5pp · 2024: 9.7pp
- All cycles
- 2024: D+9.7 2020: D+14.7 2016: D+4.8 2012: D+15.6 2008: D+17.5
Not yet ingested
- Civics
- —
Market trends
- HPI YoY
- ▼ -146.29%
- Current HPI
- 402.5053
- Rent YoY
- ▲ 7.62%
- Metro
- Buffalo-Cheektowaga, NY
- State GDP YoY
- ▲ 2.60%
- F500 in state
- 92
Industry mix (Fortune 500 HQ in NY)
| Industry | F500 HQs | Revenue |
|---|---|---|
| Financial Services | 10 | $950B |
|
||
| Consumer Goods | 9 | $162B |
|
||
| Insurance | 4 | $225B |
|
||
| Telecommunications | 2 | $144B |
|
||
| Pharmaceuticals | 2 | $112B |
|
||
| Media / Entertainment | 2 | $69B |
|
||
Price history
+172.5% since first listed3 events — show timeline
- 2026-04-22 Pending — WNYREIS
- 2026-04-17 Listed $109,000 WNYREIS
- 2011-11-10 Sold (Public Records) $40,000 Public Records
Property tax history
+8.0%/yrLatest (2025): $661 · +0.0% YoY. Source: county tax records.
Cash-flow waterfall
monthlySold comps — $/sqft
last 12 mo · ≤1 miLoading sold comps…