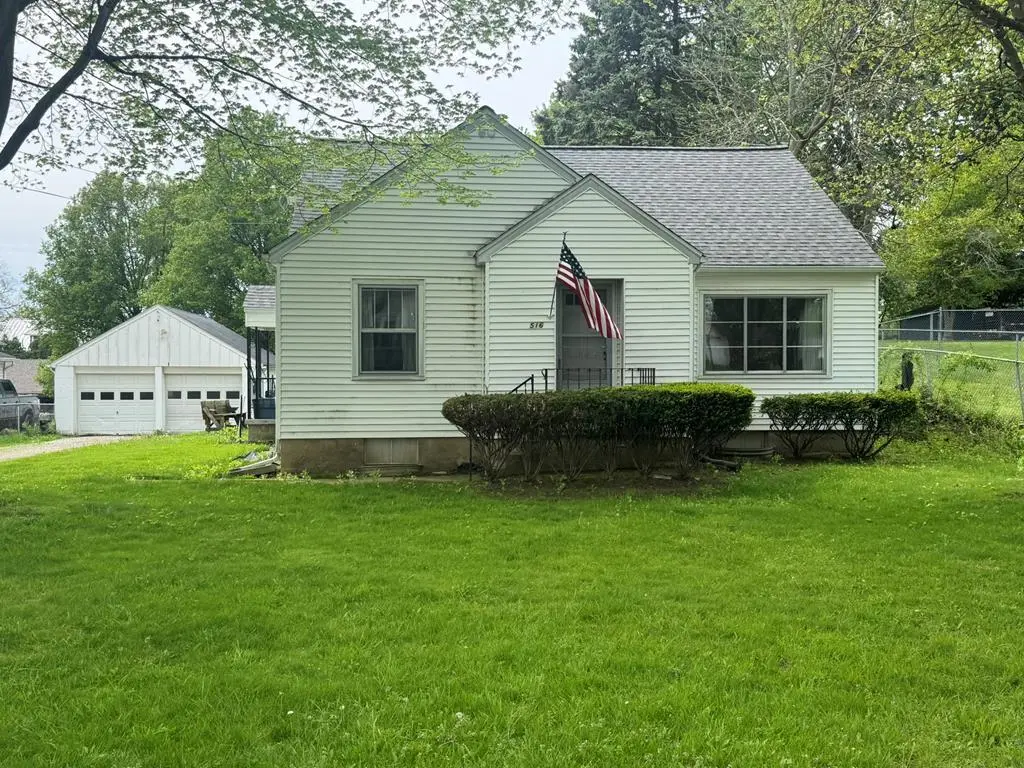
516 N Liberty St · Galion, OH
Flood risk 1/10 · Minimal
- FEMA flood zone
- X (unshaded)
- Chance of flooding over 30 yrs
- 0.0%
- Est. flood insurance / yr
- $473 – $860
Fire risk 1/10 · Minimal
- Est. fire insurance / yr
- $713 – $1,323
Heat risk 3/10 · Minor
- Hot days now (above 98°F)
- 7 days/yr
- Hot days in 30 yrs
- 17 days/yr
Wind risk 2/10 · Minimal
- Chance of severe wind over 30 yrs
- —
Air-quality risk 2/10 · Minimal
- Unhealthy air days now
- 1 days/yr
- Unhealthy air days in 30 yrs
- 1 days/yr
Risk factors via First Street. Map © Google.
Why this score? — see what drove the F grade
The composite is a weighted blend of 9 inputs, each scored 0–100. Each bar is that input's sub-score; the figure is the points it added to the 100-point composite (weight × sub-score).
- ARV discount +15.0/15.0
- Cash flow +5.0/30.0
- Schools +3.8/10.0
- Livability +3.2/5.0
- Rent growth +2.5/5.0
- Condition / age +2.5/5.0
- 1% rule +0.0/10.0
- DSCR +0.0/10.0
- Appreciation +0.0/10.0
$144,900
🖨 Deal sheet (PDF) 📄 Offer letter ✓ Due diligence
Listing remarks
Welcome to this charming Cape Cod that blends classic character with everyday comfort. Three bedrooms and one bathroom offer a practical layout, highlighted by the generous upstairs bedroom perfect as a private retreat. Pine wood floors and warmth and timeless appeal throughout. The convenient kitchen and thoughtful floor plan make daily living a breeze. Outside, enjoy a spacious yard and plenty of off-street parking. This solidly built home is ready for its next chapter. Schedule your showing today!
Key facts
- Spacious yard
- Upstairs bedroom
- Off-street parking
Tags
Property features AI
Exterior
- Parking: 2-car garage; Gravel parking
- Utilities: Public water; Public sewer
- Home design: Single-family residence; Residential property
- Construction: Vinyl siding; Composition roof
- Exterior features: Level lot
Interior
- Kitchen: Dishwasher; Refrigerator
- Bathrooms: 1 full bathroom (main level)
- Heating & cooling: Central air conditioning; Forced air heating (natural gas)
- Interior features: Storm windows; Full basement
- Laundry & utility: Laundry in basement; Gas water heater
Neighborhood map
What this means for you Summary
Snapshot
- This is a 3-bed/1.0-bath single-family listed at $145k.
Deal economics
- At list price, monthly cash flow is $-339 ($-4k/yr) — negative.
- To cash-flow at today's rent, offer at most $85k (41.3% below list).
- To meet the 1% rule (rent ≥ 1% of price), the offer needs to be $72k (50.0% below list).
- Recommended offer: $72k (50.0% below list) — sets the bar for 1% rule.
- Cap rate 3.5% vs local median 4.8% in Galion — below-typical yield; the buyer is paying a premium for something (appreciation thesis, condition, location) that the cap rate doesn't capture.
Location & tenants
- Location reads 63/100 on livability (#833 in OH) — a middle-class / working-renter tenant base. Strengths: cost of living A+, housing A+, crime A-; Watch: schools C-, amenities F, commute F.
- Galion City (town): math 36% / reading 56% proficiency, ranked #499 of 656 in OH (top 76%) — families likely to look elsewhere, expect single-tenant / working-renter base with shorter leases.
- Market conditions: 76 active listings in the ZIP; 2 comparable units currently listed for rent nearby; 8 units permitted in Crawford County in 2024 (0 in 5+ unit buildings).
- This rent is only 15% of the median local income ($57k/yr) — well below the 30% rent-burden line; pricing power to push rent on renewal without tenant pushback.
Forward outlook
- Local home prices are declining (-3.0%/yr); year-one equity from $1k of loan paydown is wiped out by about $4k of value loss. Plan a longer hold.
- Crawford County population projected at -22% by 2050 — secular population decline; favor cash flow + early exit over multi-decade hold.
Negotiation context
- It's been on market 53 days — a 3% lower offer ($141k) is reasonable based on typical stale-listing flexibility.
- Current owner paid $21k; list at $145k implies a 579% gain — meaningful room to come down on a strong offer.
Risks & watch-outs
- Watch-outs: built in 1939 — expect roof / HVAC / electrical / plumbing capex.
Questions for the listing agent
- What do current leases actually rent for vs. the listed asking? Can we see a recent rent roll and the last 12 months of T-12 income?
- It's been on market 53 days. Have you received any prior offers? Is the seller open to a 50% concession, seller financing, or rate buy-down credit?
- Built in 1939 — when were the roof, HVAC, electrical panel, plumbing, and water heater last replaced?
- Is there a deadline driving the sale (1031 exchange, divorce, estate, relocation)? That informs how much negotiation room exists.
- The area grade is low — what's the realistic commute time and amenity access for the typical tenant pool here? Any planned neighborhood developments (good or bad) we should know about?
- What's the average days-on-market for RENTAL listings here right now (not sales)? A rising rental-DOM trend means longer vacancies and softer asking-rent achievability than the comps imply.
- What's the recent tenant-quality profile in this submarket — average credit score on applications, eviction rate, late-payment / NSF rate, and stable-employment percentage? A property-management company in the area should have these aggregated.
- How much new for-sale + rental construction is in the pipeline within 1–3 miles? Heavy new supply typically softens prices + rents 12–24 months out; constrained supply supports both.
Investment metrics
- 1% rule
- 0.50% ✗
- Cap rate
- 3.48%
- Cash-on-cash
- -10.03%
- DSCR
- 0.55
- GRM
- 16.7
CMA / ARV
- ARV (median comp)
- $176,183
- List price
- $144,900
- Delta
- -17.76%
- Verdict
- UNDERPRICED
- Comps
- 20 within 1.0 mi
Show comp detail 8 sales within ~0.75 mi
| Address | Dist | Beds/Ba | Sqft | Sold | Price | $/sf | Match |
|---|---|---|---|---|---|---|---|
| 414 E Church St | 0.32mi | 2/1.0 (-1) | 936 (-3%) | 3mo | $18,000 | $19 | 73 |
| 360 N Columbus St | 0.15mi | 2/1.0 (-1) | 884 (-8%) | 3mo | $129,900 | $147 | 72 |
| 134 North Riblet St | 0.45mi | 2/1.0 (-1) | 1,004 (+4%) | 2mo | $64,500 | $64 | 65 |
| 271 Westgate Rd | 0.38mi | 3/1.0 | 1,056 (+10%) | 4mo | $167,000 | $158 | 63 |
| 128 E Payne Ave | 0.24mi | 2/1.0 (-1) | 1,008 (+5%) | 19mo | $134,900 | $134 | 60 |
| 123 Carmel Ave | 0.42mi | 3/1.0 | 884 (-8%) | 13mo | $124,900 | $141 | 56 |
| 230 Walker St | 0.33mi | 2/1.0 (-1) | 832 (-14%) | 9mo | $121,000 | $145 | 50 |
| 120 Buehler St | 0.35mi | 3/2.0 | 1,086 (+13%) | 23mo | $66,024 | $61 | 39 |
Match score weights: distance 35% · size 25% · config 20% · recency 20%. Top-matched comps best support the ARV.
Projected returns pro-forma
-3.0% appreciation · 3.0% rent growth · sell at horizon
- IRR
- -34.4%
- Equity multiple
- -0.11×
- Total profit
- $-45,120
- Equity at exit
- $21,605
- IRR
- -44.4%
- Equity multiple
- -0.66×
- Total profit
- $-67,278
- Equity at exit
- $12,528
Cash invested: $40,572 (down + closing). Projections, not guarantees.
Landlord ↔ Tenant lean methodology
- Overall (STATE)
- 73 Landlord-Friendly
- State Ohio
- 73 Landlord-Friendly · R+6
- County
- — inherits STATE
- City
- — inherits STATE
ZIP-level market 44833
- Home prices YoY
- -27.9%
- Active inventory
- 76
- Price-to-rent
- 16.7×
Monthly cashflow live
- Estimated rent
- $724 medium interval (Pro) →
- Mortgage (P&I)
- −$760
- Tax from tax record
- −$91 /mo · $1,088/yr
- Insurance
- −$60
- HOA
- −$0
- Vacancy / Maint / Mgmt
- −$152
- Net cashflow
- $-339
Break-even live
Sensitivity live
| Price | -10% $-257 | -5% $-298 | +0% $-339 | +5% $-380 | +10% $-421 |
|---|---|---|---|---|---|
| Rent | -10% $-396 | -5% $-368 | +0% $-339 | +5% $-310 | +10% $-282 |
| Rate | -1.0pp $-266 | -0.5pp $-302 | base $-339 | +0.5pp $-377 | +1.0pp $-415 |
UW: 25.0% down · 7.5% · 30yr · 1.5% tax · 5.0% vac · 8.0% maint · 8.0% mgmt
Financing live
Cash to close
- Down payment
- $36,225
- Closing costs
- $4,347
- Reserves months
- —
- Total cash needed
- —
Loan-product check · same deal, 3 products live
Conventional
25% down · 7.5% · 30yr
- Down + closing
- —
- Monthly P&I
- —
- Monthly cashflow
- —
- DSCR
- —
- Eligible?
- —
Personal DTI + credit; lowest rate.
DSCR
20% down · 8.5% · 30yr
- Down + closing
- —
- Monthly P&I
- —
- Monthly cashflow
- —
- DSCR
- —
- Eligible?
- —
No personal income docs; deal must DSCR.
Hard money
10% down · 12.0% · 12mo
- Down + closing
- —
- Monthly P&I
- —
- Monthly cashflow
- —
- DSCR
- —
- Eligible?
- —
Short-term bridge; refi at stabilization.
Rent comps 2 comps
| Address | Beds | Baths | Sqft | Rent | $/sqft | DOM | Units | Dist |
|---|---|---|---|---|---|---|---|---|
| 331 6th Ave Galion, OH | 1.0–2.0 | 1.0 | 675 | $610 | $0.90 | 44d | 1 | 1.33mi |
| 300 6th Ave Unit 109 Galion, OH | 2.0 | 1.0 | 775 | $825 | $1.06 | 44d | 1 | 1.35mi |
Listing history 16 events
-
2026-06-19days on market $144,900 Active 53 DOM
-
2026-06-18days on market $144,900 Active 52 DOM
-
2026-06-17days on market $144,900 Active 51 DOM
-
2026-06-16days on market $144,900 Active 50 DOM
-
2026-06-15days on market $144,900 Active 49 DOM
-
2026-06-14days on market $144,900 Active 47 DOM
-
2026-06-12days on market $144,900 Active 46 DOM
-
2026-06-09days on market $144,900 Active 43 DOM
-
2026-06-08days on market $144,900 Active 42 DOM
-
2026-06-07days on market $144,900 Active 41 DOM
-
2026-06-02days on market $144,900 Active 36 DOM
-
2026-06-01days on market $144,900 Active 35 DOM
-
2026-05-31days on market $144,900 Active 34 DOM
-
2026-05-30days on market $144,900 Active 33 DOM
-
2026-04-27$144,900 Active 505-char remark
-
2008-02-25soldstatus $21,333
ⓘ Source: listings_history table (triggers on properties + properties_extension) + one-shot
backfill from property_details.listing_events for pre-trigger history.
Tax reassessment forecast OH · Partial reset (capped growth)
- Current annual tax
- $1,088 · $91/mo
- Projected year-2 tax
- $1,674 · $140/mo
- Expected delta
- +$586/yr (+$49/mo · 53.8%)
ⓘ Screening estimate from a state-policy table — verify with the county assessor before closing.
Climate risk First Street
- Flood 1/10 Low FEMA zone X (unshaded) · 0% chance over 30 yrs
- Wildfire 1/10 Low
- Heat 3/10 Moderate 7 d/yr ≥98°F today · 17 d/yr by 30 yrs out
- Wind 2/10 Low
- Air quality 2/10 Low 1 unhealthy d/yr today · 1 by 30 yrs out
Nearby sold comps map
Loading sold comps map…
Walkable amenities ~0.75 mi
Loading nearby amenities…
Taxation est. · year 1
- Rental income
- $8,687
- − Mortgage interest
- −$8,117
- − Property taxes
- −$1,088
- − Insurance
- −$724
- − Repairs & maintenance
- −$695
- − Management
- −$695
- − Depreciation
- −$4,215
- Taxable loss
- −$6,848
- Est. tax savings @ 24.0%
- +$1,643
- After-tax cash flow
- $-2,425/yr
For passive investors: Depreciation is non-cash, so a rental often shows a tax loss while cash-flowing — sheltering income. Rental losses are passive: they offset passive income freely, and up to $25,000/yr can offset ordinary (W-2) income if you actively participate and your MAGI is under $100k (phasing out to $0 by $150k); unused losses carry forward. On sale, claimed depreciation is recaptured at up to 25%, and gains may owe capital-gains tax (a 1031 exchange can defer both). Figures are a year-1 estimate at your 24.0% rate — not tax advice; consult a CPA.
Schools (NCES district)
- District
- Galion City
- NCES district ID
- 3904402
- Math proficiency
- 36% ▼ -12.00%
- Reading proficiency
- 56% ▬ 0.00%
- Median HH income
- $36,331
- Composite
- 38.08/100
- National rank
- #4279
- State rank
- #499 of 656 in OH
Livability — Galion
- Score
- 63/100
- State rank
- #833
- US rank
- #15587
Category grades
Schools grade is shown separately in the Schools card above.
Census & demographics
- Census place
- Galion, OH
- County
- Morrow · 41,908 people
- City population
- 16,641
- Metro
- Columbus, OH
- Population (ZIP)
- 16,641
- Household income
- $57,234
- Rent vs Own
- Severe rent burden
- 3.8
Population outlook (Crawford County) Hauer SSP2
- Today (2025)
- 39,421 people
- By 2030
- 37,656 · -4.5%
- By 2040
- 34,043 · -13.6%
- By 2050
- 30,617 · -22.3%
- By 2075
- 23,652 · -40.0%
- By 2100
- 17,786 · -54.9%
Race, ethnicity, and origin ACS 2023
- Neighborhood character
- Predominantly White (96%)
- Race & ethnicity
- White 96% Two or more races 2% Hispanic / Latino 2%
- Common ancestry
- Slovak 2% Romanian 2% Lithuanian 2%
- Foreign-born
- 1% · Canada
- Languages at home
- 98% English-only · Spanish 1% German/W. Germanic 1%
Political lean MEDSL · Crawford
- 2024 margin
- Solid R (+53.0) · D 23.1% · R 76.1%
- 2008→2024 swing
- -33.9pp toward R · 2008: -19.0pp · 2024: -53.0pp
- All cycles
- 2024: R+53.0 2020: R+50.9 2016: R+46.8 2012: R+22.7 2008: R+19.0
Not yet ingested
- Civics
- —
Market trends
- HPI YoY
- ▼ -84.57%
- Current HPI
- 218.195
- Rent YoY
- —
- Metro
- —
- State GDP YoY
- ▲ 1.98%
- F500 in state
- 48
Industry mix (Fortune 500 HQ in OH)
| Industry | F500 HQs | Revenue |
|---|---|---|
| Insurance | 3 | $145B |
|
||
| Industrial Machinery | 3 | $49B |
|
||
| Financial Services | 3 | $24B |
|
||
| Consumer Goods | 2 | $93B |
|
||
| Aerospace / Defense | 2 | $47B |
|
||
| Utilities | 2 | $33B |
|
||
Price history
+579.2% since first listed2 events — show timeline
- 2026-04-27 Listed $144,900 MARMLS
- 2008-02-25 Sold (Public Records) $21,333 Public Records
Property tax history
+2.1%/yrLatest (2025): $1,088 · -0.3% YoY. Source: county tax records.
Cash-flow waterfall
monthlySold comps — $/sqft
last 12 mo · ≤1 miLoading sold comps…