 🏷️ Likely Rental
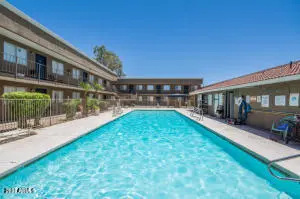
18202 N Cave Creek Rd #206 · Phoenix, AZ
Flood risk 1/10 · Minimal
- FEMA flood zone
- X (shaded)
- Chance of flooding over 30 yrs
- 0.0%
- Est. flood insurance / yr
- $507 – $1,088
Fire risk 4/10 · Minor
- Est. fire insurance / yr
- $610 – $1,132
Heat risk 8/10 · Major
- Hot days now (above 110°F)
- 6 days/yr
- Hot days in 30 yrs
- 15 days/yr
Wind risk 1/10 · Minimal
- Chance of severe wind over 30 yrs
- —
Air-quality risk 3/10 · Minor
- Unhealthy air days now
- 3 days/yr
- Unhealthy air days in 30 yrs
- 5 days/yr
Risk factors via First Street. Map © Google.
Why this score? — see what drove the D grade
The composite is a weighted blend of 9 inputs, each scored 0–100. Each bar is that input's sub-score; the figure is the points it added to the 100-point composite (weight × sub-score).
- ARV discount +15.0/15.0
- Cash flow +6.9/30.0
- 1% rule +6.0/10.0
- Schools +3.8/10.0
- Livability +3.8/5.0
- Condition / age +2.5/5.0
- Rent growth +2.1/5.0
- DSCR +1.1/10.0
- Appreciation +0.0/10.0
$115,000
🖨 Deal sheet 📄 Offer letter ✓ Due diligence
Listing remarks MLS
1 bed / 1 bath condo. Great investment property for investors. Close to 101/FRWY AND SR 51. Minutes from Desert ridge Market Place. This complex offers amenities like a pool, Lush Landscaping, Close to shopping and dining. Tenant in place. Current rent $1050/mo. with room to raise rent. month to month lease.
Key facts
- Investment property
- Close to dining
- Pool
Tags
Neighborhood map
What this means for you Summary
Snapshot
- This is a 1-bed/1.0-bath condo listed at $115k.
Deal economics
- At list price, monthly cash flow is $-174 ($-2k/yr) — negative.
- To cash-flow at today's rent, offer at most $90k (21.9% below list).
- Meets the 1% rule at list price ($1k rent vs $115k).
- Recommended offer: $90k (21.9% below list) — sets the bar for cash-flow.
- Cap rate 4.5% vs local median 3.3% in Phoenix — top-decile yield for the area; either an underpriced asset or a hidden risk that comps aren't pricing in. Stress-test before assuming the spread holds.
Location & tenants
- Location reads 75/100 on livability (#16 in AZ, #3,924 nationally) — a middle-class / working-renter tenant base. Strengths: amenities A+, commute A+, housing A+; Watch: health & safety C-, crime F.
- Paradise Valley Unified District (4241) (urban): math 39% / reading 46% proficiency, ranked #56 of 249 in AZ (top 22%) — families likely to look elsewhere, expect single-tenant / working-renter base with shorter leases.
- Market conditions: Rents soft (-1.5%/yr); 337 active listings in the ZIP; 23 comparable units currently listed for rent nearby; rentals leasing fast (median 5d on market — plan ~1-2 weeks tenant-placement turnaround); solid renter incomes; 36,011 units permitted in Maricopa County in 2024 (12,801 in 5+ unit buildings).
Forward outlook
- Local home prices are declining (-3.0%/yr); year-one equity from $795 of loan paydown is wiped out by about $3k of value loss. Plan a longer hold.
- Maricopa County population projected at +38% by 2050 — long-run rental-demand tailwind backs the buy-and-hold thesis.
Negotiation context
- It's been on market 61 days — a 6% lower offer ($108k) is reasonable based on typical stale-listing flexibility.
- 5 sale attempts since 10y ago with the ask held roughly flat each time — persistent listings suggest the price (not the market) is what's stuck; bring a comps-based counter.
Risks & watch-outs
- Watch-outs: HOA is 30% of rent.
- Climate carrying-cost: extreme-heat days projected 6→15/yr by 2055 (HVAC capex compounding) — expect insurance premiums to compound above CPI over the hold.
Questions for the listing agent
- What do current leases actually rent for vs. the listed asking? Can we see a recent rent roll and the last 12 months of T-12 income?
- It's been on market 61 days. Have you received any prior offers? Is the seller open to a 22% concession, seller financing, or rate buy-down credit?
- What does the HOA fee cover, when was the last increase, and are there any pending special assessments or reserve-fund shortfalls?
- Any open or pending special assessments — roof, HVAC, plumbing, elevator, façade? What's the per-unit balance and payoff schedule, and is the seller paying it off at close or rolling it to the buyer?
- Why hasn't it sold? Are there any deal-killer items the seller is aware of (foundation, flood, title, zoning, code violations)?
- Is there a deadline driving the sale (1031 exchange, divorce, estate, relocation)? That informs how much negotiation room exists.
- Crime grade is F in this area — have there been break-ins, vandalism, or insurance claims at this property in the last 3 years? What carrier currently insures it and at what premium?
- The area grade is low — what's the realistic commute time and amenity access for the typical tenant pool here? Any planned neighborhood developments (good or bad) we should know about?
- What's the average days-on-market for RENTAL listings here right now (not sales)? A rising rental-DOM trend means longer vacancies and softer asking-rent achievability than the comps imply.
- What's the recent tenant-quality profile in this submarket — average credit score on applications, eviction rate, late-payment / NSF rate, and stable-employment percentage? A property-management company in the area should have these aggregated.
- How much new apartment / multifamily construction is in the pipeline within 1–3 miles? Heavy new supply (>2% of stock underway) typically softens rents 12–24 months out; light construction supports rent growth.
Investment metrics
- 1% rule
- 1.10% ✓
- Cap rate
- 4.48%
- Cash-on-cash
- -6.49%
- DSCR
- 0.71
- GRM
- 7.6
CMA / ARV
- ARV (median comp)
- $205,762
- List price
- $115,000
- Delta
- -44.11%
- Verdict
- UNDERPRICED
- Comps
- 20 within 1.0 mi
Projected returns pro-forma
-3.0% appreciation · 0.0% rent growth · sell at horizon
- IRR
- -32.7%
- Equity multiple
- -0.03×
- Total profit
- $-33,170
- Equity at exit
- $17,147
- IRR
- -76.6%
- Equity multiple
- -0.75×
- Total profit
- $-56,426
- Equity at exit
- $9,943
Cash invested: $32,200 (down + closing). Projections, not guarantees.
Landlord ↔ Tenant lean methodology
- Overall (STATE)
- 87 Strongly Landlord-Friendly
- State Arizona
- 87 Strongly Landlord-Friendly · R+3
- County
- — inherits STATE
- City
- — inherits STATE
ZIP-level market 85032
- Rents YoY
- -1.5%
- Active inventory
- 337
- Price-to-rent
- 7.6×
Monthly cashflow live
- Estimated rent
- $1,260 high interval (Pro) →
- Mortgage (P&I)
- −$603
- Tax est. 1.5%
- −$144 /mo · $1,725/yr
- Insurance
- −$48
- HOA
- −$375
- Vacancy / Maint / Mgmt
- −$265
- Net cashflow
- $-174
Break-even live
UW: 25.0% down · 7.5% · 30yr · 1.5% tax · 5.0% vac · 8.0% maint · 8.0% mgmt
Financing live
Cash to close
- Down payment
- $28,750
- Closing costs
- $3,450
- Reserves months
- —
- Total cash needed
- —
Loan-product check · same deal, 3 products live
Conventional
25% down · 7.5% · 30yr
- Down + closing
- —
- Monthly P&I
- —
- Monthly cashflow
- —
- DSCR
- —
- Eligible?
- —
Personal DTI + credit; lowest rate.
DSCR
20% down · 8.5% · 30yr
- Down + closing
- —
- Monthly P&I
- —
- Monthly cashflow
- —
- DSCR
- —
- Eligible?
- —
No personal income docs; deal must DSCR.
Hard money
10% down · 12.0% · 12mo
- Down + closing
- —
- Monthly P&I
- —
- Monthly cashflow
- —
- DSCR
- —
- Eligible?
- —
Short-term bridge; refi at stabilization.
Rent comps 23 comps
| Address | Beds | Baths | Sqft | Rent | $/sqft | DOM | Units | Dist |
|---|---|---|---|---|---|---|---|---|
| 18202 N Cave Creek Rd Phoenix, AZ | 1.0–3.0 | 1.0–2.0 | 722 | $795 | $1.10 | 4d | 7 | 0.04mi |
| 18416 N Cave Creek Rd Phoenix, AZ | 2.0 | 1.0–2.0 | 786 | $1,975 | $2.51 | 4d | 9 | 0.11mi |
| 18416 N Cave Creek Rd Unit 6 Phoenix, AZ | 1.0 | 1.0 | 748 | $1,250 | $1.67 | 8d | 1 | 0.16mi |
| 18660 N Cave Creek Rd Phoenix, AZ | 1.0–3.0 | 1.0–2.0 | 961 | $1,290 | $1.34 | 2d | 11 | 0.29mi |
| 2077 E Charleston Ave Phoenix, AZ | 2.0 | 1.0 | 720 | $1,295 | $1.80 | 24d | 1 | 0.32mi |
| 17602 N Cave Creek Rd Phoenix, AZ | 2.0 | 1.0–2.0 | 650 | $1,312 | $2.02 | 2d | 13 | 0.39mi |
| 19635 N Cave Creek Rd Phoenix, AZ | 3.0 | 1.0–2.0 | 999 | $1,354 | $1.36 | 2d | 22 | 0.97mi |
| 16621 N 25th St Phoenix, AZ | 1.0 | 1.0 | 570 | $899 | $1.58 | 8d | 1 | 1.02mi |
| 1750 E Bell Rd Phoenix, AZ | 1.0–2.0 | 1.0 | 700 | $999 | $1.43 | 24d | 1 | 1.02mi |
| 2500 E Marco Polo Rd Phoenix, AZ | 2.0 | 1.0–2.0 | 918 | $1,912 | $2.08 | 2d | 16 | 1.09mi |
| 20050 N Cave Creek Rd Phoenix, AZ | 1.0–2.0 | 1.0–2.0 | 909 | $1,385 | $1.52 | 1d | 10 | 1.11mi |
| 2424 E Grandview Rd Phoenix, AZ | 2.0 | 1.0 | 700 | $1,159 | $1.66 | 24d | 1 | 1.13mi |
| 2424 E Grandview Rd Phoenix, AZ | 2.0 | 1.0 | 700 | $942 | $1.35 | 22d | 1 | 1.13mi |
| 2424 E Grandview Rd Phoenix, AZ | 2.0 | 1.0 | 575 | $856 | $1.49 | 4d | 6 | 1.13mi |
| 2424 E Grandview Rd Apt 310 Phoenix, AZ | 2.0 | 1.0 | 700 | $942 | $1.35 | 24d | 1 | 1.14mi |
| 2424 E Grandview Rd Unit 112 Phoenix, AZ | 1.0 | 1.0 | 550 | $856 | $1.56 | 24d | 1 | 1.14mi |
| 2424 E Grandview Rd Unit 312 Phoenix, AZ | 1.0 | 1.0 | 550 | $856 | $1.56 | 22d | 1 | 1.14mi |
| 2424 E Grandview Rd Unit 107 Phoenix, AZ | 2.0 | 1.0 | 700 | $829 | $1.18 | 24d | 1 | 1.14mi |
| 1450 E Bell Rd Phoenix, AZ | 1.0–3.0 | 1.0–2.0 | 957 | $1,027 | $1.07 | 2d | 93 | 1.27mi |
| 2220 E Beardsley Rd Phoenix, AZ | 4.0 | 1.0–2.0 | 855 | $1,424 | $1.67 | 3d | 62 | 1.27mi |
| 16645 N 31st St Phoenix, AZ | 2.0 | 1.0 | 483 | $1,297 | $2.68 | 2d | 6 | 1.34mi |
| 16437 N 31st St Phoenix, AZ | 1.0–2.0 | 1.0 | 687 | $849 | $1.23 | 2d | 4 | 1.40mi |
| 2826 E Le Marche Ave Unit 102 Phoenix, AZ | 1.0 | 1.0 | 725 | $1,000 | $1.38 | 5d | 1 | 1.45mi |
HOA detail condo
- Monthly dues
- $375 · $4,500/yr
- Likely covers
- landscapingpool
- Assessments
- None detected in remarks — confirm with the listing agent.
Listing history 26 events
-
2026-06-18days on market $115,000 Active 61 DOM
-
2026-06-17days on market $115,000 Active 60 DOM
-
2026-06-16days on market $115,000 Active 59 DOM
-
2026-06-15days on market $115,000 Active 58 DOM
-
2026-06-13days on market $115,000 Active 56 DOM
-
2026-06-13days on market $115,000 Active 55 DOM
-
2026-06-09days on market $115,000 Active 52 DOM
-
2026-06-08days on market $115,000 Active 51 DOM
-
2026-06-07days on market $115,000 Active 50 DOM
-
2026-06-04days on market $115,000 Active 47 DOM
-
2026-06-03days on market $115,000 Active 46 DOM
-
2026-06-02days on market $115,000 Active 45 DOM
-
2026-06-01days on market $115,000 Active 44 DOM
-
2026-05-31days on market $115,000 Active 43 DOM
-
2026-04-17$115,000 Active 311-char remark
Show marketing remark (311 chars)
1 bed / 1 bath condo. Great investment property for investors. Close to 101/FRWY AND SR 51. Minutes from Desert ridge Market Place. This complex offers amenities like a pool, Lush Landscaping, Close to shopping and dining. Tenant in place. Current rent $1050/mo. with room to raise rent. month to month lease.
-
2021-06-22soldstatus $105,000
-
2021-03-11Under Contract Accepting Backups
-
2021-03-08$105,000
-
2018-01-12soldstatus $35,000
-
2017-03-07historical
-
2017-02-10$34,900 Active
-
2016-08-26historical
-
2016-03-04$39,900 Active
-
2006-10-30soldstatus $1,500,000
-
2002-11-01soldstatus $4,769,000
-
1993-05-27soldstatus $4,912,750
ⓘ Source: listings_history table (triggers on properties + properties_extension) + one-shot
backfill from property_details.listing_events for pre-trigger history.
Climate risk First Street
- Flood 1/10 Low FEMA zone X (shaded) · 0% chance over 30 yrs
- Wildfire 4/10 Moderate
- Heat 8/10 Severe 6 d/yr ≥110°F today · 15 d/yr by 30 yrs out
- Wind 1/10 Low
- Air quality 3/10 Moderate 3 unhealthy d/yr today · 5 by 30 yrs out
Nearby sold comps map
Loading sold comps map…
Walkable amenities ~0.75 mi
Loading nearby amenities…
Taxation est. · year 1
- Rental income
- $15,123
- − Mortgage interest
- −$6,442
- − Property taxes
- −$1,725
- − Insurance
- −$575
- − Repairs & maintenance
- −$1,210
- − Management
- −$1,210
- − HOA
- −$4,500
- − Depreciation
- −$3,345
- Taxable loss
- −$3,884
- Est. tax savings @ 24.0%
- +$932
- After-tax cash flow
- $-1,158/yr
For passive investors: Depreciation is non-cash, so a rental often shows a tax loss while cash-flowing — sheltering income. Rental losses are passive: they offset passive income freely, and up to $25,000/yr can offset ordinary (W-2) income if you actively participate and your MAGI is under $100k (phasing out to $0 by $150k); unused losses carry forward. On sale, claimed depreciation is recaptured at up to 25%, and gains may owe capital-gains tax (a 1031 exchange can defer both). Figures are a year-1 estimate at your 24.0% rate — not tax advice; consult a CPA.
Schools (NCES district)
- District
- Paradise Valley Unified District (4241)
- NCES district ID
- 0405930
- Math proficiency
- 39% ▼ -11.00%
- Reading proficiency
- 46% ▼ -7.00%
- Median HH income
- $64,106
- Composite
- 37.89/100
- National rank
- #4316
- State rank
- #56 of 249 in AZ
Livability — Phoenix
- Score
- 75/100
- State rank
- #16
- US rank
- #3924
Category grades
Schools grade is shown separately in the Schools card above.
Census & demographics
- Census place
- Phoenix, AZ
- County
- Maricopa County · 4,537,380 people
- City population
- 1,500,198
- Metro
- Phoenix-Mesa-Chandler, AZ
- Population (ZIP)
- 70,839
- Household income
- $78,643
- Rent vs Own
- Severe rent burden
- 2887.0
Population outlook (Maricopa County) Hauer SSP2
- Today (2025)
- 4,979,203 people
- By 2030
- 5,378,229 · +8.0%
- By 2040
- 6,156,598 · +23.6%
- By 2050
- 6,872,376 · +38.0%
- By 2075
- 8,401,270 · +68.7%
- By 2100
- 9,247,439 · +85.7%
Race, ethnicity, and origin ACS 2023
- Neighborhood character
- Diverse neighborhood (Simpson 0.57)
- Race & ethnicity
- White 59% Hispanic / Latino 29% Two or more races 17% Asian 4% Black 3% Native American 2%
- Hispanic origin (detail)
- Mexican 25%
- Common ancestry
- Romanian 2% Slovak 2% Portuguese 2%
- Foreign-born
- 18% · Canada, China
- Languages at home
- 71% English-only · Spanish 21% Russian/Polish/Slavic 2% Other Indo-European 1%
Political lean MEDSL · Maricopa
- 2024 margin
- Toss-up / Even · D 47.7% · R 51.2% · Other 1.1%
- 2008→2024 swing
- +7.1pp toward D · 2008: -10.6pp · 2024: -3.5pp
- All cycles
- 2024: R+3.5 2020: D+2.2 2016: R+3.5 2012: R+12.0 2008: R+10.6
Not yet ingested
- Civics
- —
Market trends
- HPI YoY
- ▼ -488.65%
- Current HPI
- 339.4181
- Rent YoY
- ▼ -1.46%
- Metro
- Phoenix-Mesa-Chandler, AZ
- State GDP YoY
- ▲ 4.54%
- F500 in state
- 20
Industry mix (Fortune 500 HQ in AZ)
| Industry | F500 HQs | Revenue |
|---|---|---|
| Technology | 2 | $13B |
|
||
| Mining / Metals | 1 | $23B |
|
||
| Environmental Services | 1 | $16B |
|
||
| Metals / Steel | 1 | $14B |
|
||
| Technology Distribution | 1 | $9B |
|
||
| Homebuilding | 1 | $8B |
|
||
Price history
-97.7% since first listed12 events — show timeline
- 2026-04-17 Listed $115,000 ARMLS
- 2021-06-22 Sold (Public Records) $105,000 Public Records
- 2021-03-11 Listed — ARMLS
- 2021-03-08 Listed $105,000 ARMLS
- 2018-01-12 Sold (Public Records) $35,000 Public Records
- 2017-03-07 Listing Removed — ARMLS
- 2017-02-10 Listed $34,900 ARMLS
- 2016-08-26 Listing Removed — ARMLS
- 2016-03-04 Listed $39,900 ARMLS
- 2006-10-30 Sold (Public Records) $1,500,000 Public Records
- 2002-11-01 Sold (Public Records) $4,769,000 Public Records
- 1993-05-27 Sold (Public Records) $4,912,750 Public Records
Property tax history
-5.7%/yrLatest (2025): $192 · +2.7% YoY. Source: county tax records.
Cash-flow waterfall
monthlySold comps — $/sqft
last 12 mo · ≤1 miLoading sold comps…