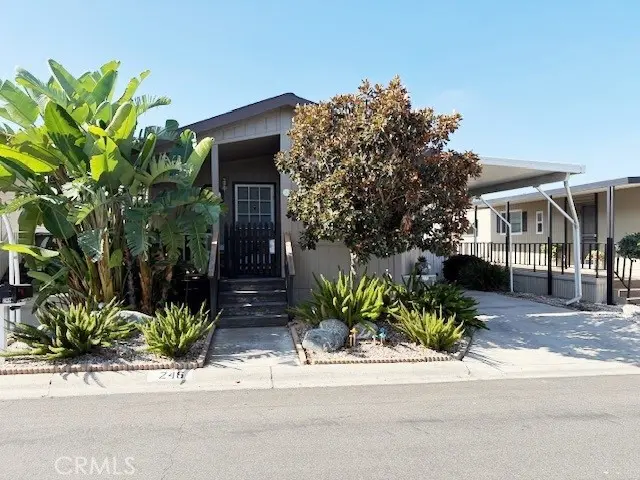
14851 Jeffrey Rd #246 · Irvine, CA
Flood risk 1/10 · Minimal
- FEMA flood zone
- X (unshaded)
- Chance of flooding over 30 yrs
- 0.0%
- Est. flood insurance / yr
- $507 – $1,088
Fire risk 1/10 · Minimal
- Est. fire insurance / yr
- $659 – $1,223
Heat risk 5/10 · Moderate
- Hot days now (above 91°F)
- 6 days/yr
- Hot days in 30 yrs
- 16 days/yr
Wind risk 1/10 · Minimal
- Chance of severe wind over 30 yrs
- —
Air-quality risk 4/10 · Minor
- Unhealthy air days now
- 3 days/yr
- Unhealthy air days in 30 yrs
- 5 days/yr
Risk factors via First Street. Map © Google.
Why this score? — see what drove the A- grade
The composite is a weighted blend of 9 inputs, each scored 0–100. Each bar is that input's sub-score; the figure is the points it added to the 100-point composite (weight × sub-score).
- Cash flow +30.0/30.0
- ARV discount +10.8/15.0
- 1% rule +10.0/10.0
- DSCR +10.0/10.0
- Schools +6.9/10.0
- Appreciation +5.3/10.0
- Livability +3.8/5.0
- Rent growth +3.0/5.0
- Condition / age +2.5/5.0
$199,000
🖨 Deal sheet 📄 Offer letter ✓ Due diligence
Listing remarks MLS
Picture this -- It's your New Home! 2001 Fleetwood Lake Springs Lovely two bedrooms, two bathroom home featuring a living room, dining area, great kitchen and utility room. Outside you will a nice porch, storage shed, air conditioning and extended carport awning supports. * Seller offers a “Buyer incentive of one month free space rent. * S/N CALFL108A/B25527LS12
Key facts
- Great kitchen
- Utility room
- Porch
Tags
Neighborhood map
What this means for you Summary
Snapshot
- This is a 2-bed/2.0-bath manufactured listed at $199k.
Deal economics
- At list price, monthly cash flow is $1k ($17k/yr) — positive.
- The deal already cash-flows at list — no discount required.
- Meets the 1% rule at list price ($4k rent vs $199k).
- Recommended offer: $175k (12.0% below list) — sets the bar for market timing.
- Cap rate 14.8% vs local median 1.2% in Irvine — top-decile yield for the area; either an underpriced asset or a hidden risk that comps aren't pricing in. Stress-test before assuming the spread holds.
Location & tenants
- Location reads 76/100 on livability (#100 in CA, #3,537 nationally) — a middle-class / working-renter tenant base. Strengths: schools A+, crime A+, commute A+; Watch: health & safety C-, cost of living F.
- Irvine Unified (urban): math 74% / reading 80% proficiency, ranked #31 of 517 in CA (top 6%) — strong family-tenant draw, lease renewals of 3-5y typical; only 10% free/reduced lunch — higher-income household profile.
- Market conditions: Rents rising (+2.1%/yr); 455 active listings in the ZIP; 40 comparable units currently listed for rent nearby; rentals at typical pace (median 19d on market — plan ~3-4 weeks tenant-placement turnaround); high-income renter base; 6,974 units permitted in Orange County in 2024 (3,839 in 5+ unit buildings).
Forward outlook
- In year one you build about $3k of equity ($1k loan paydown + $1k appreciation (0.6% local appreciation)).
- Orange County population projected at +14% by 2050 — modest demand growth; plan on rents tracking national, not racing it.
- At projected returns (0.6% appreciation + 2.1% rent growth), your $56k cash investment doubles in ~3 years — after that, you're playing with house money.
Negotiation context
- It's been on market 240 days — a 12% lower offer ($175k) is reasonable based on typical stale-listing flexibility.
Risks & watch-outs
- Climate carrying-cost: extreme-heat days projected 6→16/yr by 2055 (HVAC capex compounding) — expect insurance premiums to compound above CPI over the hold.
Questions for the listing agent
- It's been on market 240 days. Have you received any prior offers? Is the seller open to a 12% concession, seller financing, or rate buy-down credit?
- Why hasn't it sold? Are there any deal-killer items the seller is aware of (foundation, flood, title, zoning, code violations)?
- Is there a deadline driving the sale (1031 exchange, divorce, estate, relocation)? That informs how much negotiation room exists.
- Schools are A-rated — typically a magnet for longer-tenancy family renters. What's the average tenant stay here, and is there a school-zone premium baked into asking?
- What's the average days-on-market for RENTAL listings here right now (not sales)? A rising rental-DOM trend means longer vacancies and softer asking-rent achievability than the comps imply.
- What's the recent tenant-quality profile in this submarket — average credit score on applications, eviction rate, late-payment / NSF rate, and stable-employment percentage? A property-management company in the area should have these aggregated.
- How much new for-sale + rental construction is in the pipeline within 1–3 miles? Heavy new supply typically softens prices + rents 12–24 months out; constrained supply supports both.
Investment metrics
- 1% rule
- 1.77% ✓
- Cap rate
- 14.78%
- Cash-on-cash
- 30.32%
- DSCR
- 2.35
- GRM
- 4.7
CMA / ARV
- ARV (median comp)
- $214,702
- List price
- $199,000
- Delta
- -7.31%
- Verdict
- FAIR
- Comps
- 8 within 1.0 mi
Show comp detail 3 sales within ~0.75 mi
| Address | Dist | Beds/Ba | Sqft | Sold | Price | $/sf | Match |
|---|---|---|---|---|---|---|---|
| 14851 Jeffrey Rd #65 | 0.00mi | 2/2.0 | 1,101 (-2%) | 8mo | $260,000 | $236 | 91 |
| 14851 Jeffrey Rd #226 | 0.00mi | 2/2.0 | 1,120 (0%) | 20mo | $279,000 | $249 | 83 |
| 14851 Jeffrey Rd #16 | 0.00mi | 2/2.0 | 1,248 (+11%) | 13mo | $188,500 | $151 | 70 |
Match score weights: distance 35% · size 25% · config 20% · recency 20%. Top-matched comps best support the ARV.
Projected returns pro-forma
0.64% appreciation · 2.14% rent growth · sell at horizon
- IRR
- 31.2%
- Equity multiple
- 2.56×
- Total profit
- $86,955
- Equity at exit
- $64,258
- IRR
- 33.6%
- Equity multiple
- 4.81×
- Total profit
- $212,374
- Equity at exit
- $82,618
Cash invested: $55,720 (down + closing). Projections, not guarantees.
Landlord ↔ Tenant lean methodology
- Overall (STATE)
- 18 Strongly Tenant-Friendly
- State California
- 18 Strongly Tenant-Friendly · D+13
- County
- — inherits STATE
- City
- — inherits STATE
ZIP-level market 92618
- Home prices YoY
- 0.1%
- Rents YoY
- 2.1%
- Active inventory
- 455
- Price-to-rent
- 4.7×
Monthly cashflow live
- Estimated rent
- $3,523 high interval (Pro) →
- Mortgage (P&I)
- −$1,044
- Tax est. 1.5%
- −$249 /mo · $2,985/yr
- Insurance
- −$83
- HOA
- −$0
- Vacancy / Maint / Mgmt
- −$740
- Net cashflow
- $1,408
Break-even live
UW: 25.0% down · 7.5% · 30yr · 1.5% tax · 5.0% vac · 8.0% maint · 8.0% mgmt
Financing live
Cash to close
- Down payment
- $49,750
- Closing costs
- $5,970
- Reserves months
- —
- Total cash needed
- —
Loan-product check · same deal, 3 products live
Conventional
25% down · 7.5% · 30yr
- Down + closing
- —
- Monthly P&I
- —
- Monthly cashflow
- —
- DSCR
- —
- Eligible?
- —
Personal DTI + credit; lowest rate.
DSCR
20% down · 8.5% · 30yr
- Down + closing
- —
- Monthly P&I
- —
- Monthly cashflow
- —
- DSCR
- —
- Eligible?
- —
No personal income docs; deal must DSCR.
Hard money
10% down · 12.0% · 12mo
- Down + closing
- —
- Monthly P&I
- —
- Monthly cashflow
- —
- DSCR
- —
- Eligible?
- —
Short-term bridge; refi at stabilization.
Rent comps 40 comps
| Address | Beds | Baths | Sqft | Rent | $/sqft | DOM | Units | Dist |
|---|---|---|---|---|---|---|---|---|
| 34 Elksford Ave Irvine, CA | 2.0 | 2.0 | 1078 | $3,280 | $3.04 | 43d | 1 | 0.27mi |
| 4 Austin Irvine, CA | 1.0–2.0 | 1.0–2.0 | 803 | $2,950 | $3.67 | 2d | 5 | 0.30mi |
| 5011 Greencap Ave Irvine, CA | 3.0 | 2.0 | 1216 | $4,400 | $3.62 | 4d | 1 | 0.31mi |
| 51 Golden Glen St #1 Irvine, CA | 3.0 | 2.0 | 1048 | $3,700 | $3.53 | 7d | 1 | 0.32mi |
| 31 Golden Glen St Irvine, CA | 2.0 | 2.0 | 1048 | $3,250 | $3.10 | 11d | 1 | 0.35mi |
| 5151 Walnut Ave #29 Irvine, CA | 2.0 | 3.0 | 1142 | $3,400 | $2.98 | 43d | 1 | 0.43mi |
| 11 Eccelstone Cir Irvine, CA | 3.0 | 2.0 | 1480 | $4,795 | $3.24 | 24d | 1 | 0.50mi |
| 15431 Lorraine Way Irvine, CA | 3.0 | 2.0 | 1450 | $4,500 | $3.10 | 24d | 1 | 0.52mi |
| 8 Albany Irvine, CA | 2.0 | 1.5 | 1011 | $3,100 | $3.07 | 7d | 1 | 0.53mi |
| 1300 Hayes St Irvine, CA | 1.0–3.0 | 1.0–2.0 | 956 | $3,122 | $3.26 | 2d | 23 | 0.59mi |
| 43 Alderwood #69 Irvine, CA | 3.0 | 1.5 | 1220 | $3,700 | $3.03 | 20d | 1 | 0.62mi |
| 26 Elderglen Irvine, CA | 3.0 | 2.0 | 1104 | $4,150 | $3.76 | 20d | 1 | 0.64mi |
| 78 Rose Arch #21 Irvine, CA | 2.0 | 2.0 | 1300 | $3,950 | $3.04 | 43d | 1 | 0.72mi |
| 63 Wildwood Irvine, CA | 2.0 | 1.0 | 928 | $2,850 | $3.07 | 43d | 1 | 0.72mi |
| 19 Wildwood #6 Irvine, CA | 2.0 | 1.0 | 928 | $3,000 | $3.23 | 3d | 1 | 0.75mi |
| 145 Huntington Irvine, CA | 3.0 | 2.5 | 1224 | $3,900 | $3.19 | 43d | 1 | 0.76mi |
| 317 Huntington Irvine, CA | 2.0 | 2.0 | 1000 | $3,100 | $3.10 | 13d | 1 | 0.77mi |
| 30 Dragonfly Irvine, CA | 2.0 | 2.5 | 1068 | $3,800 | $3.56 | 24d | 1 | 0.77mi |
| 49 E Yale Loop #26 Irvine, CA | 3.0 | 2.0 | 1471 | $4,300 | $2.92 | 24d | 1 | 0.79mi |
| 365 Huntington #189 Irvine, CA | 3.0 | 2.5 | 1224 | $3,750 | $3.06 | 43d | 1 | 0.79mi |
| 4 Van Buren #313 Irvine, CA | 2.0 | 2.0 | 903 | $3,300 | $3.65 | 12d | 1 | 0.82mi |
| 29 Autumn Oak Irvine, CA | 2.0 | 1.0 | 928 | $2,950 | $3.18 | 7d | 1 | 0.82mi |
| 16 Brookmont #85 Irvine, CA | 2.0 | 2.0 | 1194 | $4,000 | $3.35 | 19d | 1 | 0.87mi |
| 30 Sunfish #44 Irvine, CA | 2.0 | 2.0 | 990 | $4,000 | $4.04 | 3d | 1 | 0.88mi |
| 8 Hollowglen Irvine, CA | 2.0 | 1.5 | 1037 | $3,345 | $3.23 | 43d | 1 | 0.88mi |
| 13 Brookmont #60 Irvine, CA | 2.0 | 2.0 | 1230 | $4,300 | $3.50 | 7d | 1 | 0.90mi |
| 21 Tarocco Irvine, CA | 2.0 | 2.0 | 951 | $3,200 | $3.36 | 19d | 1 | 0.90mi |
| 194 Rose Arch Irvine, CA | 2.0 | 2.5 | 1441 | $4,000 | $2.78 | 7d | 1 | 0.94mi |
| 44 Briarwood Irvine, CA | 2.0 | 1.5 | 1037 | $3,100 | $2.99 | 43d | 1 | 0.95mi |
| 225 Tarocco Irvine, CA | 2.0 | 2.0 | 1000 | $3,100 | $3.10 | 2d | 1 | 0.97mi |
| 102 Tangerine Irvine, CA | 3.0 | 2.0 | 1445 | $4,150 | $2.87 | 13d | 1 | 0.98mi |
| 269 Tarocco Irvine, CA | 2.0 | 2.0 | 951 | $2,650 | $2.79 | 11d | 1 | 1.00mi |
| 285 Tarocco Irvine, CA | 2.0 | 2.0 | 951 | $3,200 | $3.36 | 43d | 1 | 1.00mi |
| 263 Tarocco Irvine, CA | 2.0 | 2.0 | 1000 | $3,300 | $3.30 | 43d | 1 | 1.00mi |
| 100 Grand Canal Irvine, CA | 1.0–2.0 | 1.0–2.5 | 901 | $4,440 | $4.93 | 2d | 107 | 1.01mi |
| 50 Eastshore Irvine, CA | 1.0–3.0 | 1.0–2.0 | 816 | $3,365 | $4.12 | 2d | 34 | 1.02mi |
| 224 Orange Blossom Irvine, CA | 2.0 | 1.0 | 868 | $2,900 | $3.34 | 24d | 1 | 1.06mi |
| 381 Orange Blossom Irvine, CA | 1.0 | 1.0 | 750 | $2,625 | $3.50 | 43d | 1 | 1.06mi |
| 382 Orange Blossom Irvine, CA | 1.0 | 1.0 | 717 | $2,395 | $3.34 | 10d | 1 | 1.06mi |
| 461 Orange Blossom Irvine, CA | 2.0 | 2.0 | 900 | $3,100 | $3.44 | 13d | 1 | 1.11mi |
Listing history 20 events
-
2026-06-18days on market $199,000 Active 240 DOM
-
2026-06-17days on market $199,000 Active 239 DOM
-
2026-06-16days on market $199,000 Active 238 DOM
-
2026-06-15days on market $199,000 Active 237 DOM
-
2026-06-13days on market $199,000 Active 235 DOM
-
2026-06-13days on market $199,000 Active 234 DOM
-
2026-06-10remarks 411-char remark
-
2026-06-10price $199,000 Active 231 DOM
-
2026-06-09days on market $205,000 Active 231 DOM
-
2026-06-08days on market $205,000 Active 230 DOM
-
2026-06-07days on market $205,000 Active 229 DOM
-
2026-06-04days on market $205,000 Active 226 DOM
-
2026-06-03days on market $205,000 Active 225 DOM
-
2026-06-02days on market $205,000 Active 224 DOM
-
2026-06-01days on market $205,000 Active 223 DOM
-
2026-05-31days on market $205,000 Active 222 DOM
-
2026-04-21price $205,000 386-char remark
Show marketing remark (386 chars)
Picture this -- It's your New Home! 2001 Fleetwood Lake Springs Lovely two bedrooms, two bathroom home featuring a living room, dining area, great kitchen and utility room. Outside you will a nice porch, storage shed, air conditioning and extended carport awning supports. * Seller offers a “Buyer incentive of one month free space rent. * S/N CALFL108A/B25527LS12
-
2026-02-27price $215,000 386-char remark
Show marketing remark (386 chars)
Picture this -- It's your New Home! 2001 Fleetwood Lake Springs Lovely two bedrooms, two bathroom home featuring a living room, dining area, great kitchen and utility room. Outside you will a nice porch, storage shed, air conditioning and extended carport awning supports. * Seller offers a “Buyer incentive of one month free space rent. * S/N CALFL108A/B25527LS12
-
2025-12-11price $225,000 386-char remark
Show marketing remark (386 chars)
Picture this -- It's your New Home! 2001 Fleetwood Lake Springs Lovely two bedrooms, two bathroom home featuring a living room, dining area, great kitchen and utility room. Outside you will a nice porch, storage shed, air conditioning and extended carport awning supports. * Seller offers a “Buyer incentive of one month free space rent. * S/N CALFL108A/B25527LS12
-
2025-10-21$230,000 Active 386-char remark
Show marketing remark (386 chars)
Picture this -- It's your New Home! 2001 Fleetwood Lake Springs Lovely two bedrooms, two bathroom home featuring a living room, dining area, great kitchen and utility room. Outside you will a nice porch, storage shed, air conditioning and extended carport awning supports. * Seller offers a “Buyer incentive of one month free space rent. * S/N CALFL108A/B25527LS12
ⓘ Source: listings_history table (triggers on properties + properties_extension) + one-shot
backfill from property_details.listing_events for pre-trigger history.
Climate risk First Street
- Flood 1/10 Low FEMA zone X (unshaded) · 0% chance over 30 yrs
- Wildfire 1/10 Low
- Heat 5/10 Major 6 d/yr ≥91°F today · 16 d/yr by 30 yrs out
- Wind 1/10 Low
- Air quality 4/10 Moderate 3 unhealthy d/yr today · 5 by 30 yrs out
Nearby sold comps map
Loading sold comps map…
Walkable amenities ~0.75 mi
Loading nearby amenities…
Taxation est. · year 1
- Rental income
- $42,273
- − Mortgage interest
- −$11,147
- − Property taxes
- −$2,985
- − Insurance
- −$995
- − Repairs & maintenance
- −$3,382
- − Management
- −$3,382
- − Depreciation
- −$5,789
- Taxable income
- $14,593
- Est. tax owed @ 24.0%
- −$3,502
- After-tax cash flow
- $13,391/yr
For passive investors: Depreciation is non-cash, so a rental often shows a tax loss while cash-flowing — sheltering income. Rental losses are passive: they offset passive income freely, and up to $25,000/yr can offset ordinary (W-2) income if you actively participate and your MAGI is under $100k (phasing out to $0 by $150k); unused losses carry forward. On sale, claimed depreciation is recaptured at up to 25%, and gains may owe capital-gains tax (a 1031 exchange can defer both). Figures are a year-1 estimate at your 24.0% rate — not tax advice; consult a CPA.
Schools (NCES district)
- District
- Irvine Unified
- NCES district ID
- 0684500
- Math proficiency
- 74% ▲ 1.00%
- Reading proficiency
- 80% ▲ 3.00%
- Median HH income
- $92,078
- Composite
- 69.17/100
- National rank
- #319
- State rank
- #31 of 517 in CA
Livability — Irvine
- Score
- 76/100
- State rank
- #100
- US rank
- #3537
Category grades
Schools grade is shown separately in the Schools card above.
Census & demographics
- Census place
- Irvine, CA
- County
- Orange County · 3,096,323 people
- City population
- 287,839
- Metro
- Los Angeles-Long Beach-Anaheim, CA
- Population (ZIP)
- 66,126
- Household income
- $145,731
- Rent vs Own
- Severe rent burden
- 4078.0
Population outlook (Orange County) Hauer SSP2
- Today (2025)
- 3,477,456 people
- By 2030
- 3,613,117 · +3.9%
- By 2040
- 3,835,945 · +10.3%
- By 2050
- 3,968,736 · +14.1%
- By 2075
- 4,097,053 · +17.8%
- By 2100
- 3,903,633 · +12.3%
Race, ethnicity, and origin ACS 2023
- Neighborhood character
- Diverse neighborhood (Simpson 0.65)
- Race & ethnicity
- Asian 48% White 33% Hispanic / Latino 11% Two or more races 10% Black 1%
- Hispanic origin (detail)
- Mexican 7%
- Common ancestry
- Italian 3% Romanian 2% Scotch-Irish 1%
- Foreign-born
- 42% · China, South Korea, Canada
- Languages at home
- 44% English-only · Chinese 15% Other Indo-European 10% Korean 8%
Political lean MEDSL · Orange
- 2024 margin
- Toss-up / Even · D 49.7% · R 47.1% · Other 3.2%
- 2008→2024 swing
- +5.2pp toward D · 2008: -2.6pp · 2024: 2.6pp
- All cycles
- 2024: D+2.6 2020: D+9.0 2016: D+7.7 2012: R+8.3 2008: R+2.6
Not yet ingested
- Civics
- —
Market trends
- HPI YoY
- ▲ 0.64%
- Current HPI
- 441.9409
- Rent YoY
- ▲ 2.14%
- Metro
- Los Angeles-Long Beach-Anaheim, CA
- State GDP YoY
- ▲ 3.21%
- F500 in state
- 116
Industry mix (Fortune 500 HQ in CA)
| Industry | F500 HQs | Revenue |
|---|---|---|
| Technology | 27 | $1,492B |
|
||
| Financial Services | 3 | $174B |
|
||
| Retail | 3 | $44B |
|
||
| Insurance | 3 | $26B |
|
||
| Media / Entertainment | 2 | $115B |
|
||
| Pharmaceuticals / Biotech | 2 | $62B |
|
||
Price history
-10.9% since first listed4 events — show timeline
- 2026-04-21 Price Changed $205,000 CRMLS
- 2026-02-27 Price Changed $215,000 CRMLS
- 2025-12-11 Price Changed $225,000 CRMLS
- 2025-10-21 Listed $230,000 CRMLS
Property tax history
-4.1%/yrLatest (2025): $234 · +0.0% YoY. Source: county tax records.
Cash-flow waterfall
monthlySold comps — $/sqft
last 12 mo · ≤1 miLoading sold comps…