 🏗️ New Construction
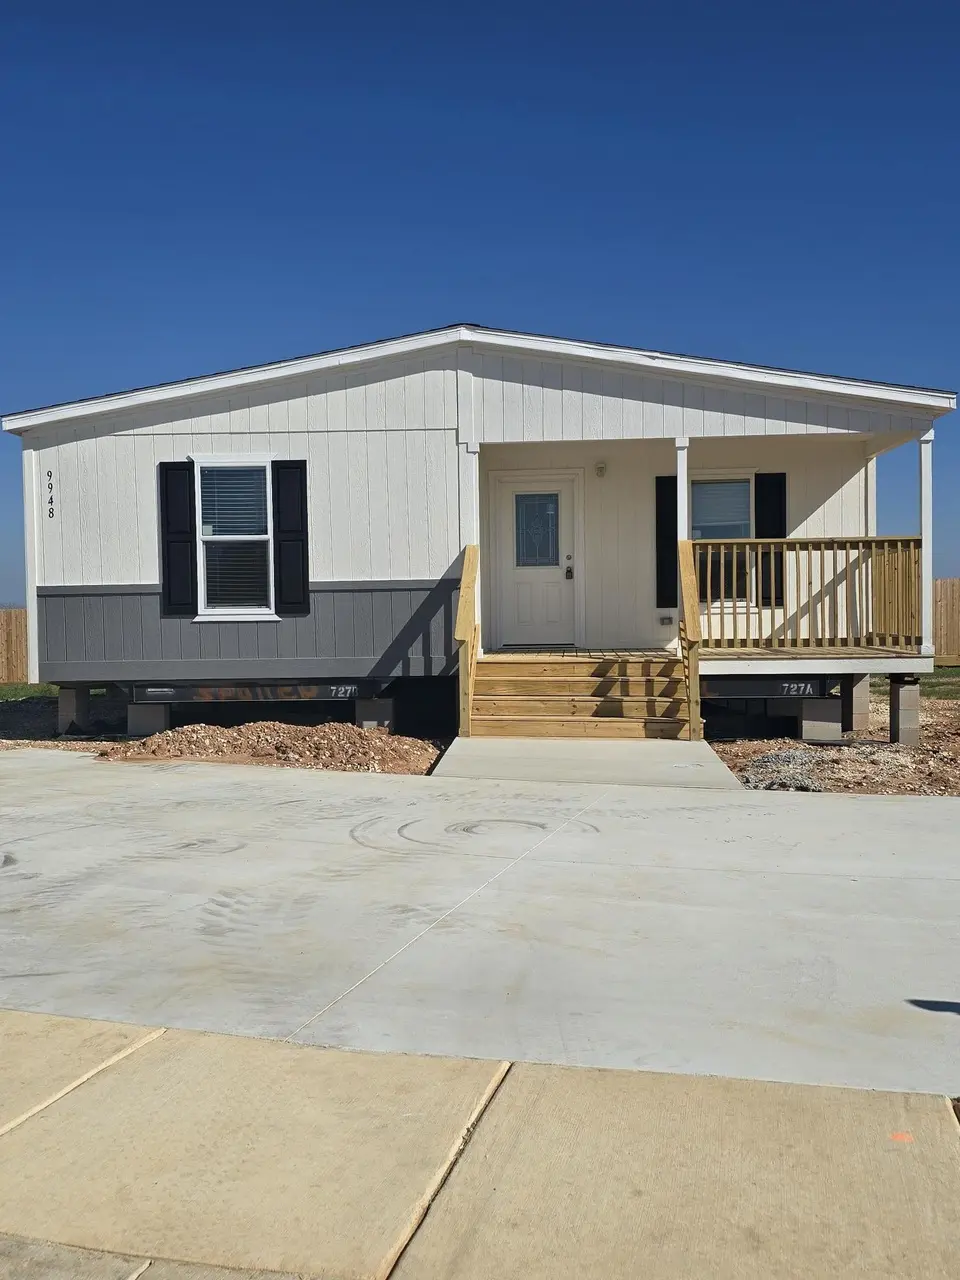
The Wrangler Plan · San Antonio, TX
Flood risk No data
- FEMA flood zone
- —
- Chance of flooding over 30 yrs
- —
- Est. flood insurance / yr
- —
Fire risk No data
- Est. fire insurance / yr
- —
Heat risk No data
- Hot days now (above threshold)
- —
- Hot days in 30 yrs
- —
Wind risk No data
- Chance of severe wind over 30 yrs
- —
Air-quality risk No data
- Unhealthy air days now
- —
- Unhealthy air days in 30 yrs
- —
Risk factors via First Street. Map © Google.
Why this score? — see what drove the B- grade
The composite is a weighted blend of 9 inputs, each scored 0–100. Each bar is that input's sub-score; the figure is the points it added to the 100-point composite (weight × sub-score).
- Cash flow +29.1/30.0
- DSCR +10.0/10.0
- 1% rule +8.1/10.0
- ARV discount +7.5/15.0
- Condition / age +4.8/5.0
- Livability +4.0/5.0
- Rent growth +3.2/5.0
- Schools +1.9/10.0
- Appreciation +0.0/10.0
$134,900
🖨 Deal sheet (PDF) 📄 Offer letter ✓ Due diligence
Listing remarks MLS
Own your own piece of paradise with an affordable manufactured home featuring a charming front porch at Higdon Oaks! Step inside and experience the open floor plan, ideal for entertaining or fostering a sense of connection. Here's what awaits you: Affordable living: Enjoy the freedom of homeownership without breaking the bank. Inviting front porch: Relax and unwind on your own private porch swing, perfect for enjoying fresh air and connecting with neighbors. Open floor plan: The seamless flow between living room, dining area, and kitchen creates a spacious and inviting atmosphere. Large dining area: Host unforgettable gatherings and family meals in this generously sized space. Modern features: Enjoy energy-efficient appliances, stylish finishes, and comfortable living spaces. Land Leased not owned. Home owned
Key facts
- Listed 828 days
Neighborhood map
What this means for you Summary
Snapshot
- This is a 3-bed/2.0-bath manufactured listed at $135k. Condition is rated excellent.
Deal economics
- At list price, monthly cash flow is $467 ($6k/yr) — positive.
- The deal already cash-flows at list — no discount required.
- Meets the 1% rule at list price ($2k rent vs $135k).
- Recommended offer: $119k (12.0% below list) — sets the bar for market timing.
- Cap rate 10.4% vs local median 3.8% in San Antonio — top-decile yield for the area; either an underpriced asset or a hidden risk that comps aren't pricing in. Stress-test before assuming the spread holds.
Location & tenants
- Location reads 80/100 on livability (#31 in TX, #1,616 nationally) — a professional / high-income tenant draw. Strengths: amenities A+, commute A+, cost of living A+; Watch: schools C-, crime F.
- East Central ISD (rural): math 16% / reading 25% proficiency, ranked #758 of 826 in TX (top 92%) — low school quality limits family demand, transient renter base, plan for 1-2y turnover; 61% free/reduced lunch — lower-income household profile, screen leases tightly.
- Market conditions: Rents rising (+2.9%/yr); 319 active listings in the ZIP; 18 comparable units currently listed for rent nearby; rentals lingering (median 45d on market — plan ~5-8 weeks vacancy on turnover, expect pricing pressure); 50% of comp listings sitting > 30 days — soft ceiling on asking rent; high-income renter base; 8,308 units permitted in Bexar County in 2024 (2,506 in 5+ unit buildings).
Forward outlook
- Local home prices are declining (-3.0%/yr); year-one equity from $933 of loan paydown is wiped out by about $4k of value loss. Plan a longer hold.
- Bexar County population projected at +50% by 2050 — long-run rental-demand tailwind backs the buy-and-hold thesis.
- At projected returns (-3.0% appreciation + 2.9% rent growth), your $38k cash investment doubles in ~8 years — after that, you're playing with house money.
Negotiation context
- It's been on market 829 days — a 12% lower offer ($119k) is reasonable based on typical stale-listing flexibility.
- 2 sale attempts since 2y ago with the ask held roughly flat each time — persistent listings suggest the price (not the market) is what's stuck; bring a comps-based counter.
Questions for the listing agent
- It's been on market 829 days. Have you received any prior offers? Is the seller open to a 12% concession, seller financing, or rate buy-down credit?
- Why hasn't it sold? Are there any deal-killer items the seller is aware of (foundation, flood, title, zoning, code violations)?
- Is there a deadline driving the sale (1031 exchange, divorce, estate, relocation)? That informs how much negotiation room exists.
- Crime grade is F in this area — have there been break-ins, vandalism, or insurance claims at this property in the last 3 years? What carrier currently insures it and at what premium?
- What's the average days-on-market for RENTAL listings here right now (not sales)? A rising rental-DOM trend means longer vacancies and softer asking-rent achievability than the comps imply.
- What's the recent tenant-quality profile in this submarket — average credit score on applications, eviction rate, late-payment / NSF rate, and stable-employment percentage? A property-management company in the area should have these aggregated.
- How much new for-sale + rental construction is in the pipeline within 1–3 miles? Heavy new supply typically softens prices + rents 12–24 months out; constrained supply supports both.
Investment metrics
- 1% rule
- 1.31% ✓
- Cap rate
- 10.45%
- Cash-on-cash
- 14.85%
- DSCR
- 1.66
- GRM
- 6.3
CMA / ARV
No comps found within radius.
Projected returns pro-forma
-3.0% appreciation · 2.94% rent growth · sell at horizon
- IRR
- 5.3%
- Equity multiple
- 1.21×
- Total profit
- $7,822
- Equity at exit
- $20,114
- IRR
- 14.7%
- Equity multiple
- 2.19×
- Total profit
- $44,804
- Equity at exit
- $11,664
Cash invested: $37,772 (down + closing). Projections, not guarantees.
Landlord ↔ Tenant lean methodology
- Overall (STATE)
- 87 Strongly Landlord-Friendly
- State Texas
- 87 Strongly Landlord-Friendly · R+5
- County
- — inherits STATE
- City
- — inherits STATE
ZIP-level market 77581
- Home prices YoY
- -29.1%
- Rents YoY
- 2.9%
- Active inventory
- 319
- Price-to-rent
- 6.3×
Monthly cashflow live
- Estimated rent
- $1,772 high interval (Pro) →
- Mortgage (P&I)
- −$707
- Tax est. 1.5%
- −$169 /mo · $2,024/yr
- Insurance
- −$56
- HOA
- −$0
- Vacancy / Maint / Mgmt
- −$372
- Net cashflow
- $467
Break-even live
Sensitivity live
| Price | -10% $561 | -5% $514 | +0% $467 | +5% $421 | +10% $374 |
|---|---|---|---|---|---|
| Rent | -10% $327 | -5% $397 | +0% $467 | +5% $537 | +10% $607 |
| Rate | -1.0pp $535 | -0.5pp $502 | base $467 | +0.5pp $432 | +1.0pp $397 |
UW: 25.0% down · 7.5% · 30yr · 1.5% tax · 5.0% vac · 8.0% maint · 8.0% mgmt
Financing live
Cash to close
- Down payment
- $33,725
- Closing costs
- $4,047
- Reserves months
- —
- Total cash needed
- —
Loan-product check · same deal, 3 products live
Conventional
25% down · 7.5% · 30yr
- Down + closing
- —
- Monthly P&I
- —
- Monthly cashflow
- —
- DSCR
- —
- Eligible?
- —
Personal DTI + credit; lowest rate.
DSCR
20% down · 8.5% · 30yr
- Down + closing
- —
- Monthly P&I
- —
- Monthly cashflow
- —
- DSCR
- —
- Eligible?
- —
No personal income docs; deal must DSCR.
Hard money
10% down · 12.0% · 12mo
- Down + closing
- —
- Monthly P&I
- —
- Monthly cashflow
- —
- DSCR
- —
- Eligible?
- —
Short-term bridge; refi at stabilization.
Rent comps 18 comps
| Address | Beds | Baths | Sqft | Rent | $/sqft | DOM | Units | Dist |
|---|---|---|---|---|---|---|---|---|
| 10534 Green Rock Dr San Antonio, TX | 3.0 | 2.5 | 1311 | $1,700 | $1.30 | 44d | 1 | 0.28mi |
| 10519 Green Rock Dr San Antonio, TX | 4.0 | 2.5 | 1643 | $1,900 | $1.16 | 44d | 1 | 0.29mi |
| 10531 Green Rock Dr San Antonio, TX | 3.0 | 2.5 | 1849 | $1,700 | $0.92 | 44d | 1 | 0.30mi |
| 5322 Freshwater Way San Antonio, TX | 3.0 | 2.5 | 1529 | $1,525 | $1.00 | 24d | 1 | 0.37mi |
| 10332 Green Br San Antonio, TX | 3.0 | 2.5 | 1529 | $1,550 | $1.01 | 24d | 1 | 0.37mi |
| 5107 Moni Rock Dr San Antonio, TX | 3.0 | 2.5 | 1529 | $1,585 | $1.04 | 24d | 1 | 0.39mi |
| 10366 Clearwater Way San Antonio, TX | 3.0 | 2.5 | 1529 | $1,550 | $1.01 | 11d | 1 | 0.43mi |
| 10319 Clearwater Way San Antonio, TX | 3.0 | 2.5 | 1529 | $1,500 | $0.98 | 5d | 1 | 0.43mi |
| 10418 Clearwater Way San Antonio, TX | 3.0 | 2.5 | 1529 | $1,550 | $1.01 | 44d | 1 | 0.47mi |
| 10431 Clearwater Way San Antonio, TX | 3.0 | 2.5 | 1529 | $1,550 | $1.01 | 44d | 1 | 0.51mi |
| 10454 Clearwater Way San Antonio, TX | 3.0 | 2.5 | 1239 | $1,425 | $1.15 | 11d | 1 | 0.51mi |
| 10447 Clearwater Way San Antonio, TX | 3.0 | 2.5 | 1420 | $1,500 | $1.06 | 44d | 1 | 0.53mi |
| 10822 Green Brook St San Antonio, TX | 3.0 | 2.0 | 1023 | $1,500 | $1.47 | 44d | 1 | 0.55mi |
| 10471 Clearwater Way San Antonio, TX | 3.0 | 2.5 | 1529 | $1,550 | $1.01 | 24d | 1 | 0.56mi |
| 10929 Presa Way San Antonio, TX | 4.0 | 2.5 | 1503 | $1,450 | $0.96 | 44d | 1 | 0.76mi |
| 11026 Tree Line San Antonio, TX | 3.0 | 2.5 | 1360 | $1,299 | $0.96 | 44d | 1 | 0.78mi |
| 5727 Coopers Xing San Antonio, TX | 3.0 | 2.0 | 1127 | $2,400 | $2.13 | 22d | 1 | 1.18mi |
| 8563 Redhawk Loop San Antonio, TX | 3.0 | 2.5 | 1788 | $1,800 | $1.01 | 15d | 1 | 1.40mi |
Listing history 17 events
-
2026-06-21days on market $134,900 Active 829 DOM
-
2026-06-18days on market $134,900 Active 826 DOM
-
2026-06-17days on market $134,900 Active 825 DOM
-
2026-06-16days on market $134,900 Active 824 DOM
-
2026-06-15days on market $134,900 Active 823 DOM
-
2026-06-13days on market $134,900 Active 821 DOM
-
2026-06-09days on market $134,900 Active 817 DOM
-
2026-06-08days on market $134,900 Active 816 DOM
-
2026-06-07days on market $134,900 Active 815 DOM
-
2026-06-04days on market $134,900 Active 812 DOM
-
2026-06-03days on market $134,900 Active 811 DOM
-
2026-06-02days on market $134,900 Active 810 DOM
-
2026-06-01days on market $134,900 Active 809 DOM
-
2026-05-31days on market $134,900 Active 808 DOM
-
2024-08-02status Active 821-char remark
Show marketing remark (821 chars)
Own your own piece of paradise with an affordable manufactured home featuring a charming front porch at Higdon Oaks! Step inside and experience the open floor plan, ideal for entertaining or fostering a sense of connection. Here's what awaits you: Affordable living: Enjoy the freedom of homeownership without breaking the bank. Inviting front porch: Relax and unwind on your own private porch swing, perfect for enjoying fresh air and connecting with neighbors. Open floor plan: The seamless flow between living room, dining area, and kitchen creates a spacious and inviting atmosphere. Large dining area: Host unforgettable gatherings and family meals in this generously sized space. Modern features: Enjoy energy-efficient appliances, stylish finishes, and comfortable living spaces. Land Leased not owned. Home owned
-
2024-07-23historical 821-char remark
Show marketing remark (821 chars)
Own your own piece of paradise with an affordable manufactured home featuring a charming front porch at Higdon Oaks! Step inside and experience the open floor plan, ideal for entertaining or fostering a sense of connection. Here's what awaits you: Affordable living: Enjoy the freedom of homeownership without breaking the bank. Inviting front porch: Relax and unwind on your own private porch swing, perfect for enjoying fresh air and connecting with neighbors. Open floor plan: The seamless flow between living room, dining area, and kitchen creates a spacious and inviting atmosphere. Large dining area: Host unforgettable gatherings and family meals in this generously sized space. Modern features: Enjoy energy-efficient appliances, stylish finishes, and comfortable living spaces. Land Leased not owned. Home owned
-
2024-03-05$134,900 Active 821-char remark
Show marketing remark (821 chars)
Own your own piece of paradise with an affordable manufactured home featuring a charming front porch at Higdon Oaks! Step inside and experience the open floor plan, ideal for entertaining or fostering a sense of connection. Here's what awaits you: Affordable living: Enjoy the freedom of homeownership without breaking the bank. Inviting front porch: Relax and unwind on your own private porch swing, perfect for enjoying fresh air and connecting with neighbors. Open floor plan: The seamless flow between living room, dining area, and kitchen creates a spacious and inviting atmosphere. Large dining area: Host unforgettable gatherings and family meals in this generously sized space. Modern features: Enjoy energy-efficient appliances, stylish finishes, and comfortable living spaces. Land Leased not owned. Home owned
ⓘ Source: listings_history table (triggers on properties + properties_extension) + one-shot
backfill from property_details.listing_events for pre-trigger history.
Nearby sold comps map
Loading sold comps map…
Walkable amenities ~0.75 mi
Loading nearby amenities…
Taxation est. · year 1
- Rental income
- $21,259
- − Mortgage interest
- −$7,556
- − Property taxes
- −$2,024
- − Insurance
- −$674
- − Repairs & maintenance
- −$1,701
- − Management
- −$1,701
- − Depreciation
- −$3,924
- Taxable income
- $3,679
- Est. tax owed @ 24.0%
- −$883
- After-tax cash flow
- $4,725/yr
For passive investors: Depreciation is non-cash, so a rental often shows a tax loss while cash-flowing — sheltering income. Rental losses are passive: they offset passive income freely, and up to $25,000/yr can offset ordinary (W-2) income if you actively participate and your MAGI is under $100k (phasing out to $0 by $150k); unused losses carry forward. On sale, claimed depreciation is recaptured at up to 25%, and gains may owe capital-gains tax (a 1031 exchange can defer both). Figures are a year-1 estimate at your 24.0% rate — not tax advice; consult a CPA.
Condition & rehab AI · 1 photo
This manufactured home is in excellent condition with no visible repairs or maintenance needed. It offers a good return on investment with updates that can significantly increase its resale and rental value.
Value-add opportunities
- Both Paint exterior siding — Enhances curb appeal and can increase both resale and rental value
- Both Install new front porch railings — Improves safety and adds aesthetic appeal
- Both Add landscaping around the front porch — Enhances curb appeal and can increase both resale and rental value
Renovation cost estimate screening
Value-add ROI direction
- Both Paint exterior siding — Enhances curb appeal and can increase both resale and rental value ↑
- Both Install new front porch railings — Improves safety and adds aesthetic appeal ↑
- Both Add landscaping around the front porch — Enhances curb appeal and can increase both resale and rental value ↑
ⓘ Cost ranges are severity-bucket heuristics (US national rule-of-thumb). Get contractor quotes + a written scope before underwriting a rehab budget.
Schools (NCES district)
- District
- East Central ISD
- NCES district ID
- 4817850
- Math proficiency
- 16% ▼ -12.00%
- Reading proficiency
- 25% ▼ -6.00%
- Median HH income
- $53,941
- Composite
- 18.67/100
- National rank
- #8887
- State rank
- #758 of 826 in TX
Livability — San Antonio
- Score
- 80/100
- State rank
- #31
- US rank
- #1616
Category grades
Schools grade is shown separately in the Schools card above.
Census & demographics
- County
- Brazoria County · 374,982 people
- City population
- 142,397
- Metro
- Houston-The Woodlands-Sugar Land, TX
- Population (ZIP)
- 51,332
- Household income
- $111,139
- Rent vs Own
- Severe rent burden
- 826.0
Population outlook (Bexar County) Hauer SSP2
- Today (2025)
- 2,336,851 people
- By 2030
- 2,560,728 · +9.6%
- By 2040
- 3,020,569 · +29.3%
- By 2050
- 3,493,522 · +49.5%
- By 2075
- 4,668,459 · +99.8%
- By 2100
- 5,533,242 · +136.8%
Race, ethnicity, and origin ACS 2023
- Neighborhood character
- Diverse neighborhood (Simpson 0.66)
- Race & ethnicity
- White 47% Hispanic / Latino 33% Two or more races 20% Black 10% Asian 7%
- Hispanic origin (detail)
- Mexican 26% Puerto Rican 2%
- Common ancestry
- Lithuanian 2% Slovak 2% Romanian 2%
- Foreign-born
- 12% · Canada, Vietnam, Guatemala
- Languages at home
- 77% English-only · Spanish 16% Other Indo-European 3% Vietnamese 2%
Political lean MEDSL · Bexar
- 2024 margin
- Lean D (+9.8) · D 54.3% · R 44.6% · Other 1.1%
- 2008→2024 swing
- +4.2pp toward D · 2008: 5.6pp · 2024: 9.8pp
- All cycles
- 2024: D+9.8 2020: D+18.2 2016: D+13.5 2012: D+4.6 2008: D+5.6
Not yet ingested
- Civics
- —
Market trends
- HPI YoY
- ▼ -100.56%
- Current HPI
- 244.7942
- Rent YoY
- ▲ 2.94%
- Metro
- Houston-The Woodlands-Sugar Land, TX
- State GDP YoY
- ▲ 3.95%
- F500 in state
- 110
Industry mix (Fortune 500 HQ in TX)
| Industry | F500 HQs | Revenue |
|---|---|---|
| Energy | 16 | $1,198B |
|
||
| Technology | 5 | $198B |
|
||
| Engineering / Construction | 4 | $72B |
|
||
| Energy Services | 3 | $60B |
|
||
| Utilities | 3 | $41B |
|
||
| Healthcare | 2 | $330B |
|
||
Price history
3 events — show timeline
- 2024-08-02 Relisted — Zillow
- 2024-07-23 Delisted — Zillow
- 2024-03-05 Listed $134,900 Zillow
Cash-flow waterfall
monthlySold comps — $/sqft
last 12 mo · ≤1 miLoading sold comps…