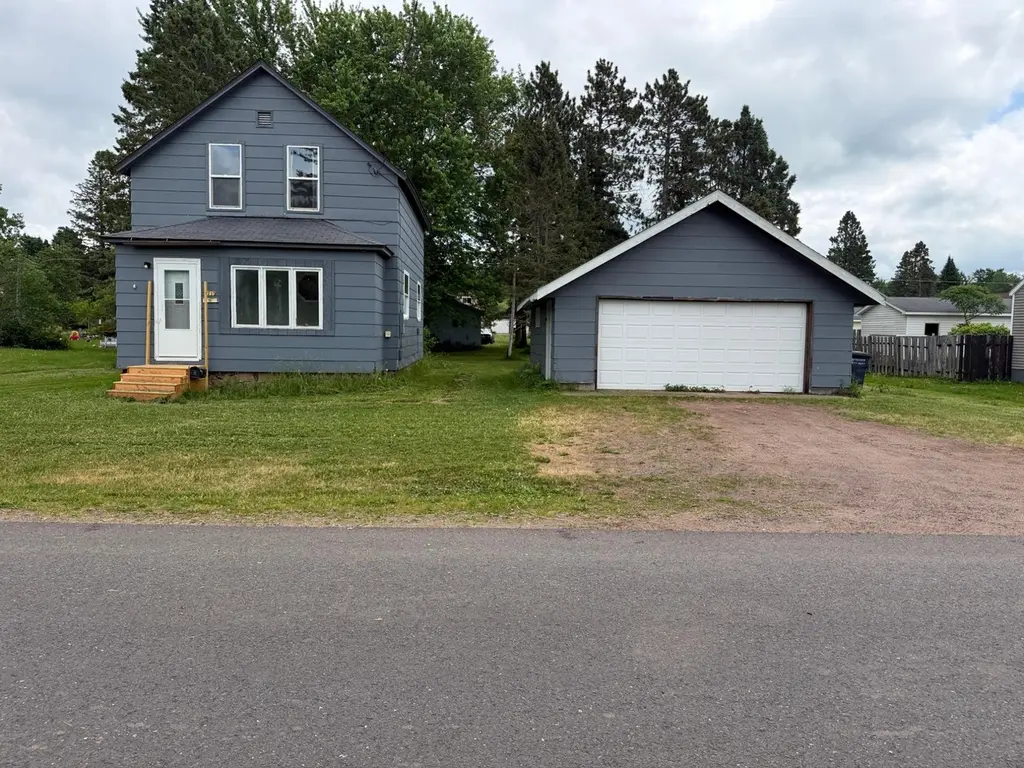
1719 Hadley St · Bessemer, MI
Flood risk 1/10 · Minimal
- FEMA flood zone
- X
- Chance of flooding over 30 yrs
- 0.0%
- Est. flood insurance / yr
- $507 – $1,088
Fire risk 1/10 · Minimal
- Est. fire insurance / yr
- $784 – $1,456
Heat risk 1/10 · Minimal
- Hot days now (above 89°F)
- 7 days/yr
- Hot days in 30 yrs
- 12 days/yr
Wind risk 1/10 · Minimal
- Chance of severe wind over 30 yrs
- —
Air-quality risk 1/10 · Minimal
- Unhealthy air days now
- 0 days/yr
- Unhealthy air days in 30 yrs
- 0 days/yr
Risk factors via First Street. Map © Google.
Why this score? — see what drove the C+ grade
The composite is a weighted blend of 9 inputs, each scored 0–100. Each bar is that input's sub-score; the figure is the points it added to the 100-point composite (weight × sub-score).
- Cash flow +29.5/30.0
- DSCR +10.0/10.0
- 1% rule +8.3/10.0
- Schools +3.7/10.0
- Livability +3.5/5.0
- ARV discount +3.0/15.0
- Rent growth +2.5/5.0
- Condition / age +2.5/5.0
- Appreciation +0.0/10.0
$74,900
🖨 Deal sheet 📄 Offer letter ✓ Due diligence
Listing remarks MLS
Opportunity awaits with this 3-bedroom, 1-bath home situated on a spacious double lot with a detached 2-car garage. Offering plenty of potential for updates and improvements, this property presents an excellent opportunity to add your personal touch and build equity. The home welcomes you through an enclosed front porch featuring a convenient closet for coats, shoes, and additional storage. Inside, you'll find a main level full bathroom and a generously sized living room that leads into the kitchen, creating a functional and comfortable layout. Upstairs, all three bedrooms provide dedicated living space, with two of the bedrooms featuring closets. Outside, the large backyard offers plenty of room for outdoor enjoyment, gardening, or future improvements. The double lot and detached 2-car garage add valuable space and versatility to the property. Whether you're seeking a renovation project, investment opportunity, or a home with room to make it your own, this property offers endless possibilities.
Key facts
- Large backyard
- Double lot
- Enclosed front porch
Tags
Property features AI
Exterior
- Parking: Detached garage (22 x 23) with electric in garage and garage door opener; At least 3 or more parking spaces including 2-car garage
- Utilities: Public water and public sanitary sewer; Electricity connected (100 amp service, circuit breakers); Natural gas connected; Internet (Spectrum)
- Home design: Two-story residential home; Built in 1912; Basement present (below grade area noted)
- Construction: Stone foundation; Exterior constructed of Masonite and hard board; Roof information not provided
- Exterior features: Masonite and hard board exterior; Sidewalks; Large lot (approximately 50 ft frontage; lot noted as 65+ ft frontage in site description); Located within city limits; paved street frontage
Interior
- Kitchen: Kitchen on the main level (approximately 12 x 9) with wood flooring; Range/oven; Refrigerator
- Bedrooms: Three bedrooms located on the second floor — approximately 16 x 10, 10 x 9, and 9 ft; Bedrooms have wood flooring
- Flooring: Wood flooring in bedrooms, kitchen and living areas; Vinyl flooring in bathroom
- Bathrooms: One full bathroom on the main level with vinyl floor (approximately 6 x 6)
- Heating & cooling: Forced air heating (natural gas); Ceiling fan(s) for cooling; Electric water heater
- Interior features: Hardwood floors throughout main living areas; Living room (26 x 12); Main floor full bathroom
- Laundry & utility: Washer and dryer included; Basement present (stone foundation)
Neighborhood map
What this means for you Summary
Snapshot
- This is a 3-bed/1.0-bath single-family listed at $75k.
Deal economics
- At list price, monthly cash flow is $269 ($3k/yr) — positive.
- The deal already cash-flows at list — no discount required.
- Meets the 1% rule at list price ($995 rent vs $75k).
- Cap rate 10.6% vs local median 3.6% in Bessemer — top-decile yield for the area; either an underpriced asset or a hidden risk that comps aren't pricing in. Stress-test before assuming the spread holds.
Location & tenants
- Location reads 70/100 on livability (#298 in MI) — a middle-class / working-renter tenant base. Strengths: cost of living A+, housing A+, health & safety A+; Watch: employment D, amenities F, commute F.
- Bessemer Area School District (rural): math 33% / reading 50% proficiency, ranked #355 of 760 in MI (top 47%) — families likely to look elsewhere, expect single-tenant / working-renter base with shorter leases.
- Market conditions: 36 active listings in the ZIP; 28 units permitted in Gogebic County in 2024 (0 in 5+ unit buildings).
Forward outlook
- Local home prices are declining (-3.0%/yr); year-one equity from $518 of loan paydown is wiped out by about $2k of value loss. Plan a longer hold.
- Gogebic County population projected at -24% by 2050 — secular population decline; favor cash flow + early exit over multi-decade hold.
- At projected returns (-3.0% appreciation + 3.0% rent growth), your $21k cash investment doubles in ~8 years — after that, you're playing with house money.
Negotiation context
- Only 8 days on market — expect competitive offers; lowballing is unlikely to land.
- 5 sale attempts since 3y ago with the ask held roughly flat each time — persistent listings suggest the price (not the market) is what's stuck; bring a comps-based counter.
- Current owner paid $58k; 29% above their basis — modest negotiation headroom, anchor on the comps not their cost.
Risks & watch-outs
- Watch-outs: built in 1912 — expect roof / HVAC / electrical / plumbing capex.
Questions for the listing agent
- Built in 1912 — when were the roof, HVAC, electrical panel, plumbing, and water heater last replaced?
- Is there a deadline driving the sale (1031 exchange, divorce, estate, relocation)? That informs how much negotiation room exists.
- What's the average days-on-market for RENTAL listings here right now (not sales)? A rising rental-DOM trend means longer vacancies and softer asking-rent achievability than the comps imply.
- What's the recent tenant-quality profile in this submarket — average credit score on applications, eviction rate, late-payment / NSF rate, and stable-employment percentage? A property-management company in the area should have these aggregated.
- How much new for-sale + rental construction is in the pipeline within 1–3 miles? Heavy new supply typically softens prices + rents 12–24 months out; constrained supply supports both.
Investment metrics
- 1% rule
- 1.33% ✓
- Cap rate
- 10.60%
- Cash-on-cash
- 15.38%
- DSCR
- 1.68
- GRM
- 6.3
CMA / ARV
- ARV (on-the-fly)
- $68,040
- Comps found
- 5
Show comp detail 5 sales within ~0.75 mi
| Address | Dist | Beds/Ba | Sqft | Sold | Price | $/sf | Match |
|---|---|---|---|---|---|---|---|
| 803 Yale Ave | 0.18mi | 2/1.5 (-1) | 1,000 (+6%) | 1mo | $87,500 | $88 | 74 |
| 1702 S Barber St | 0.12mi | 3/1.0 | 1,008 (+7%) | 13mo | $71,997 | $71 | 72 |
| 1615 S Barber St | 0.17mi | 3/2.0 | 1,008 (+7%) | 6mo | $73,000 | $72 | 72 |
| 803 Yale Ave | 0.18mi | 2/1.5 (-1) | 1,074 (+14%) | 1mo | $87,500 | $81 | 61 |
| 308 4th Ave | 0.73mi | 3/1.5 | 1,077 (+14%) | 24mo | $20,500 | $19 | 21 |
Match score weights: distance 35% · size 25% · config 20% · recency 20%. Top-matched comps best support the ARV.
Projected returns pro-forma
-3.0% appreciation · 3.0% rent growth · sell at horizon
- IRR
- 6.1%
- Equity multiple
- 1.24×
- Total profit
- $4,998
- Equity at exit
- $11,168
- IRR
- 15.5%
- Equity multiple
- 2.26×
- Total profit
- $26,459
- Equity at exit
- $6,476
Cash invested: $20,972 (down + closing). Projections, not guarantees.
Landlord ↔ Tenant lean methodology
- Overall (STATE)
- 62 Landlord-Friendly
- State Michigan
- 62 Landlord-Friendly · EVEN
- County
- — inherits STATE
- City
- — inherits STATE
ZIP-level market 49911
- Home prices YoY
- -14.4%
- Active inventory
- 36
- Price-to-rent
- 6.3×
Monthly cashflow live
- Estimated rent
- $995 medium interval (Pro) →
- Mortgage (P&I)
- −$393
- Tax est. 1.5%
- −$94 /mo · $1,124/yr
- Insurance
- −$31
- HOA
- −$0
- Vacancy / Maint / Mgmt
- −$209
- Net cashflow
- $269
Break-even live
UW: 25.0% down · 7.5% · 30yr · 1.5% tax · 5.0% vac · 8.0% maint · 8.0% mgmt
Financing live
Cash to close
- Down payment
- $18,725
- Closing costs
- $2,247
- Reserves months
- —
- Total cash needed
- —
Loan-product check · same deal, 3 products live
Conventional
25% down · 7.5% · 30yr
- Down + closing
- —
- Monthly P&I
- —
- Monthly cashflow
- —
- DSCR
- —
- Eligible?
- —
Personal DTI + credit; lowest rate.
DSCR
20% down · 8.5% · 30yr
- Down + closing
- —
- Monthly P&I
- —
- Monthly cashflow
- —
- DSCR
- —
- Eligible?
- —
No personal income docs; deal must DSCR.
Hard money
10% down · 12.0% · 12mo
- Down + closing
- —
- Monthly P&I
- —
- Monthly cashflow
- —
- DSCR
- —
- Eligible?
- —
Short-term bridge; refi at stabilization.
Listing history 7 events
-
2026-06-18days on market $74,900 Active 8 DOM
-
2026-06-17days on market $74,900 Active 7 DOM
-
2026-06-16days on market $74,900 Active 6 DOM
-
2026-06-15days on market $74,900 Active 5 DOM
-
2026-06-13days on market $74,900 Active 3 DOM
-
2026-06-12remarks 699-char remark
-
2026-06-12$74,900 Active 2 DOM
ⓘ Source: listings_history table (triggers on properties + properties_extension) + one-shot
backfill from property_details.listing_events for pre-trigger history.
Climate risk First Street
- Flood 1/10 Low FEMA zone X · 0% chance over 30 yrs
- Wildfire 1/10 Low
- Heat 1/10 Low 7 d/yr ≥89°F today · 12 d/yr by 30 yrs out
- Wind 1/10 Low
- Air quality 1/10 Low 0 unhealthy d/yr today · 0 by 30 yrs out
Nearby sold comps map
Loading sold comps map…
Walkable amenities ~0.75 mi
Loading nearby amenities…
Taxation est. · year 1
- Rental income
- $11,946
- − Mortgage interest
- −$4,196
- − Property taxes
- −$1,124
- − Insurance
- −$374
- − Repairs & maintenance
- −$956
- − Management
- −$956
- − Depreciation
- −$2,179
- Taxable income
- $2,162
- Est. tax owed @ 24.0%
- −$519
- After-tax cash flow
- $2,707/yr
For passive investors: Depreciation is non-cash, so a rental often shows a tax loss while cash-flowing — sheltering income. Rental losses are passive: they offset passive income freely, and up to $25,000/yr can offset ordinary (W-2) income if you actively participate and your MAGI is under $100k (phasing out to $0 by $150k); unused losses carry forward. On sale, claimed depreciation is recaptured at up to 25%, and gains may owe capital-gains tax (a 1031 exchange can defer both). Figures are a year-1 estimate at your 24.0% rate — not tax advice; consult a CPA.
Schools (NCES district)
- District
- Bessemer Area School District
- NCES district ID
- 2600006
- Math proficiency
- 33% ▲ 5.00%
- Reading proficiency
- 50% ▲ 12.00%
- Median HH income
- $35,571
- Composite
- 36.69/100
- National rank
- #9217
- State rank
- #355 of 760 in MI
Livability — Bessemer
- Score
- 70/100
- State rank
- #298
- US rank
- #7427
Category grades
Schools grade is shown separately in the Schools card above.
Census & demographics
- Census place
- Bessemer, MI
- Population (ZIP)
- 2,843
Population outlook (Gogebic County) Hauer SSP2
- Today (2025)
- 13,951 people
- By 2030
- 13,191 · -5.4%
- By 2040
- 11,739 · -15.9%
- By 2050
- 10,580 · -24.2%
- By 2075
- 8,530 · -38.9%
- By 2100
- 6,903 · -50.5%
Race, ethnicity, and origin ACS 2023
- Neighborhood character
- Predominantly White (92%)
- Race & ethnicity
- White 92% Two or more races 4% Hispanic / Latino 2% Black 1% Native American 1%
- Common ancestry
- Romanian 5% Hungarian 2% Lithuanian 2%
- Foreign-born
- 2% · Canada
- Languages at home
- 99% English-only · Other Indo-European 1%
Political lean MEDSL · Gogebic
- 2024 margin
- R (+17.1) · D 40.8% · R 57.9% · Other 1.2%
- 2008→2024 swing
- -34.4pp toward R · 2008: 17.3pp · 2024: -17.1pp
- All cycles
- 2024: R+17.1 2020: R+12.5 2016: R+15.0 2012: D+8.1 2008: D+17.3
Not yet ingested
- Civics
- —
Market trends
- HPI YoY
- ▼ -37.15%
- Current HPI
- 219.9901
- Rent YoY
- —
- Metro
- —
- State GDP YoY
- ▲ 1.37%
- F500 in state
- 28
Industry mix (Fortune 500 HQ in MI)
| Industry | F500 HQs | Revenue |
|---|---|---|
| Automotive Parts | 3 | $48B |
|
||
| Automotive | 2 | $372B |
|
||
| Chemicals | 1 | $45B |
|
||
| Automotive Retail | 1 | $29B |
|
||
| Healthcare / Medical Devices | 1 | $23B |
|
||
| Automotive Technology | 1 | $20B |
|
||
Price history
+25.0% since first listed10 events — show timeline
- 2026-06-08 Listed $74,900 GNMLS
- 2026-06-08 Listed $74,900 MiRealSource-MiMLS
- 2026-06-08 Listed $74,900 UPAR
- 2023-07-28 Sold (MLS) $58,150 UPAR
- 2023-07-28 Sold (MLS) $58,150 MiRealSource-MiMLS
- 2023-07-11 Pending — UPAR
- 2023-07-11 Pending — MiRealSource-MiMLS
- 2023-06-26 Contingent — MiRealSource-MiMLS
- 2023-06-15 Listed $59,900 UPAR
- 2023-06-15 Listed $59,900 MiRealSource-MiMLS
Cash-flow waterfall
monthlySold comps — $/sqft
last 12 mo · ≤1 miLoading sold comps…