28454 SE 168th Ave #7 · Lake Morton-Berrydale, WA
Flood risk 1/10 · Minimal
- FEMA flood zone
- X (unshaded)
- Chance of flooding over 30 yrs
- 0.0%
- Est. flood insurance / yr
- $507 – $1,088
Fire risk 3/10 · Minor
- Est. fire insurance / yr
- $604 – $1,122
Heat risk 2/10 · Minimal
- Hot days now (above 87°F)
- 7 days/yr
- Hot days in 30 yrs
- 15 days/yr
Wind risk 1/10 · Minimal
- Chance of severe wind over 30 yrs
- —
Air-quality risk 7/10 · Major
- Unhealthy air days now
- 11 days/yr
- Unhealthy air days in 30 yrs
- 12 days/yr
Risk factors via First Street. Map © Google.
Why this score? — see what drove the B+ grade
The composite is a weighted blend of 9 inputs, each scored 0–100. Each bar is that input's sub-score; the figure is the points it added to the 100-point composite (weight × sub-score).
- Cash flow +30.0/30.0
- ARV discount +15.0/15.0
- 1% rule +10.0/10.0
- DSCR +10.0/10.0
- Schools +4.8/10.0
- Rent growth +2.5/5.0
- Livability +2.5/5.0
- Condition / age +2.5/5.0
- Appreciation +0.0/10.0
$175,000
🖨 Deal sheet 📄 Offer letter ✓ Due diligence
Listing remarks
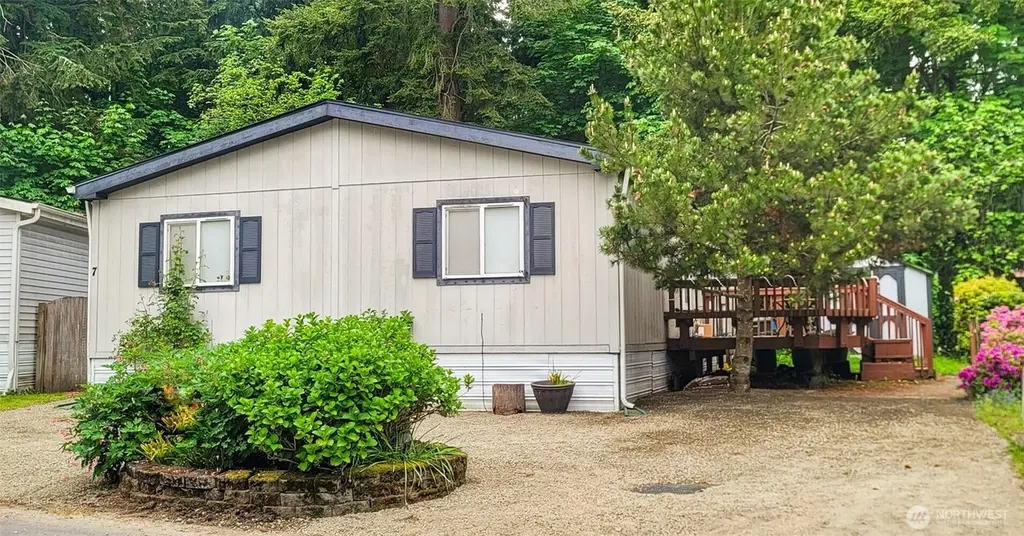
Welcome to your new home located 5 minutes from Costco, downtown Covington and highway 18. There are 3 bedrooms, 2 full bathrooms and a bonus room that could be a 4th bedroom or an office. The entrance has a large living room area, dining room and kitchen that is open. The main bedroom has its own bathroom and privacy from the other rooms. Outside you have 2 sheds for storage and a large deck to enjoy barbeques or just sit around. There are 3 parking spaces and community parking for guests. This is a great community, well maintained. It is move in ready for you.
Key facts
- Large deck
- 2 sheds for storage
- Open kitchen
Tags
Property features AI
Finance
- Other: Calculated building area: 1400 square feet
- Financial info: Land lease: $787; Acceptable financing: Cash, Conventional
- HOA & community: Pleasant Valley Manor park (67 homes); Pets allowed: Cats and dogs; Park approved for sale
Exterior
- Parking: 3 open/uncovered parking spaces
- Utilities: Electric energy source; Public water (Covington Water); Power by PSE
- Home design: Manufactured home (double wide); One story; Entry level: One; Mobile home remains; Make: Lamplighter, Model: 28-50; Skirted with metal
- Construction: Wood construction; Composition roof; Tie down foundation
- Exterior features: Wood exterior; Open space; Paved; Secluded lot; Backyard storage (2 storage units); RV parking (park amenity); Has view
Interior
- Kitchen: Dishwasher; Refrigerator; Stove/Range
- Bedrooms: 3 bedrooms
- Flooring: Laminate; Carpet
- Bathrooms: 1 full bath; 1 three-quarter bath; 1 bathtub; 2 showers
- Heating & cooling: Forced air heating
- Interior features: Den/office; Dining room; Extra finished room; Family room; Utility room; Skylights; Walk-in closet; Bath off primary; Patio/porch/deck
- Laundry & utility: Washer; Dryer
Neighborhood map
What this means for you Summary
Snapshot
- This is a 3-bed/2.0-bath manufactured listed at $175k.
Deal economics
- At list price, monthly cash flow is $880 ($11k/yr) — positive.
- The deal already cash-flows at list — no discount required.
- Meets the 1% rule at list price ($3k rent vs $175k).
- Recommended offer: $172k (1.5% below list) — sets the bar for market timing.
- Cap rate 12.3% vs local median 1.9% in Lake Morton-Berrydale — top-decile yield for the area; either an underpriced asset or a hidden risk that comps aren't pricing in. Stress-test before assuming the spread holds.
Location & tenants
- Location reads: area grade B — affects rentability + tenant quality, not the cash-flow math above.
- Kent School District (urban): math 47% / reading 57% proficiency, ranked #109 of 291 in WA (top 38%) — acceptable for families but not a draw, mixed tenant base, ~2y average lease.
- Zoned schools: Grass Lake Elementary School (393 students, 34% FRL); Kentlake High School (1,440 students, 54% FRL) — zoned schools at 44% FRL track the district average.
- Market conditions: Rents flat; 332 active listings in the ZIP; 5 comparable units currently listed for rent nearby; rentals leasing fast (median 2d on market — plan ~1-2 weeks tenant-placement turnaround); high-income renter base; 10,555 units permitted in King County in 2024 (7,119 in 5+ unit buildings).
Forward outlook
- Local home prices are declining (-3.0%/yr); year-one equity from $1k of loan paydown is wiped out by about $5k of value loss. Plan a longer hold.
- King County population projected at +44% by 2050 — long-run rental-demand tailwind backs the buy-and-hold thesis.
- At projected returns (-3.0% appreciation + 0.2% rent growth), your $49k cash investment doubles in ~7 years — after that, you're playing with house money.
Negotiation context
- It's been on market 21 days — a 2% lower offer ($172k) is reasonable based on typical stale-listing flexibility.
- 5 sale attempts since 26y ago with the ask held roughly flat each time — persistent listings suggest the price (not the market) is what's stuck; bring a comps-based counter.
- Current owner paid $70k; list at $175k implies a 150% gain — meaningful room to come down on a strong offer.
Questions for the listing agent
- Is there a deadline driving the sale (1031 exchange, divorce, estate, relocation)? That informs how much negotiation room exists.
- What's the average days-on-market for RENTAL listings here right now (not sales)? A rising rental-DOM trend means longer vacancies and softer asking-rent achievability than the comps imply.
- What's the recent tenant-quality profile in this submarket — average credit score on applications, eviction rate, late-payment / NSF rate, and stable-employment percentage? A property-management company in the area should have these aggregated.
- How much new for-sale + rental construction is in the pipeline within 1–3 miles? Heavy new supply typically softens prices + rents 12–24 months out; constrained supply supports both.
Investment metrics
- 1% rule
- 1.51% ✓
- Cap rate
- 12.33%
- Cash-on-cash
- 21.55%
- DSCR
- 1.96
- GRM
- 5.5
CMA / ARV
- ARV (on-the-fly)
- $229,600
- Comps found
- 2
Show comp detail 2 sales within ~0.75 mi
| Address | Dist | Beds/Ba | Sqft | Sold | Price | $/sf | Match |
|---|---|---|---|---|---|---|---|
| 28454 168th Ave SE #29 | 0.08mi | 3/2.0 | 1,272 (-9%) | 2mo | $209,000 | $164 | 79 |
| 28454 168th #1 | 0.00mi | 3/2.0 | 1,456 (+4%) | 18mo | $192,000 | $132 | 78 |
Match score weights: distance 35% · size 25% · config 20% · recency 20%. Top-matched comps best support the ARV.
Projected returns pro-forma
-3.0% appreciation · 0.19% rent growth · sell at horizon
- IRR
- 10.9%
- Equity multiple
- 1.42×
- Total profit
- $20,444
- Equity at exit
- $26,093
- IRR
- 17.6%
- Equity multiple
- 2.26×
- Total profit
- $61,906
- Equity at exit
- $15,131
Cash invested: $49,000 (down + closing). Projections, not guarantees.
Landlord ↔ Tenant lean methodology
- Overall (STATE)
- 28 Tenant-Leaning
- State Washington
- 28 Tenant-Leaning · D+8
- County
- — inherits STATE
- City
- — inherits STATE
ZIP-level market 98042
- Rents YoY
- 0.2%
- Active inventory
- 332
- Price-to-rent
- 5.5×
Monthly cashflow live
- Estimated rent
- $2,645 high interval (Pro) →
- Mortgage (P&I)
- −$918
- Tax est. 1.5%
- −$219 /mo · $2,625/yr
- Insurance
- −$73
- HOA
- −$0
- Vacancy / Maint / Mgmt
- −$555
- Net cashflow
- $880
Break-even live
UW: 25.0% down · 7.5% · 30yr · 1.5% tax · 5.0% vac · 8.0% maint · 8.0% mgmt
Financing live
Cash to close
- Down payment
- $43,750
- Closing costs
- $5,250
- Reserves months
- —
- Total cash needed
- —
Loan-product check · same deal, 3 products live
Conventional
25% down · 7.5% · 30yr
- Down + closing
- —
- Monthly P&I
- —
- Monthly cashflow
- —
- DSCR
- —
- Eligible?
- —
Personal DTI + credit; lowest rate.
DSCR
20% down · 8.5% · 30yr
- Down + closing
- —
- Monthly P&I
- —
- Monthly cashflow
- —
- DSCR
- —
- Eligible?
- —
No personal income docs; deal must DSCR.
Hard money
10% down · 12.0% · 12mo
- Down + closing
- —
- Monthly P&I
- —
- Monthly cashflow
- —
- DSCR
- —
- Eligible?
- —
Short-term bridge; refi at stabilization.
Rent comps 5 comps
| Address | Beds | Baths | Sqft | Rent | $/sqft | DOM | Units | Dist |
|---|---|---|---|---|---|---|---|---|
| 16830 SE Wax Rd Covington, WA | 3.0 | 1.0–2.0 | 909 | $2,458 | $2.70 | 1d | 15 | 0.41mi |
| 17110 SE 276th St Covington, WA | 1.0–3.0 | 1.0–2.0 | 852 | $2,220 | $2.61 | 1d | 1 | 0.70mi |
| 18025 SE 272nd St Kent, WA | 1.0–3.0 | 1.0–2.0 | 843 | $2,675 | $3.17 | 1d | 9 | 1.02mi |
| 17126 SE 269th Pl Covington, WA | 1.0–3.0 | 1.0–2.0 | 956 | $2,587 | $2.71 | 1d | 15 | 1.08mi |
| 26520 175th Ave SE Covington, WA | 4.0 | 1.5 | 1590 | $3,149 | $1.98 | 12d | 1 | 1.34mi |
Listing history 24 events
-
2026-06-18days on market $175,000 Active 21 DOM
-
2026-06-17days on market $175,000 Active 20 DOM
-
2026-06-16days on market $175,000 Active 19 DOM
-
2026-06-15days on market $175,000 Active 18 DOM
-
2026-06-13days on market $175,000 Active 16 DOM
-
2026-06-09days on market $175,000 Active 12 DOM
-
2026-06-08days on market $175,000 Active 11 DOM
-
2026-06-07days on market $175,000 Active 10 DOM
-
2026-06-04days on market $175,000 Active 7 DOM
-
2026-06-03days on market $175,000 Active 6 DOM
-
2026-06-02days on market $175,000 Active 5 DOM
-
2026-06-01days on market $175,000 Active 4 DOM
-
2026-05-31days on market $175,000 Active 3 DOM
-
2026-05-28$175,000 Active
-
2018-08-29soldstatus $70,000 Sold
-
2018-08-02status Pending
-
2018-07-29status Pending Inspection
-
2018-07-18status Active
-
2018-07-12status Pending Inspection
-
2018-06-21$74,950 Active
-
2006-04-07soldstatus $45,000
-
2005-08-04$45,000
-
2000-08-25soldstatus $59,000
-
2000-05-19$59,500
ⓘ Source: listings_history table (triggers on properties + properties_extension) + one-shot
backfill from property_details.listing_events for pre-trigger history.
Climate risk First Street
- Flood 1/10 Low FEMA zone X (unshaded) · 0% chance over 30 yrs
- Wildfire 3/10 Moderate
- Heat 2/10 Low 7 d/yr ≥87°F today · 15 d/yr by 30 yrs out
- Wind 1/10 Low
- Air quality 7/10 Severe 11 unhealthy d/yr today · 12 by 30 yrs out
Nearby sold comps map
Loading sold comps map…
Walkable amenities ~0.75 mi
Loading nearby amenities…
Taxation est. · year 1
- Rental income
- $31,734
- − Mortgage interest
- −$9,803
- − Property taxes
- −$2,625
- − Insurance
- −$875
- − Repairs & maintenance
- −$2,539
- − Management
- −$2,539
- − Depreciation
- −$5,091
- Taxable income
- $8,263
- Est. tax owed @ 24.0%
- −$1,983
- After-tax cash flow
- $8,574/yr
For passive investors: Depreciation is non-cash, so a rental often shows a tax loss while cash-flowing — sheltering income. Rental losses are passive: they offset passive income freely, and up to $25,000/yr can offset ordinary (W-2) income if you actively participate and your MAGI is under $100k (phasing out to $0 by $150k); unused losses carry forward. On sale, claimed depreciation is recaptured at up to 25%, and gains may owe capital-gains tax (a 1031 exchange can defer both). Figures are a year-1 estimate at your 24.0% rate — not tax advice; consult a CPA.
Schools (NCES district)
- District
- Kent School District
- NCES district ID
- 5303960
- Math proficiency
- 47% ▼ -1.00%
- Reading proficiency
- 57% ▼ -1.00%
- Median HH income
- $69,823
- Composite
- 48.25/100
- National rank
- #4714
- State rank
- #109 of 291 in WA
Livability — Lake Morton-Berrydale
No livability data for this city. (Only ~50 U.S. cities are tracked.)
Census & demographics
- Census place
- Lake Morton-Berrydale, WA
- County
- King County · 2,251,916 people
- Metro
- Seattle-Tacoma-Bellevue, WA
- Population (ZIP)
- 50,216
- Household income
- $127,552
- Rent vs Own
- Severe rent burden
- 892.0
Population outlook (King County) Hauer SSP2
- Today (2025)
- 2,576,485 people
- By 2030
- 2,803,316 · +8.8%
- By 2040
- 3,255,921 · +26.4%
- By 2050
- 3,706,444 · +43.9%
- By 2075
- 4,746,063 · +84.2%
- By 2100
- 5,407,730 · +109.9%
Race, ethnicity, and origin ACS 2023
- Neighborhood character
- Diverse neighborhood (Simpson 0.58)
- Race & ethnicity
- White 62% Asian 13% Hispanic / Latino 12% Two or more races 12% Black 6%
- Hispanic origin (detail)
- Mexican 8%
- Common ancestry
- Portuguese 4% Subsaharan African 3% Italian 3%
- Foreign-born
- 19% · Canada, Vietnam, China
- Languages at home
- 75% English-only · Spanish 7% Russian/Polish/Slavic 4% Other Indo-European 3%
Political lean MEDSL · King
- 2024 margin
- Solid D (+51.7) · D 74.2% · R 22.5% · Other 3.4%
- 2008→2024 swing
- +9.6pp toward D · 2008: 42.1pp · 2024: 51.7pp
- All cycles
- 2024: D+51.7 2020: D+52.7 2016: D+50.4 2012: D+39.9 2008: D+42.1
Not yet ingested
- Civics
- —
Market trends
- HPI YoY
- ▼ -635.61%
- Current HPI
- 297.7991
- Rent YoY
- ▲ 0.19%
- Metro
- Seattle-Tacoma-Bellevue, WA
- State GDP YoY
- ▲ 4.65%
- F500 in state
- 22
Industry mix (Fortune 500 HQ in WA)
| Industry | F500 HQs | Revenue |
|---|---|---|
| Retail | 2 | $269B |
|
||
| Technology / Retail | 1 | $638B |
|
||
| Technology | 1 | $245B |
|
||
| Telecommunications | 1 | $38B |
|
||
| Food / Beverage | 1 | $36B |
|
||
| Automotive / Trucks | 1 | $34B |
|
||
Price history
+194.1% since first listed11 events — show timeline
- 2026-05-28 Listed $175,000 NWMLS as Distributed by MLS Grid
- 2018-08-29 Sold (MLS) $70,000 NWMLS as Distributed by MLS Grid
- 2018-08-02 Pending — NWMLS as Distributed by MLS Grid
- 2018-07-29 Pending — NWMLS as Distributed by MLS Grid
- 2018-07-18 Relisted — NWMLS as Distributed by MLS Grid
- 2018-07-12 Pending — NWMLS as Distributed by MLS Grid
- 2018-06-21 Listed $74,950 NWMLS as Distributed by MLS Grid
- 2006-04-07 Sold (MLS) $45,000 NWMLS as Distributed by MLS Grid
- 2005-08-04 Listed $45,000 NWMLS as Distributed by MLS Grid
- 2000-08-25 Sold (MLS) $59,000 NWMLS as Distributed by MLS Grid
- 2000-05-19 Listed $59,500 NWMLS as Distributed by MLS Grid
Cash-flow waterfall
monthlySold comps — $/sqft
last 12 mo · ≤1 miLoading sold comps…