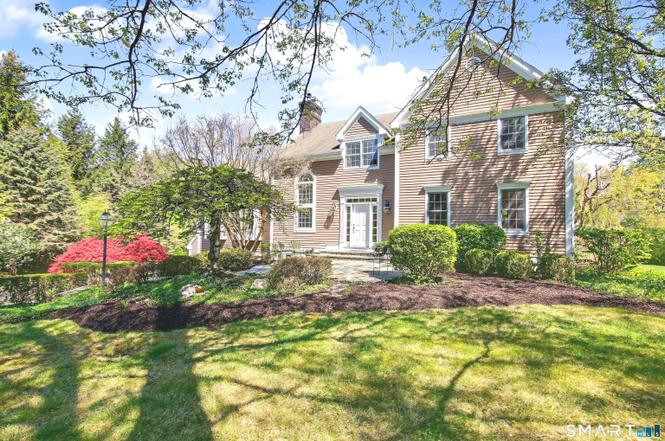
7 Jeremiah Sanford Rd · Topstone, CT
Flood risk 1/10 · Minimal
- FEMA flood zone
- X (unshaded)
- Chance of flooding over 30 yrs
- 0.0%
- Est. flood insurance / yr
- $473 – $860
Fire risk 3/10 · Minor
- Est. fire insurance / yr
- $829 – $1,539
Heat risk 4/10 · Minor
- Hot days now (above 98°F)
- 7 days/yr
- Hot days in 30 yrs
- 15 days/yr
Wind risk 5/10 · Moderate
- Chance of severe wind over 30 yrs
- 25.0%
Air-quality risk 4/10 · Minor
- Unhealthy air days now
- 3 days/yr
- Unhealthy air days in 30 yrs
- 5 days/yr
Risk factors via First Street. Map © Google.
Why this score? — see what drove the B- grade
The composite is a weighted blend of 9 inputs, each scored 0–100. Each bar is that input's sub-score; the figure is the points it added to the 100-point composite (weight × sub-score).
- Cash flow +30.0/30.0
- 1% rule +10.0/10.0
- DSCR +10.0/10.0
- Schools +7.7/10.0
- ARV discount +4.0/15.0
- Rent growth +2.5/5.0
- Livability +2.5/5.0
- Condition / age +2.5/5.0
- Appreciation +0.0/10.0
$1,200,000
🖨 Deal sheet (PDF) 📄 Offer letter ✓ Due diligence
Listing remarks
Exceptional custom designed and built 4 bedroom Colonial, bathed in natural sunlight, is nestled perfectly on 2 lush level manicured acres at the end of a small quiet cul-de-sac in a coveted area of town, a perfect tranquil oasis. The open floor plan provides timeless functionality and effortless living with dramatic high ceilings and extensive walls of glass. The special landscaped entrance porch opens into the welcoming 2-story foyer which leads into the gracious living room flowing into the banquet sized dining room. The spacious chef's kitchen with center island enjoys new stainless-steel appliances, granite counters, and an adjacent dining area which steps out onto a large deck, patio
Key facts
- Large deck
- 2 story foyer
- Primary suite
Tags
Property features AI
Exterior
- Parking: Attached garage under the house; 2-car garage
- Security: Security system
- Utilities: Private well; Septic system; Fuel tank in basement; Passive solar; Thermopane windows
- Home design: Single family home; Sand exterior color
- Construction: Frame construction; Concrete foundation; Asphalt shingle roof
- Exterior features: Shed; Porch; Deck; Gutters; Garden area; Outdoor lighting; Patio; Dry, level, cleared lot; Located on a cul-de-sac; Professionally landscaped, open lot
Interior
- Kitchen: Electric cooktop; Electric range; Wall oven; Refrigerator; Dishwasher
- Bedrooms: 4 bedrooms
- Bathrooms: 2 full bathrooms; 1 half bathroom
- Heating & cooling: Hot water heat (oil-fired); Central air conditioning; Oil hot water and domestic hot water
- Interior features: Auto garage door opener; Cable available; Open floor plan; Security system; One fireplace; Has attic with floored storage and pull-down stairs; Basement is full and partially finished
- Laundry & utility: Laundry on main level; Laundry in walk-in pantry/closet off kitchen
Neighborhood map
What this means for you Summary
Snapshot
- This is a 4-bed/2.5-bath single-family listed at $1.20M.
Deal economics
- At list price, monthly cash flow is $8k ($94k/yr) — positive.
- The deal already cash-flows at list — no discount required.
- Meets the 1% rule at list price ($20k rent vs $1.20M).
- Recommended offer: $1.16M (3.0% below list) — sets the bar for market timing.
Location & tenants
- Location reads: area grade B — affects rentability + tenant quality, not the cash-flow math above.
- Regional School District 09 (rural): math 75% / reading 90% proficiency, ranked #7 of 192 in CT (top 4%) — strong family-tenant draw, lease renewals of 3-5y typical.
- Zoned schools: Redding Elementary School (math 67% / reading 72%, grade A-, #78 of 553 statewide, top 17%, 479 students, 9% FRL); John Read Middle School (math 69% / reading 76%, grade A, #6 of 175 statewide, top 3%, 350 students, 9% FRL); Joel Barlow High School (math 57% / reading 82%, grade B, #18 of 194 statewide, top 10%, 768 students, 12% FRL).
- Zoned-school proficiency averages 70% at this address vs 82% district-wide (-12 pts) — the specific schools serving this property underperform the Regional School District 09 average; the district grade overstates school quality for this exact location.
- Market conditions: 62 active listings in the ZIP; 1 comparable units currently listed for rent nearby; 1,151 units permitted in Western Connecticut Planning Region in 2024 (714 in 5+ unit buildings).
Forward outlook
- Local home prices are declining (-3.0%/yr); year-one equity from $8k of loan paydown is wiped out by about $36k of value loss. Plan a longer hold.
- At projected returns (-3.0% appreciation + 3.0% rent growth), your $336k cash investment doubles in ~5 years — after that, you're playing with house money.
Negotiation context
- It's been on market 32 days — a 3% lower offer ($1.16M) is reasonable based on typical stale-listing flexibility.
- 2 sale attempts since 23y ago with the ask held roughly flat each time — persistent listings suggest the price (not the market) is what's stuck; bring a comps-based counter.
- Current owner paid $850k; 41% above their basis — modest negotiation headroom, anchor on the comps not their cost.
Risks & watch-outs
- Climate carrying-cost: moderate wind risk, 25% chance of damaging wind over 30y — expect insurance premiums to compound above CPI over the hold.
Questions for the listing agent
- It's been on market 32 days. Have you received any prior offers? Is the seller open to a 3% concession, seller financing, or rate buy-down credit?
- Is there a deadline driving the sale (1031 exchange, divorce, estate, relocation)? That informs how much negotiation room exists.
- What's the average days-on-market for RENTAL listings here right now (not sales)? A rising rental-DOM trend means longer vacancies and softer asking-rent achievability than the comps imply.
- What's the recent tenant-quality profile in this submarket — average credit score on applications, eviction rate, late-payment / NSF rate, and stable-employment percentage? A property-management company in the area should have these aggregated.
- How much new for-sale + rental construction is in the pipeline within 1–3 miles? Heavy new supply typically softens prices + rents 12–24 months out; constrained supply supports both.
Investment metrics
- 1% rule
- 1.67% ✓
- Cap rate
- 14.14%
- Cash-on-cash
- 28.02%
- DSCR
- 2.25
- GRM
- 5.0
CMA / ARV
- ARV (median comp)
- $1,112,915
- List price
- $1,200,000
- Delta
- 7.82%
- Verdict
- FAIR
- Comps
- 20 within 1.0 mi
Show comp detail 2 sales within ~0.75 mi
| Address | Dist | Beds/Ba | Sqft | Sold | Price | $/sf | Match |
|---|---|---|---|---|---|---|---|
| 9 Brick School Dr | 0.42mi | 4/3.0 | 3,284 (+8%) | 10mo | $865,000 | $263 | 57 |
| 201 Umpawaug Rd | 0.47mi | 4/3.5 | 2,942 (-3%) | 19mo | $1,117,000 | $380 | 52 |
Match score weights: distance 35% · size 25% · config 20% · recency 20%. Top-matched comps best support the ARV.
Projected returns pro-forma
-3.0% appreciation · 3.0% rent growth · sell at horizon
- IRR
- 22.2%
- Equity multiple
- 1.91×
- Total profit
- $305,294
- Equity at exit
- $178,924
- IRR
- 30.2%
- Equity multiple
- 3.71×
- Total profit
- $909,608
- Equity at exit
- $103,754
Cash invested: $336,000 (down + closing). Projections, not guarantees.
Landlord ↔ Tenant lean methodology
- Overall (STATE)
- 27 Tenant-Leaning
- State Connecticut
- 27 Tenant-Leaning · D+7
- County
- — inherits STATE
- City
- — inherits STATE
ZIP-level market 06896
- Active inventory
- 62
- Price-to-rent
- 5.0×
Monthly cashflow live
- Estimated rent
- $20,000 medium interval (Pro) →
- Mortgage (P&I)
- −$6,293
- Tax from tax record
- −$1,162 /mo · $13,945/yr
- Insurance
- −$500
- HOA
- −$0
- Vacancy / Maint / Mgmt
- −$4,200
- Net cashflow
- $7,845
Break-even live
Sensitivity live
| Price | -10% $8,524 | -5% $8,185 | +0% $7,845 | +5% $7,505 | +10% $7,166 |
|---|---|---|---|---|---|
| Rent | -10% $6,265 | -5% $7,055 | +0% $7,845 | +5% $8,635 | +10% $9,425 |
| Rate | -1.0pp $8,449 | -0.5pp $8,150 | base $7,845 | +0.5pp $7,534 | +1.0pp $7,218 |
UW: 25.0% down · 7.5% · 30yr · 1.5% tax · 5.0% vac · 8.0% maint · 8.0% mgmt
Financing live
Cash to close
- Down payment
- $300,000
- Closing costs
- $36,000
- Reserves months
- —
- Total cash needed
- —
Loan-product check · same deal, 3 products live
Conventional
25% down · 7.5% · 30yr
- Down + closing
- —
- Monthly P&I
- —
- Monthly cashflow
- —
- DSCR
- —
- Eligible?
- —
Personal DTI + credit; lowest rate.
DSCR
20% down · 8.5% · 30yr
- Down + closing
- —
- Monthly P&I
- —
- Monthly cashflow
- —
- DSCR
- —
- Eligible?
- —
No personal income docs; deal must DSCR.
Hard money
10% down · 12.0% · 12mo
- Down + closing
- —
- Monthly P&I
- —
- Monthly cashflow
- —
- DSCR
- —
- Eligible?
- —
Short-term bridge; refi at stabilization.
Rent comps 1 comps
| Address | Beds | Baths | Sqft | Rent | $/sqft | DOM | Units | Dist |
|---|---|---|---|---|---|---|---|---|
| 142 Seventy Acre Rd Redding, CT | 4.0 | 4.5 | 3350 | $20,000 | $5.97 | 4d | 1 | 1.46mi |
Listing history 17 events
-
2026-06-16statusdays on market $1,200,000 Under Contract 32 DOM
-
2026-06-15days on market $1,200,000 Under Contract - Continue to Show 31 DOM
-
2026-06-13days on market $1,200,000 Under Contract - Continue to Show 29 DOM
-
2026-06-10days on market $1,200,000 Under Contract - Continue to Show 26 DOM
-
2026-06-09days on market $1,200,000 Under Contract - Continue to Show 25 DOM
-
2026-06-08days on market $1,200,000 Under Contract - Continue to Show 24 DOM
-
2026-06-07days on market $1,200,000 Under Contract - Continue to Show 23 DOM
-
2026-06-05days on market $1,200,000 Under Contract - Continue to Show 20 DOM
-
2026-06-03days on market $1,200,000 Under Contract - Continue to Show 19 DOM
-
2026-06-03days on market $1,200,000 Under Contract - Continue to Show 18 DOM
-
2026-06-01days on market $1,200,000 Under Contract - Continue to Show 17 DOM
-
2026-05-31days on market $1,200,000 Under Contract - Continue to Show 16 DOM
-
2026-05-15$1,200,000 Active 1352-char remark
-
2003-09-30soldstatus $850,000
-
2003-09-29soldstatus $850,000
-
2003-04-24$875,000
-
1991-05-15soldstatus $160,000
ⓘ Source: listings_history table (triggers on properties + properties_extension) + one-shot
backfill from property_details.listing_events for pre-trigger history.
Tax reassessment forecast CT · Partial reset (capped growth)
- Current annual tax
- $13,945 · $1,162/mo
- Projected year-2 tax
- $19,812 · $1,651/mo
- Expected delta
- +$5,868/yr (+$489/mo · 42.1%)
ⓘ Screening estimate from a state-policy table — verify with the county assessor before closing.
Climate risk First Street
- Flood 1/10 Low FEMA zone X (unshaded) · 0% chance over 30 yrs
- Wildfire 3/10 Moderate
- Heat 4/10 Moderate 7 d/yr ≥98°F today · 15 d/yr by 30 yrs out
- Wind 5/10 Major 25% chance of damaging wind over 30 yrs
- Air quality 4/10 Moderate 3 unhealthy d/yr today · 5 by 30 yrs out
Nearby sold comps map
Loading sold comps map…
Walkable amenities ~0.75 mi
Loading nearby amenities…
Taxation est. · year 1
- Rental income
- $240,000
- − Mortgage interest
- −$67,219
- − Property taxes
- −$13,945
- − Insurance
- −$6,000
- − Repairs & maintenance
- −$19,200
- − Management
- −$19,200
- − Depreciation
- −$34,909
- Taxable income
- $79,527
- Est. tax owed @ 24.0%
- −$19,087
- After-tax cash flow
- $75,053/yr
For passive investors: Depreciation is non-cash, so a rental often shows a tax loss while cash-flowing — sheltering income. Rental losses are passive: they offset passive income freely, and up to $25,000/yr can offset ordinary (W-2) income if you actively participate and your MAGI is under $100k (phasing out to $0 by $150k); unused losses carry forward. On sale, claimed depreciation is recaptured at up to 25%, and gains may owe capital-gains tax (a 1031 exchange can defer both). Figures are a year-1 estimate at your 24.0% rate — not tax advice; consult a CPA.
Schools (NCES district)
- District
- Regional School District 09
- NCES district ID
- 0903780
- Math proficiency
- 75% ▲ 3.00%
- Reading proficiency
- 90% ▲ 5.00%
- Median HH income
- $120,713
- Composite
- 77.14/100
- National rank
- #169
- State rank
- #7 of 192 in CT
Livability — Topstone
No livability data for this city. (Only ~50 U.S. cities are tracked.)
Census & demographics
- Population (ZIP)
- 8,719
Population outlook (Western Connecticut County) Hauer SSP2
- By 2040
- 685,031
Race, ethnicity, and origin ACS 2023
- Neighborhood character
- Predominantly White (81%)
- Race & ethnicity
- White 81% Hispanic / Latino 9% Two or more races 9% Asian 4%
- Hispanic origin (detail)
- Mexican 1% Puerto Rican 1% Dominican 1%
- Common ancestry
- Slovak 5% Scotch-Irish 5% Romanian 3%
- Foreign-born
- 9% · Canada, China
- Languages at home
- 86% English-only · Spanish 6% Other Indo-European 3% Chinese 1%
Political lean MEDSL · Western Connecticut
- 2024 margin
- D (+19.1) · D 58.8% · R 39.7% · Other 1.6%
- All cycles
- 2024: D+19.1
Not yet ingested
- Civics
- —
Market trends
- HPI YoY
- ▼ -236.94%
- Current HPI
- 163.4307
- Rent YoY
- —
- Metro
- —
- State GDP YoY
- ▲ 1.06%
- F500 in state
- 38
Industry mix (Fortune 500 HQ in CT)
| Industry | F500 HQs | Revenue |
|---|---|---|
| Industrial Machinery | 4 | $38B |
|
||
| Insurance | 3 | $71B |
|
||
| Financial Services | 2 | $25B |
|
||
| Transportation / Logistics | 2 | $18B |
|
||
| Healthcare | 1 | $247B |
|
||
| Telecommunications | 1 | $55B |
|
||
Price history
+650.0% since first listed7 events — show timeline
- 2026-06-16 Pending — Smart MLS
- 2026-05-22 Contingent — Smart MLS
- 2026-05-15 Listed $1,200,000 Smart MLS
- 2003-09-30 Sold (Public Records) $850,000 Public Records
- 2003-09-29 Sold (MLS) $850,000 Smart MLS
- 2003-04-24 Listed $875,000 Smart MLS
- 1991-05-15 Sold (Public Records) $160,000 Public Records
Property tax history
+0.3%/yrLatest (2023): $13,945 · -2.3% YoY. Source: county tax records.
Cash-flow waterfall
monthlySold comps — $/sqft
last 12 mo · ≤1 miLoading sold comps…