 🏗️ New Construction
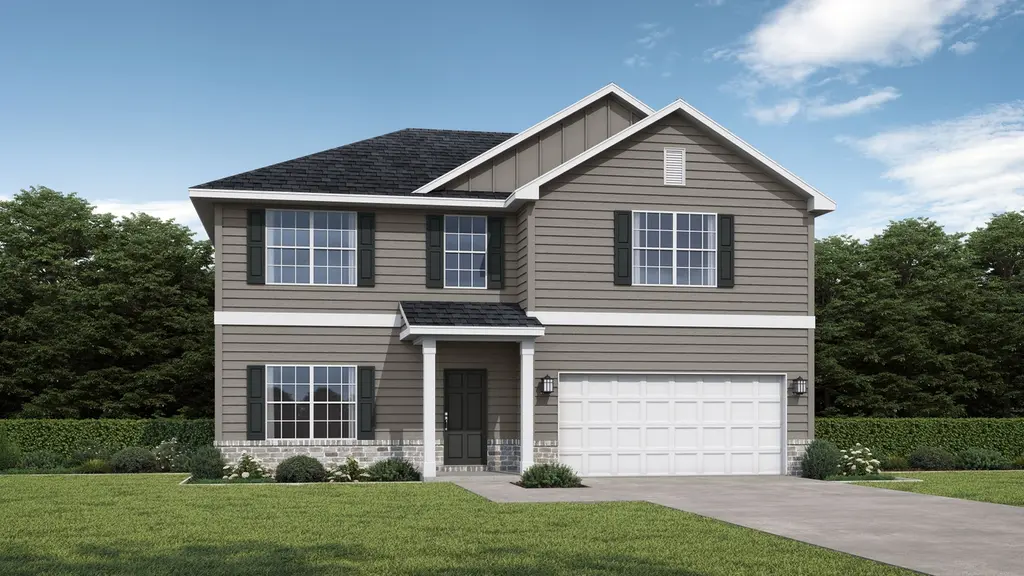
Catherine Plan · Walthourville, GA
Flood risk No data
- FEMA flood zone
- —
- Chance of flooding over 30 yrs
- —
- Est. flood insurance / yr
- —
Fire risk No data
- Est. fire insurance / yr
- —
Heat risk No data
- Hot days now (above threshold)
- —
- Hot days in 30 yrs
- —
Wind risk No data
- Chance of severe wind over 30 yrs
- —
Air-quality risk No data
- Unhealthy air days now
- —
- Unhealthy air days in 30 yrs
- —
Risk factors via First Street. Map © Google.
Why this score? — see what drove the D+ grade
The composite is a weighted blend of 9 inputs, each scored 0–100. Each bar is that input's sub-score; the figure is the points it added to the 100-point composite (weight × sub-score).
- Cash flow +14.5/30.0
- ARV discount +7.5/15.0
- Appreciation +5.1/10.0
- Condition / age +5.0/5.0
- DSCR +4.4/10.0
- 1% rule +4.2/10.0
- Livability +3.2/5.0
- Rent growth +2.5/5.0
- Schools +2.3/10.0
$289,900
🖨 Deal sheet (PDF) 📄 Offer letter ✓ Due diligence
Listing remarks MLS
This Home Is Part Of Our Covenant Series! Comfort and utilities are the priorities in this relaxed floor plan. Entering in from the garage after a long day, you'll be greeted by the warmth of the large family room that will instantly make you feel relaxed. You can also get a snack being that the kitchen is conveniently right across along with the dining room. Upstairs, the master suite beckons you to relax in the large shower, the oversize tub, and the spacious bedroom. 3 more bedrooms sit at the top of the house, plus another downstairs that can conveniently be used as an office space. Artistic renderings are for informational purposes only. Actual floor plans, features and inclusions may vary.
Key facts
- 2 garage spots
- Listed 300 days
Neighborhood map
What this means for you Summary
Snapshot
- This is a 5-bed/3.0-bath single-family listed at $290k. Condition is rated excellent.
Deal economics
- At list price, monthly cash flow is $69 ($828/yr) — positive.
- The deal already cash-flows at list — no discount required.
- To meet the 1% rule (rent ≥ 1% of price), the offer needs to be $280k (3.4% below list).
- Recommended offer: $255k (12.0% below list) — sets the bar for market timing.
- Cap rate 6.6% vs local median 5.4% in Walthourville — meaningfully above typical; check what's discounted (condition, days-on-market, listing class) to confirm the premium yield is real.
Location & tenants
- Location reads 64/100 on livability (#255 in GA) — a middle-class / working-renter tenant base. Strengths: cost of living A+, housing A+, crime B; Watch: employment D, amenities F, commute F.
- Long County (rural): math 26% / reading 26% proficiency, ranked #115 of 174 in GA (top 66%) — low school quality limits family demand, transient renter base, plan for 1-2y turnover; 61% free/reduced lunch — lower-income household profile, screen leases tightly.
- Zoned schools: Smiley Elementary School (1,258 students, 67% FRL); Long County Middle School (math 21% / reading 27%, grade F, #311 of 470 statewide, top 68%, 945 students, 69% FRL); Long County High School (math 37% / reading 22%, grade F, #140 of 424 statewide, top 35%, 1,209 students, 70% FRL).
- Market conditions: 141 active listings in the ZIP; 2 comparable units currently listed for rent nearby; 298 units permitted in Long County in 2024 (0 in 5+ unit buildings).
- At $2,802/mo this rent would consume 51% of the median local household income ($65k/yr) (locally 121% of renters already pay >50% of income on rent) — very limited rent-growth headroom before tenants either downsize or default.
Forward outlook
- In year one you build about $3k of equity ($2k loan paydown + $474 appreciation (0.2% local appreciation)).
- Long County population projected at +72% by 2050 — long-run rental-demand tailwind backs the buy-and-hold thesis.
- By year 10, paydown + projected appreciation supports a ~$34k cash-out refi (75% LTV) — recoverable capital for the next deal without selling this one.
Negotiation context
- It's been on market 300 days — a 12% lower offer ($255k) is reasonable based on typical stale-listing flexibility.
Questions for the listing agent
- It's been on market 300 days. Have you received any prior offers? Is the seller open to a 12% concession, seller financing, or rate buy-down credit?
- What does the HOA fee cover, when was the last increase, and are there any pending special assessments or reserve-fund shortfalls?
- Why hasn't it sold? Are there any deal-killer items the seller is aware of (foundation, flood, title, zoning, code violations)?
- Is there a deadline driving the sale (1031 exchange, divorce, estate, relocation)? That informs how much negotiation room exists.
- Schools are F-rated, which usually means shorter tenancies and higher turnover. Who's the typical renter profile here, and what's been the actual vacancy rate?
- The area grade is low — what's the realistic commute time and amenity access for the typical tenant pool here? Any planned neighborhood developments (good or bad) we should know about?
- What's the average days-on-market for RENTAL listings here right now (not sales)? A rising rental-DOM trend means longer vacancies and softer asking-rent achievability than the comps imply.
- What's the recent tenant-quality profile in this submarket — average credit score on applications, eviction rate, late-payment / NSF rate, and stable-employment percentage? A property-management company in the area should have these aggregated.
- How much new for-sale + rental construction is in the pipeline within 1–3 miles? Heavy new supply typically softens prices + rents 12–24 months out; constrained supply supports both.
Investment metrics
- 1% rule
- 0.92% ✗
- Cap rate
- 6.56%
- Cash-on-cash
- 0.97%
- DSCR
- 1.04
- GRM
- 9.1
CMA / ARV
- ARV (median comp)
- $305,365
- List price
- $289,900
- Delta
- -5.06%
- Verdict
- FAIR
- Comps
- 20 within 1.0 mi
Show comp detail 12 sales within ~0.75 mi
| Address | Dist | Beds/Ba | Sqft | Sold | Price | $/sf | Match |
|---|---|---|---|---|---|---|---|
| 702 Buckhead Loop SE | 0.52mi | 5/3.0 | 2,415 (-4%) | 1mo | $322,425 | $134 | 68 |
| 1192 Buckhead Loop SE | 0.45mi | 5/3.0 | 2,415 (-4%) | 8mo | $325,000 | $135 | 66 |
| 236 Antler Ave | 0.66mi | 5/3.0 | 2,516 (0%) | 6mo | $317,825 | $126 | 64 |
| 836 Buckhead Loop SE | 0.52mi | 4/2.5 (-1) | 2,395 (-5%) | 0mo | $316,800 | $132 | 60 |
| 874 Buckhead Loop SE | 0.47mi | 5/3.0 | 2,256 (-10%) | 2mo | $320,675 | $142 | 59 |
| 1226 Buckhead Loop SE | 0.41mi | 5/3.0 | 2,256 (-10%) | 9mo | $307,325 | $136 | 56 |
| 1158 Buckhead Loop SE | 0.48mi | 4/2.5 (-1) | 2,395 (-5%) | 9mo | $311,575 | $130 | 55 |
| 200 Antler Ave SE | 0.63mi | 5/3.0 | 2,256 (-10%) | 4mo | $308,875 | $137 | 51 |
| 1052 Buckhead Loop SE | 0.58mi | 5/3.0 | 2,256 (-10%) | 8mo | $323,840 | $144 | 49 |
| 1034 Buckhead Loop SE | 0.60mi | 5/3.0 | 2,256 (-10%) | 8mo | $307,625 | $136 | 48 |
| 1105 Buckhead Loop SE | 0.52mi | 4/2.5 (-1) | 2,254 (-10%) | 6mo | $312,495 | $139 | 47 |
| 1151 Buckhead Loop SE | 0.48mi | 4/2.5 (-1) | 2,151 (-14%) | 9mo | $298,875 | $139 | 39 |
Match score weights: distance 35% · size 25% · config 20% · recency 20%. Top-matched comps best support the ARV.
Projected returns pro-forma
0.16% appreciation · 3.0% rent growth · sell at horizon
- IRR
- -0.5%
- Equity multiple
- 0.97×
- Total profit
- $-2,237
- Equity at exit
- $91,049
- IRR
- 4.9%
- Equity multiple
- 1.54×
- Total profit
- $46,573
- Equity at exit
- $111,363
Cash invested: $85,502 (down + closing). Projections, not guarantees.
Landlord ↔ Tenant lean methodology
- Overall (STATE)
- 90 Strongly Landlord-Friendly
- State Georgia
- 90 Strongly Landlord-Friendly · R+3
- County
- — inherits STATE
- City
- — inherits STATE
ZIP-level market 31301
- Home prices YoY
- 0.1%
- Active inventory
- 141
- Price-to-rent
- 8.6×
Monthly cashflow live
- Estimated rent
- $2,802 medium interval (Pro) →
- Mortgage (P&I)
- −$1,601
- Tax est. 1.5%
- −$382 /mo · $4,580/yr
- Insurance
- −$127
- HOA
- −$34
- Vacancy / Maint / Mgmt
- −$588
- Net cashflow
- $69
Break-even live
Sensitivity live
| Price | -10% $280 | -5% $175 | +0% $69 | +5% $-37 | +10% $-142 |
|---|---|---|---|---|---|
| Rent | -10% $-152 | -5% $-42 | +0% $69 | +5% $180 | +10% $290 |
| Rate | -1.0pp $223 | -0.5pp $147 | base $69 | +0.5pp $-10 | +1.0pp $-91 |
UW: 25.0% down · 7.5% · 30yr · 1.5% tax · 5.0% vac · 8.0% maint · 8.0% mgmt
Financing live
Cash to close
- Down payment
- $76,341
- Closing costs
- $9,161
- Reserves months
- —
- Total cash needed
- —
Loan-product check · same deal, 3 products live
Conventional
25% down · 7.5% · 30yr
- Down + closing
- —
- Monthly P&I
- —
- Monthly cashflow
- —
- DSCR
- —
- Eligible?
- —
Personal DTI + credit; lowest rate.
DSCR
20% down · 8.5% · 30yr
- Down + closing
- —
- Monthly P&I
- —
- Monthly cashflow
- —
- DSCR
- —
- Eligible?
- —
No personal income docs; deal must DSCR.
Hard money
10% down · 12.0% · 12mo
- Down + closing
- —
- Monthly P&I
- —
- Monthly cashflow
- —
- DSCR
- —
- Eligible?
- —
Short-term bridge; refi at stabilization.
Rent comps 2 comps
| Address | Beds | Baths | Sqft | Rent | $/sqft | DOM | Units | Dist |
|---|---|---|---|---|---|---|---|---|
| 2722 Arnall Dr Allenhurst, GA | 5.0 | 3.0 | 2256 | $2,600 | $1.15 | 45d | 1 | 0.34mi |
| 9635 Tibet Hwy SE Allenhurst, GA | 5.0 | 3.5 | 2400 | $2,600 | $1.08 | 45d | 1 | 1.26mi |
HOA detail
- Monthly dues
- $34 · $408/yr
Listing history 19 events
-
2026-06-21days on market $289,900 Active 300 DOM
-
2026-06-19days on market $289,900 Active 298 DOM
-
2026-06-18days on market $289,900 Active 297 DOM
-
2026-06-17days on market $289,900 Active 296 DOM
-
2026-06-16days on market $289,900 Active 295 DOM
-
2026-06-15days on market $289,900 Active 294 DOM
-
2026-06-14days on market $289,900 Active 292 DOM
-
2026-06-13days on market $289,900 Active 291 DOM
-
2026-06-10days on market $289,900 Active 289 DOM
-
2026-06-09days on market $289,900 Active 288 DOM
-
2026-06-08days on market $289,900 Active 287 DOM
-
2026-06-07days on market $289,900 Active 286 DOM
-
2026-06-05days on market $289,900 Active 283 DOM
-
2026-06-03days on market $289,900 Active 282 DOM
-
2026-06-02days on market $289,900 Active 281 DOM
-
2026-06-01days on market $289,900 Active 280 DOM
-
2026-05-31days on market $289,900 Active 279 DOM
-
2026-05-30days on market $289,900 Active 278 DOM
-
2025-08-25$289,900 Active 704-char remark
Show marketing remark (704 chars)
This Home Is Part Of Our Covenant Series! Comfort and utilities are the priorities in this relaxed floor plan. Entering in from the garage after a long day, you'll be greeted by the warmth of the large family room that will instantly make you feel relaxed. You can also get a snack being that the kitchen is conveniently right across along with the dining room. Upstairs, the master suite beckons you to relax in the large shower, the oversize tub, and the spacious bedroom. 3 more bedrooms sit at the top of the house, plus another downstairs that can conveniently be used as an office space. Artistic renderings are for informational purposes only. Actual floor plans, features and inclusions may vary.
ⓘ Source: listings_history table (triggers on properties + properties_extension) + one-shot
backfill from property_details.listing_events for pre-trigger history.
Nearby sold comps map
Loading sold comps map…
Walkable amenities ~0.75 mi
Loading nearby amenities…
Taxation est. · year 1
- Rental income
- $33,620
- − Mortgage interest
- −$17,105
- − Property taxes
- −$4,580
- − Insurance
- −$1,527
- − Repairs & maintenance
- −$2,690
- − Management
- −$2,690
- − HOA
- −$408
- − Depreciation
- −$8,883
- Taxable loss
- −$4,263
- Est. tax savings @ 24.0%
- +$1,023
- After-tax cash flow
- $1,851/yr
For passive investors: Depreciation is non-cash, so a rental often shows a tax loss while cash-flowing — sheltering income. Rental losses are passive: they offset passive income freely, and up to $25,000/yr can offset ordinary (W-2) income if you actively participate and your MAGI is under $100k (phasing out to $0 by $150k); unused losses carry forward. On sale, claimed depreciation is recaptured at up to 25%, and gains may owe capital-gains tax (a 1031 exchange can defer both). Figures are a year-1 estimate at your 24.0% rate — not tax advice; consult a CPA.
Condition & rehab AI · 13 photos
This home is in excellent condition with no visible repairs or maintenance needed. It is move-in ready and has the potential for further value increases through painting and landscaping.
Value-add opportunities
- Both Painting the exterior siding and trim — Painting the exterior can enhance the curb appeal and increase the home's value.
- Both Landscaping improvements — Landscaping can improve the curb appeal and increase the home's value.
Renovation cost estimate screening
Value-add ROI direction
- Both Painting the exterior siding and trim — Painting the exterior can enhance the curb appeal and increase the home's value. ↑
- Both Landscaping improvements — Landscaping can improve the curb appeal and increase the home's value. ↑
ⓘ Cost ranges are severity-bucket heuristics (US national rule-of-thumb). Get contractor quotes + a written scope before underwriting a rehab budget.
Schools (NCES district)
- District
- Long County
- NCES district ID
- 1303360
- Math proficiency
- 26% ▼ -14.00%
- Reading proficiency
- 26% ▼ -13.00%
- Median HH income
- $45,958
- Composite
- 22.51/100
- National rank
- #8090
- State rank
- #115 of 174 in GA
Livability — Walthourville
- Score
- 64/100
- State rank
- #255
- US rank
- #14108
Category grades
Schools grade is shown separately in the Schools card above.
Census & demographics
- County
- Liberty County · 58,565 people
- City population
- 4,933
- Metro
- Hinesville, GA
- Population (ZIP)
- 4,933
- Household income
- $65,417
- Rent vs Own
- Severe rent burden
- 121.0
Population outlook (Long County) Hauer SSP2
- Today (2025)
- 24,669 people
- By 2030
- 28,223 · +14.4%
- By 2040
- 35,430 · +43.6%
- By 2050
- 42,403 · +71.9%
- By 2075
- 56,996 · +131.0%
- By 2100
- 64,185 · +160.2%
Race, ethnicity, and origin ACS 2023
- Neighborhood character
- Diverse neighborhood (Simpson 0.64)
- Race & ethnicity
- Black 51% White 31% Two or more races 15% Hispanic / Latino 9%
- Hispanic origin (detail)
- Mexican 2% Puerto Rican 7%
- Common ancestry
- Slovak 1% Lithuanian 1%
- Foreign-born
- 3% · Canada
- Languages at home
- 96% English-only · Spanish 2%
Political lean MEDSL · Long
- 2024 margin
- Strong R (+29.5) · D 35.1% · R 64.6%
- 2008→2024 swing
- -5.4pp toward R · 2008: -24.1pp · 2024: -29.5pp
- All cycles
- 2024: R+29.5 2020: R+26.4 2016: R+30.8 2012: R+22.9 2008: R+24.1
Not yet ingested
- Civics
- —
Market trends
- HPI YoY
- ▲ 0.16%
- Current HPI
- 187.7716
- Rent YoY
- —
- Metro
- Hinesville, GA
- State GDP YoY
- ▲ 2.66%
- F500 in state
- 28
Industry mix (Fortune 500 HQ in GA)
| Industry | F500 HQs | Revenue |
|---|---|---|
| Paper / Packaging | 2 | $29B |
|
||
| Retail | 1 | $160B |
|
||
| Transportation / Logistics | 1 | $91B |
|
||
| Airlines | 1 | $62B |
|
||
| Consumer Goods | 1 | $47B |
|
||
| Utilities | 1 | $25B |
|
||
Price history
1 event — show timeline
- 2025-08-25 Listed $289,900 Zillow
Cash-flow waterfall
monthlySold comps — $/sqft
last 12 mo · ≤1 miLoading sold comps…