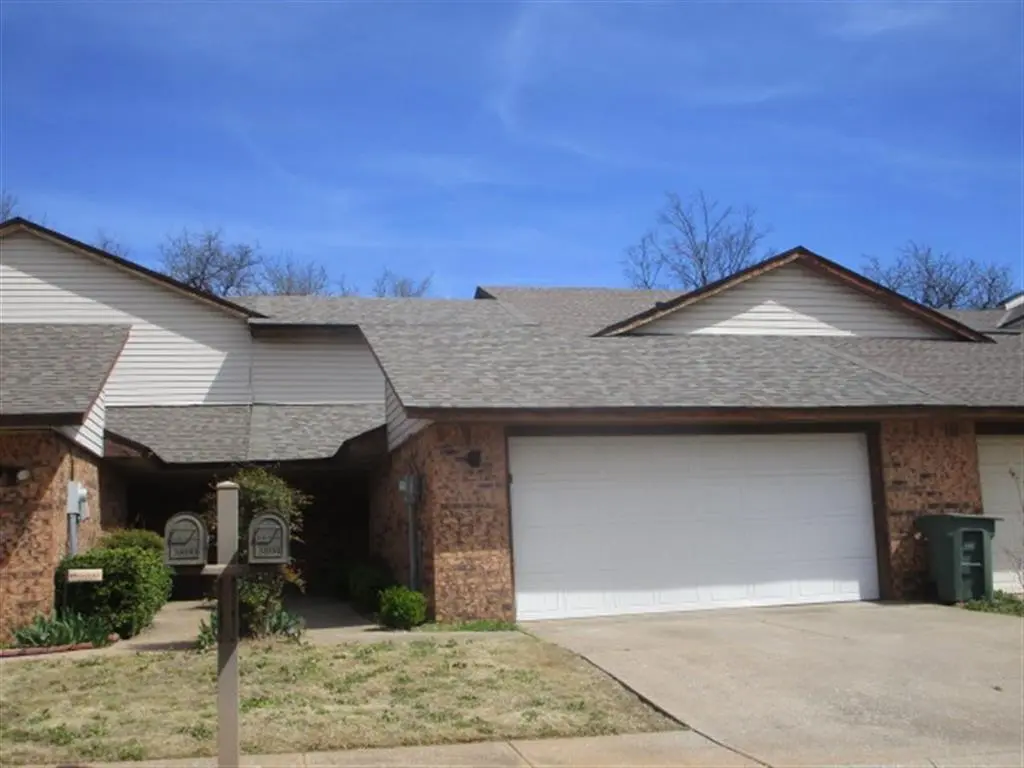
3804 Summer Cloud Dr · Edmond, OK
Flood risk 1/10 · Minimal
- FEMA flood zone
- X (unshaded)
- Chance of flooding over 30 yrs
- 0.0%
- Est. flood insurance / yr
- $507 – $1,088
Fire risk 4/10 · Minor
- Est. fire insurance / yr
- $2,463 – $4,575
Heat risk 6/10 · Moderate
- Hot days now (above 108°F)
- 7 days/yr
- Hot days in 30 yrs
- 19 days/yr
Wind risk 2/10 · Minimal
- Chance of severe wind over 30 yrs
- 4.0%
Air-quality risk 2/10 · Minimal
- Unhealthy air days now
- 2 days/yr
- Unhealthy air days in 30 yrs
- 2 days/yr
Risk factors via First Street. Map © Google.
Why this score? — see what drove the D+ grade
The composite is a weighted blend of 9 inputs, each scored 0–100. Each bar is that input's sub-score; the figure is the points it added to the 100-point composite (weight × sub-score).
- Cash flow +14.2/30.0
- ARV discount +11.5/15.0
- DSCR +4.3/10.0
- Livability +3.9/5.0
- Schools +3.6/10.0
- Rent growth +3.3/5.0
- 1% rule +3.2/10.0
- Condition / age +2.5/5.0
- Appreciation +0.0/10.0
$190,000
🖨 Deal sheet (PDF) 📄 Offer letter ✓ Due diligence
Listing remarks MLS
Under $100K in Edmond? Better Hurry. Townhouse backs to greenbelt, has new tile, paint, fixtures, stove, carpet upstairs, and exterior doors. HOA dues take care of yardwork.
Key facts
- Completely remodeled
- Large backyard
- Refreshed exterior
Tags
Property features AI
Finance
- Other: Lot features listed as Other; Lot size approximately 0.0758 acres; Directions: From Covell & Douglas, go east on Covell, then south on Sooner. Turn east on Summer Cloud Dr and follow to home.; Active open houses scheduled (public upcoming: Sat May 23, 2:00PM-4:00PM)
- Financial info: Loan qualification allowed; Not assumable
- HOA & community: Mandatory association dues; Association fee $600; Association fee includes greenbelt, grounds maintenance, common area maintenance, and exterior maintenance
Exterior
- Parking: 2-car garage
- Utilities: Homestead not claimed
- Home design: Townhouse; Residential property; Two-level property
- Construction: Brick and frame construction; Composition roof; Built (existing)
- Exterior features: Covered deck; Covered patio; Covered porch; Open deck; Open patio; Porch; Rain gutters
Interior
- Bedrooms: 2 bedrooms
- Bathrooms: 2 full bathrooms
- Interior features: Gas log fireplace; Living area noted as 1,279 (assessor); Slab foundation
Neighborhood map
What this means for you Summary
Snapshot
- This is a 2-bed/2.0-bath townhouse listed at $190k.
Deal economics
- At list price, monthly cash flow is $31 ($377/yr) — positive.
- The deal already cash-flows at list — no discount required.
- To meet the 1% rule (rent ≥ 1% of price), the offer needs to be $155k (18.3% below list).
- Recommended offer: $155k (18.3% below list) — sets the bar for 1% rule.
- Cap rate 6.5% vs local median 3.4% in Edmond — top-decile yield for the area; either an underpriced asset or a hidden risk that comps aren't pricing in. Stress-test before assuming the spread holds.
Location & tenants
- Location reads 78/100 on livability (#6 in OK, #2,383 nationally) — a middle-class / working-renter tenant base. Strengths: employment A+, housing A+, crime A-; Watch: health & safety C-, commute F.
- Edmond (suburban): math 38% / reading 40% proficiency, ranked #11 of 270 in OK (top 4%) — families likely to look elsewhere, expect single-tenant / working-renter base with shorter leases.
- Zoned schools: Chisholm Es (math 61% / reading 56%, grade B-, #16 of 845 statewide, top 2%, 864 students, 0% FRL); Cimarron Ms (math 24% / reading 26%, grade F, #90 of 345 statewide, top 27%, 866 students, 0% FRL); Memorial Hs (math 44% / reading 56%, grade D+, #4 of 447 statewide, top 1%, 2,605 students, 0% FRL) — zoned schools average 0% FRL vs 22% district-wide (22 pts lower); this property's tenant base skews higher-income than the district average.
- Market conditions: Rents rising (+3.1%/yr); 662 active listings in the ZIP; 12 comparable units currently listed for rent nearby; rentals leasing fast (median 14d on market — plan ~1-2 weeks tenant-placement turnaround); high-income renter base; 5,365 units permitted in Oklahoma County in 2024 (569 in 5+ unit buildings).
- This rent is only 16% of the median local income ($114k/yr) — well below the 30% rent-burden line; pricing power to push rent on renewal without tenant pushback.
Forward outlook
- Local home prices are declining (-3.0%/yr); year-one equity from $1k of loan paydown is wiped out by about $6k of value loss. Plan a longer hold.
- Oklahoma County population projected at +41% by 2050 — long-run rental-demand tailwind backs the buy-and-hold thesis.
Negotiation context
- Only 7 days on market — expect competitive offers; lowballing is unlikely to land.
- 6 sale attempts since 21y ago; this cycle's ask is 12567% above the opening price — seller raised mid-cycle; expect resistance to lowballs.
- Current owner paid $96k; list at $190k implies a 98% gain — meaningful room to come down on a strong offer.
Risks & watch-outs
- Climate carrying-cost: extreme-heat days projected 7→19/yr by 2055 (HVAC capex compounding) — expect insurance premiums to compound above CPI over the hold.
Questions for the listing agent
- Is there a deadline driving the sale (1031 exchange, divorce, estate, relocation)? That informs how much negotiation room exists.
- Schools are A-rated — typically a magnet for longer-tenancy family renters. What's the average tenant stay here, and is there a school-zone premium baked into asking?
- The area grade is low — what's the realistic commute time and amenity access for the typical tenant pool here? Any planned neighborhood developments (good or bad) we should know about?
- What's the average days-on-market for RENTAL listings here right now (not sales)? A rising rental-DOM trend means longer vacancies and softer asking-rent achievability than the comps imply.
- What's the recent tenant-quality profile in this submarket — average credit score on applications, eviction rate, late-payment / NSF rate, and stable-employment percentage? A property-management company in the area should have these aggregated.
- How much new for-sale + rental construction is in the pipeline within 1–3 miles? Heavy new supply typically softens prices + rents 12–24 months out; constrained supply supports both.
Investment metrics
- 1% rule
- 0.82% ✗
- Cap rate
- 6.49%
- Cash-on-cash
- 0.71%
- DSCR
- 1.03
- GRM
- 10.2
CMA / ARV
- ARV (on-the-fly)
- $208,477
- Comps found
- 7
Show comp detail 7 sales within ~0.75 mi
| Address | Dist | Beds/Ba | Sqft | Sold | Price | $/sf | Match |
|---|---|---|---|---|---|---|---|
| 1530 Fall Creek Dr | 0.04mi | 2/2.0 | 1,187 (-7%) | 4mo | $155,000 | $131 | 82 |
| 13816 Oxford Dr | 0.63mi | 3/2.0 (+1) | 1,288 (+1%) | 4mo | $200,000 | $155 | 61 |
| 13823 Oxford Dr | 0.62mi | 3/2.0 (+1) | 1,234 (-4%) | 1mo | $205,000 | $166 | 60 |
| 13818 Oxford Dr | 0.63mi | 3/2.0 (+1) | 1,227 (-4%) | 4mo | $200,000 | $163 | 55 |
| 2920 Colonial Ln | 0.52mi | 2/1.5 | 1,161 (-9%) | 11mo | $175,000 | $151 | 49 |
| 13706 Oxford Dr | 0.72mi | 3/2.0 (+1) | 1,138 (-11%) | 5mo | $195,000 | $171 | 39 |
| 13812 Oxford Dr | 0.65mi | 3/2.0 (+1) | 1,132 (-12%) | 15mo | $198,000 | $175 | 33 |
Match score weights: distance 35% · size 25% · config 20% · recency 20%. Top-matched comps best support the ARV.
Projected returns pro-forma
-3.0% appreciation · 3.14% rent growth · sell at horizon
- IRR
- -15.1%
- Equity multiple
- 0.46×
- Total profit
- $-28,618
- Equity at exit
- $28,330
- IRR
- -6.3%
- Equity multiple
- 0.59×
- Total profit
- $-21,643
- Equity at exit
- $16,428
Cash invested: $53,200 (down + closing). Projections, not guarantees.
Landlord ↔ Tenant lean methodology
- Overall (STATE)
- 83 Strongly Landlord-Friendly
- State Oklahoma
- 83 Strongly Landlord-Friendly · R+20
- County
- — inherits STATE
- City
- — inherits STATE
ZIP-level market 73013
- Rents YoY
- 3.1%
- Active inventory
- 662
- Price-to-rent
- 10.2×
Monthly cashflow live
- Estimated rent
- $1,552 high interval (Pro) →
- Mortgage (P&I)
- −$996
- Tax from tax record
- −$119 /mo · $1,433/yr
- Insurance
- −$79
- HOA
- −$0
- Vacancy / Maint / Mgmt
- −$326
- Net cashflow
- $31
Break-even live
Sensitivity live
| Price | -10% $139 | -5% $85 | +0% $31 | +5% $-22 | +10% $-76 |
|---|---|---|---|---|---|
| Rent | -10% $-91 | -5% $-30 | +0% $31 | +5% $93 | +10% $154 |
| Rate | -1.0pp $127 | -0.5pp $80 | base $31 | +0.5pp $-18 | +1.0pp $-68 |
UW: 25.0% down · 7.5% · 30yr · 1.5% tax · 5.0% vac · 8.0% maint · 8.0% mgmt
Financing live
Cash to close
- Down payment
- $47,500
- Closing costs
- $5,700
- Reserves months
- —
- Total cash needed
- —
Loan-product check · same deal, 3 products live
Conventional
25% down · 7.5% · 30yr
- Down + closing
- —
- Monthly P&I
- —
- Monthly cashflow
- —
- DSCR
- —
- Eligible?
- —
Personal DTI + credit; lowest rate.
DSCR
20% down · 8.5% · 30yr
- Down + closing
- —
- Monthly P&I
- —
- Monthly cashflow
- —
- DSCR
- —
- Eligible?
- —
No personal income docs; deal must DSCR.
Hard money
10% down · 12.0% · 12mo
- Down + closing
- —
- Monthly P&I
- —
- Monthly cashflow
- —
- DSCR
- —
- Eligible?
- —
Short-term bridge; refi at stabilization.
Rent comps 12 comps
| Address | Beds | Baths | Sqft | Rent | $/sqft | DOM | Units | Dist |
|---|---|---|---|---|---|---|---|---|
| 2925 Village Cir Edmond, OK | 1.0 | 2.0 | 960 | $950 | $0.99 | 13d | 1 | 0.43mi |
| 3412 Prairie Ave Edmond, OK | 3.0 | 2.5 | 1589 | $1,970 | $1.24 | 3d | 1 | 0.65mi |
| 13005 Silver Eagle Trl Edmond, OK | 3.0 | 2.0 | 1826 | $1,750 | $0.96 | 3d | 1 | 1.06mi |
| 2433 Shady Tree Ln Edmond, OK | 3.0 | 2.0 | 1460 | $1,795 | $1.23 | 3d | 1 | 1.13mi |
| 13408 Thompson Rd Edmond, OK | 3.0 | 2.0 | 1592 | $2,000 | $1.26 | 3d | 1 | 1.14mi |
| 2704 NE 129th St Edmond, OK | 3.0 | 2.0 | 1572 | $1,850 | $1.18 | 5d | 1 | 1.14mi |
| 205 E 30th St Unit 1 Edmond, OK | 3.0 | 2.0 | 1400 | $1,450 | $1.04 | 25d | 1 | 1.21mi |
| 637 Redstone Ave Edmond, OK | 3.0 | 1.5 | 1228 | $1,450 | $1.18 | 16d | 1 | 1.23mi |
| 14025 N Eastern Ave Edmond, OK | 2.0 | 2.0 | 1108 | $1,349 | $1.22 | 25d | 1 | 1.24mi |
| 1715 Edgewood Dr Edmond, OK | 2.0 | 1.0 | 1191 | $1,450 | $1.22 | 13d | 1 | 1.39mi |
| 140 Ridgecrest Rd Edmond, OK | 3.0 | 1.0 | 1000 | $1,400 | $1.40 | 23d | 1 | 1.41mi |
| 345 Travis Cir Edmond, OK | 3.0 | 2.0 | 1325 | $1,495 | $1.13 | 3d | 1 | 1.47mi |
Listing history 24 events
-
2026-06-13statusdays on market $190,000 Pending 7 DOM
-
2026-06-09days on market $190,000 Active 5 DOM
-
2026-06-08days on market $190,000 Active 4 DOM
-
2026-06-07pricedays on market $190,000 Active 3 DOM
-
2026-06-03days on market $195,000 Active 46 DOM
-
2026-06-02days on market $195,000 Active 45 DOM
-
2026-06-01days on market $195,000 Active 44 DOM
-
2026-05-31days on market $195,000 Active 43 DOM
-
2026-05-18$1,500
-
2026-05-18historical $1,500
-
2026-04-22price $1,500
-
2026-04-19$195,000 Active
-
2026-04-02price $1,600
-
2026-02-18price $1,650
-
2026-01-09$1,750
-
2011-11-26historical
-
2011-04-25$105,000
-
2008-12-31soldstatus $96,000
-
2008-12-29soldstatus $96,000 176-char remark
Show marketing remark (176 chars)
Under $100K in Edmond? Better Hurry. Townhouse backs to greenbelt, has new tile, paint, fixtures, stove, carpet upstairs, and exterior doors. HOA dues take care of yardwork.
-
2008-10-10$99,000 176-char remark
Show marketing remark (176 chars)
Under $100K in Edmond? Better Hurry. Townhouse backs to greenbelt, has new tile, paint, fixtures, stove, carpet upstairs, and exterior doors. HOA dues take care of yardwork.
-
2005-07-05soldstatus $74,500
-
2005-03-15soldstatus $74,500
-
2005-02-04$78,500
-
1994-09-01soldstatus $52,000
ⓘ Source: listings_history table (triggers on properties + properties_extension) + one-shot
backfill from property_details.listing_events for pre-trigger history.
Tax reassessment forecast OK · Resets to sale price
- Current annual tax
- $1,433 · $119/mo
- Projected year-2 tax
- $1,710 · $142/mo
- Expected delta
- +$277/yr (+$23/mo · 19.4%)
ⓘ Screening estimate from a state-policy table — verify with the county assessor before closing.
Climate risk First Street
- Flood 1/10 Low FEMA zone X (unshaded) · 0% chance over 30 yrs
- Wildfire 4/10 Moderate
- Heat 6/10 Major 7 d/yr ≥108°F today · 19 d/yr by 30 yrs out
- Wind 2/10 Low 4% chance of damaging wind over 30 yrs
- Air quality 2/10 Low 2 unhealthy d/yr today · 2 by 30 yrs out
Nearby sold comps map
Loading sold comps map…
Walkable amenities ~0.75 mi
Loading nearby amenities…
Taxation est. · year 1
- Rental income
- $18,628
- − Mortgage interest
- −$10,643
- − Property taxes
- −$1,433
- − Insurance
- −$950
- − Repairs & maintenance
- −$1,490
- − Management
- −$1,490
- − Depreciation
- −$5,527
- Taxable loss
- −$2,905
- Est. tax savings @ 24.0%
- +$697
- After-tax cash flow
- $1,074/yr
For passive investors: Depreciation is non-cash, so a rental often shows a tax loss while cash-flowing — sheltering income. Rental losses are passive: they offset passive income freely, and up to $25,000/yr can offset ordinary (W-2) income if you actively participate and your MAGI is under $100k (phasing out to $0 by $150k); unused losses carry forward. On sale, claimed depreciation is recaptured at up to 25%, and gains may owe capital-gains tax (a 1031 exchange can defer both). Figures are a year-1 estimate at your 24.0% rate — not tax advice; consult a CPA.
Schools (NCES district)
- District
- Edmond
- NCES district ID
- 4010590
- Math proficiency
- 38% ▼ -12.00%
- Reading proficiency
- 40% ▼ -12.00%
- Median HH income
- $73,212
- Composite
- 35.88/100
- National rank
- #4814
- State rank
- #11 of 270 in OK
Livability — Edmond
- Score
- 78/100
- State rank
- #6
- US rank
- #2383
Category grades
Schools grade is shown separately in the Schools card above.
Census & demographics
- Census place
- Edmond, OK
- County
- Oklahoma County · 771,644 people
- City population
- 177,083
- Metro
- Oklahoma City, OK
- Population (ZIP)
- 58,023
- Household income
- $113,870
- Rent vs Own
- Severe rent burden
- 1313.0
Population outlook (Oklahoma County) Hauer SSP2
- Today (2025)
- 911,875 people
- By 2030
- 982,413 · +7.7%
- By 2040
- 1,130,468 · +24.0%
- By 2050
- 1,288,422 · +41.3%
- By 2075
- 1,711,482 · +87.7%
- By 2100
- 2,088,448 · +129.0%
Race, ethnicity, and origin ACS 2023
- Neighborhood character
- Predominantly White (67%)
- Race & ethnicity
- White 67% Two or more races 11% Black 9% Asian 7% Hispanic / Latino 5% Native American 2%
- Hispanic origin (detail)
- Mexican 2%
- Common ancestry
- Slovak 3% Italian 2% Lithuanian 2%
- Foreign-born
- 7% · Canada, Vietnam
- Languages at home
- 91% English-only · Other Indo-European 3% Spanish 2% Vietnamese 1%
Political lean MEDSL · Oklahoma
- 2024 margin
- Toss-up / Even · D 48.0% · R 49.7% · Other 2.3%
- 2008→2024 swing
- +15.1pp toward D · 2008: -16.8pp · 2024: -1.7pp
- All cycles
- 2024: R+1.7 2020: R+1.1 2016: R+10.5 2012: R+16.7 2008: R+16.8
Not yet ingested
- Civics
- —
Market trends
- HPI YoY
- ▼ -201.41%
- Current HPI
- 214.2251
- Rent YoY
- ▲ 3.14%
- Metro
- Oklahoma City, OK
- State GDP YoY
- ▲ 1.55%
- F500 in state
- 6
Industry mix (Fortune 500 HQ in OK)
| Industry | F500 HQs | Revenue |
|---|---|---|
| Energy | 3 | $48B |
|
||
Price history
-97.1% since first listed16 events — show timeline
- 2026-05-18 Listed for Rent $1,500 MLSOK
- 2026-05-18 Rental Removed $1,500 BUILDIUM
- 2026-04-22 Price Changed $1,500 BUILDIUM
- 2026-04-19 Listed $195,000 MLSOK
- 2026-04-02 Price Changed $1,600 BUILDIUM
- 2026-02-18 Price Changed $1,650 BUILDIUM
- 2026-01-09 Listed for Rent $1,750 BUILDIUM
- 2011-11-26 Listing Removed — MLSOK
- 2011-04-25 Listed $105,000 MLSOK
- 2008-12-31 Sold (Public Records) $96,000 Public Records
- 2008-12-29 Sold (MLS) $96,000 MLSOK
- 2008-10-10 Listed $99,000 MLSOK
- 2005-07-05 Sold (MLS) $74,500 MLSOK
- 2005-03-15 Sold (Public Records) $74,500 Public Records
- 2005-02-04 Listed $78,500 MLSOK
- 1994-09-01 Sold (Public Records) $52,000 Public Records
Property tax history
+4.8%/yrLatest (2025): $1,433 · +5.1% YoY. Source: county tax records.
Cash-flow waterfall
monthlySold comps — $/sqft
last 12 mo · ≤1 miLoading sold comps…