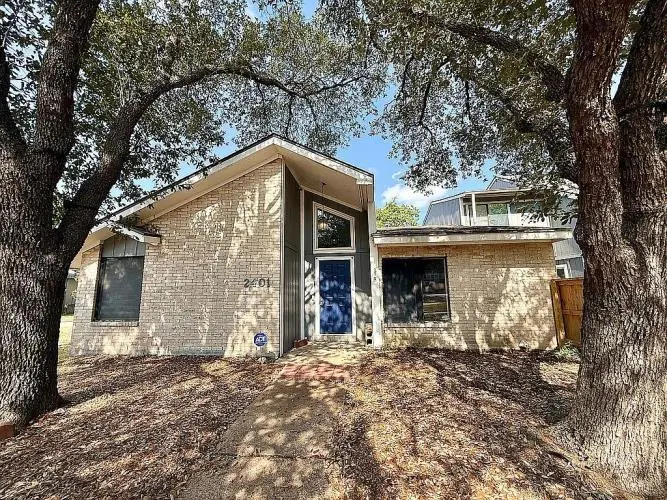
2401 Memorial Dr · Bryan, TX
Flood risk 1/10 · Minimal
- FEMA flood zone
- X (unshaded)
- Chance of flooding over 30 yrs
- 0.0%
- Est. flood insurance / yr
- $507 – $1,088
Fire risk 1/10 · Minimal
- Est. fire insurance / yr
- $1,222 – $2,270
Heat risk 8/10 · Major
- Hot days now (above 110°F)
- 7 days/yr
- Hot days in 30 yrs
- 24 days/yr
Wind risk 8/10 · Major
- Chance of severe wind over 30 yrs
- 80.0%
Air-quality risk 1/10 · Minimal
- Unhealthy air days now
- 0 days/yr
- Unhealthy air days in 30 yrs
- 0 days/yr
Risk factors via First Street. Map © Google.
Why this score? — see what drove the D grade
The composite is a weighted blend of 9 inputs, each scored 0–100. Each bar is that input's sub-score; the figure is the points it added to the 100-point composite (weight × sub-score).
- ARV discount +15.0/15.0
- Cash flow +9.1/30.0
- Livability +3.8/5.0
- 1% rule +3.2/10.0
- Rent growth +3.0/5.0
- Schools +2.6/10.0
- DSCR +2.5/10.0
- Condition / age +2.5/5.0
- Appreciation +0.0/10.0
$228,900
🖨 Deal sheet (PDF) 📄 Offer letter ✓ Due diligence
Listing remarks MLS
Great convenient location on huge corer lot near Blinn and hospital in highly sought after Memorial Village neighborhood. 3 BR/2BA w 2 car detached garage. One bedroom has private entrance perfect for rental opportunity or mother in law suite. Open concept living/dining area w high ceilings and fireplace. Fenced yard w private back garage entrance. Great investment opportunity or family home.
Key facts
- Open concept living
- Fenced yard
- Huge corner lot
Tags
Neighborhood map
What this means for you Summary
Snapshot
- This is a 3-bed/2.0-bath townhouse listed at $229k.
Deal economics
- At list price, monthly cash flow is $-177 ($-2k/yr) — negative.
- To cash-flow at today's rent, offer at most $198k (13.7% below list).
- To meet the 1% rule (rent ≥ 1% of price), the offer needs to be $188k (18.1% below list).
- Recommended offer: $188k (18.1% below list) — sets the bar for 1% rule.
- Cap rate 5.4% vs local median 4.0% in Bryan — top-decile yield for the area; either an underpriced asset or a hidden risk that comps aren't pricing in. Stress-test before assuming the spread holds.
Location & tenants
- Location reads 76/100 on livability (#99 in TX, #3,341 nationally) — a middle-class / working-renter tenant base. Strengths: cost of living A+, housing A+, health & safety A+; Watch: crime C-, amenities C-, employment D+.
- Bryan ISD (urban): math 30% / reading 32% proficiency, ranked #608 of 826 in TX (top 74%) — families likely to look elsewhere, expect single-tenant / working-renter base with shorter leases; 68% free/reduced lunch — lower-income household profile, screen leases tightly.
- Zoned schools: Johnson El (math 42% / reading 42%, grade F, #1,335 of 4,322 statewide, top 33%, 542 students, 59% FRL); Stephen F Austin (math 25% / reading 36%, grade F, #1,036 of 1,662 statewide, top 63%, 1,206 students, 76% FRL); Travis B Bryan H S (math 22% / reading 34%, grade F, #1,170 of 1,632 statewide, top 72%, 2,419 students, 67% FRL) — zoned schools at 67% FRL track the district average.
- Market conditions: Rents rising (+1.8%/yr); 278 active listings in the ZIP; 13 comparable units currently listed for rent nearby; rentals at typical pace (median 23d on market — plan ~3-4 weeks tenant-placement turnaround); 46% of comp listings sitting > 30 days — soft ceiling on asking rent; 2,211 units permitted in Brazos County in 2024 (768 in 5+ unit buildings).
- This rent runs 32% of the median local income ($71k/yr) — at the standard rent-burdened threshold; future hikes will face affordability resistance.
Forward outlook
- Local home prices are declining (-3.0%/yr); year-one equity from $2k of loan paydown is wiped out by about $7k of value loss. Plan a longer hold.
- Brazos County population projected at +55% by 2050 — long-run rental-demand tailwind backs the buy-and-hold thesis.
Negotiation context
- It's been on market 261 days — a 12% lower offer ($201k) is reasonable based on typical stale-listing flexibility.
- 4 sale attempts since 11y ago with the ask held roughly flat each time — persistent listings suggest the price (not the market) is what's stuck; bring a comps-based counter.
Risks & watch-outs
- Climate carrying-cost: severe wind risk, 80% chance of damaging wind over 30y; extreme-heat days projected 7→24/yr by 2055 (HVAC capex compounding) — expect insurance premiums to compound above CPI over the hold.
Questions for the listing agent
- What do current leases actually rent for vs. the listed asking? Can we see a recent rent roll and the last 12 months of T-12 income?
- It's been on market 261 days. Have you received any prior offers? Is the seller open to a 18% concession, seller financing, or rate buy-down credit?
- Built in 1976 — when were the roof, HVAC, electrical panel, plumbing, and water heater last replaced?
- Why hasn't it sold? Are there any deal-killer items the seller is aware of (foundation, flood, title, zoning, code violations)?
- Is there a deadline driving the sale (1031 exchange, divorce, estate, relocation)? That informs how much negotiation room exists.
- The area grade is low — what's the realistic commute time and amenity access for the typical tenant pool here? Any planned neighborhood developments (good or bad) we should know about?
- What's the average days-on-market for RENTAL listings here right now (not sales)? A rising rental-DOM trend means longer vacancies and softer asking-rent achievability than the comps imply.
- What's the recent tenant-quality profile in this submarket — average credit score on applications, eviction rate, late-payment / NSF rate, and stable-employment percentage? A property-management company in the area should have these aggregated.
- How much new for-sale + rental construction is in the pipeline within 1–3 miles? Heavy new supply typically softens prices + rents 12–24 months out; constrained supply supports both.
Investment metrics
- 1% rule
- 0.82% ✗
- Cap rate
- 5.36%
- Cash-on-cash
- -3.32%
- DSCR
- 0.85
- GRM
- 10.2
CMA / ARV
- ARV (median comp)
- $319,058
- List price
- $228,900
- Delta
- -28.26%
- Verdict
- UNDERPRICED
- Comps
- 20 within 1.0 mi
Show comp detail 3 sales within ~0.75 mi
| Address | Dist | Beds/Ba | Sqft | Sold | Price | $/sf | Match |
|---|---|---|---|---|---|---|---|
| 2806 Broadmoor Dr | 0.45mi | 3/2.5 | 1,913 (+1%) | 10mo | $325,000 | $170 | 67 |
| 2910 Briarcreek Ct | 0.29mi | 3/2.5 | 1,769 (-6%) | 19mo | $299,000 | $169 | 58 |
| 3122 Camelot Dr #53 | 0.35mi | 3/2.0 | 1,723 (-9%) | 13mo | $219,900 | $128 | 58 |
Match score weights: distance 35% · size 25% · config 20% · recency 20%. Top-matched comps best support the ARV.
Projected returns pro-forma
-3.0% appreciation · 1.82% rent growth · sell at horizon
- IRR
- -23.2%
- Equity multiple
- 0.21×
- Total profit
- $-50,521
- Equity at exit
- $34,130
- IRR
- -21.4%
- Equity multiple
- -0.05×
- Total profit
- $-67,061
- Equity at exit
- $19,791
Cash invested: $64,092 (down + closing). Projections, not guarantees.
Landlord ↔ Tenant lean methodology
- Overall (STATE)
- 87 Strongly Landlord-Friendly
- State Texas
- 87 Strongly Landlord-Friendly · R+5
- County
- — inherits STATE
- City
- — inherits STATE
ZIP-level market 77802
- Rents YoY
- 1.8%
- Active inventory
- 278
- Price-to-rent
- 10.2×
Monthly cashflow live
- Estimated rent
- $1,875 high interval (Pro) →
- Mortgage (P&I)
- −$1,200
- Tax from tax record
- −$363 /mo · $4,360/yr
- Insurance
- −$95
- HOA
- −$0
- Vacancy / Maint / Mgmt
- −$394
- Net cashflow
- $-177
Break-even live
Sensitivity live
| Price | -10% $-48 | -5% $-113 | +0% $-177 | +5% $-242 | +10% $-307 |
|---|---|---|---|---|---|
| Rent | -10% $-326 | -5% $-252 | +0% $-177 | +5% $-103 | +10% $-29 |
| Rate | -1.0pp $-62 | -0.5pp $-119 | base $-177 | +0.5pp $-237 | +1.0pp $-297 |
UW: 25.0% down · 7.5% · 30yr · 1.5% tax · 5.0% vac · 8.0% maint · 8.0% mgmt
Financing live
Cash to close
- Down payment
- $57,225
- Closing costs
- $6,867
- Reserves months
- —
- Total cash needed
- —
Loan-product check · same deal, 3 products live
Conventional
25% down · 7.5% · 30yr
- Down + closing
- —
- Monthly P&I
- —
- Monthly cashflow
- —
- DSCR
- —
- Eligible?
- —
Personal DTI + credit; lowest rate.
DSCR
20% down · 8.5% · 30yr
- Down + closing
- —
- Monthly P&I
- —
- Monthly cashflow
- —
- DSCR
- —
- Eligible?
- —
No personal income docs; deal must DSCR.
Hard money
10% down · 12.0% · 12mo
- Down + closing
- —
- Monthly P&I
- —
- Monthly cashflow
- —
- DSCR
- —
- Eligible?
- —
Short-term bridge; refi at stabilization.
Rent comps 13 comps
| Address | Beds | Baths | Sqft | Rent | $/sqft | DOM | Units | Dist |
|---|---|---|---|---|---|---|---|---|
| 2812 Village Dr Bryan, TX | 2.0 | 2.0 | 1244 | $1,400 | $1.13 | 45d | 1 | 0.03mi |
| 1815 Gettysburg Ln Unit 1328085P Bryan, TX | 3.0 | 2.0 | 1603 | $3,721 | $2.32 | 23d | 1 | 0.69mi |
| 1503 Hollow Hill Dr Unit A Bryan, TX | 3.0 | 3.0 | 1364 | $1,550 | $1.14 | 45d | 1 | 0.70mi |
| 1503 Hollow Hill Dr Unit A Bryan, TX | 3.0 | 3.0 | 1364 | $1,550 | $1.14 | 15d | 1 | 0.70mi |
| 2902 Chaparral Cir Bryan, TX | 4.0 | 3.0 | 2181 | $3,000 | $1.38 | 23d | 1 | 0.73mi |
| 2702 Apple Creek Cir Bryan, TX | 4.0 | 3.0 | 2198 | $2,800 | $1.27 | 15d | 1 | 0.82mi |
| 2106 Barak Ln Bryan, TX | 4.0 | 2.5 | 1943 | $2,400 | $1.24 | 45d | 1 | 0.97mi |
| 728 Meadow Ln Unit 1093291P Bryan, TX | 3.0 | 2.0 | 1517 | $4,919 | $3.24 | 45d | 1 | 1.08mi |
| 807 S Coulter Dr Bryan, TX | 4.0 | 3.0 | 2154 | $2,250 | $1.04 | 45d | 1 | 1.25mi |
| 1326 Prairie Dr Bryan, TX | 2.0–3.0 | 2.0–3.0 | 1167 | $1,745 | $1.50 | 23d | 1 | 1.32mi |
| 3004 Red Robin Loop Unit 1328084P Bryan, TX | 3.0 | 2.0 | 1259 | $3,767 | $2.99 | 23d | 1 | 1.39mi |
| 1803 S College Ave Bryan, TX | 3.0 | 3.0 | 1760 | $1,800 | $1.02 | 15d | 1 | 1.40mi |
| 814 E 28th St Bryan, TX | 2.0 | 2.0 | 1777 | $1,550 | $0.87 | 45d | 1 | 1.47mi |
Listing history 27 events
-
2026-06-21days on market $228,900 Active 261 DOM
-
2026-06-18days on market $228,900 Active 258 DOM
-
2026-06-17days on market $228,900 Active 257 DOM
-
2026-06-16days on market $228,900 Active 256 DOM
-
2026-06-15days on market $228,900 Active 255 DOM
-
2026-06-14days on market $228,900 Active 253 DOM
-
2026-06-13days on market $228,900 Active 252 DOM
-
2026-06-10days on market $228,900 Active 250 DOM
-
2026-06-09days on market $228,900 Active 249 DOM
-
2026-06-08days on market $228,900 Active 248 DOM
-
2026-06-07days on market $228,900 Active 247 DOM
-
2026-06-03days on market $228,900 Active 243 DOM
-
2026-06-02days on market $228,900 Active 242 DOM
-
2026-06-01days on market $228,900 Active 241 DOM
-
2026-05-31days on market $228,900 Active 240 DOM
-
2026-05-30days on market $228,900 Active 239 DOM
-
2026-05-01soldstatus
-
2025-09-29$228,900 Active 395-char remark
Show marketing remark (395 chars)
Great convenient location on huge corer lot near Blinn and hospital in highly sought after Memorial Village neighborhood. 3 BR/2BA w 2 car detached garage. One bedroom has private entrance perfect for rental opportunity or mother in law suite. Open concept living/dining area w high ceilings and fireplace. Fenced yard w private back garage entrance. Great investment opportunity or family home.
-
2023-04-11soldstatus
-
2018-06-18$200,000
-
2017-11-20soldstatus
-
2017-11-20soldstatus
-
2017-06-09$189,900
-
2015-03-27soldstatus
-
2015-03-26soldstatus
-
2015-02-16$149,500
-
2006-03-01soldstatus
ⓘ Source: listings_history table (triggers on properties + properties_extension) + one-shot
backfill from property_details.listing_events for pre-trigger history.
Tax reassessment forecast TX · Resets to sale price
- Current annual tax
- $4,360 · $363/mo
- Projected year-2 tax
- $4,360 · $363/mo
- Expected delta
- $0/yr ($0/mo · 0.0%)
ⓘ Screening estimate from a state-policy table — verify with the county assessor before closing.
Climate risk First Street
- Flood 1/10 Low FEMA zone X (unshaded) · 0% chance over 30 yrs
- Wildfire 1/10 Low
- Heat 8/10 Severe 7 d/yr ≥110°F today · 24 d/yr by 30 yrs out
- Wind 8/10 Severe 80% chance of damaging wind over 30 yrs
- Air quality 1/10 Low 0 unhealthy d/yr today · 0 by 30 yrs out
Nearby sold comps map
Loading sold comps map…
Walkable amenities ~0.75 mi
Loading nearby amenities…
Taxation est. · year 1
- Rental income
- $22,505
- − Mortgage interest
- −$12,822
- − Property taxes
- −$4,360
- − Insurance
- −$1,144
- − Repairs & maintenance
- −$1,800
- − Management
- −$1,800
- − Depreciation
- −$6,659
- Taxable loss
- −$6,081
- Est. tax savings @ 24.0%
- +$1,459
- After-tax cash flow
- $-670/yr
For passive investors: Depreciation is non-cash, so a rental often shows a tax loss while cash-flowing — sheltering income. Rental losses are passive: they offset passive income freely, and up to $25,000/yr can offset ordinary (W-2) income if you actively participate and your MAGI is under $100k (phasing out to $0 by $150k); unused losses carry forward. On sale, claimed depreciation is recaptured at up to 25%, and gains may owe capital-gains tax (a 1031 exchange can defer both). Figures are a year-1 estimate at your 24.0% rate — not tax advice; consult a CPA.
Schools (NCES district)
- District
- Bryan ISD
- NCES district ID
- 4811790
- Math proficiency
- 30% ▼ -8.00%
- Reading proficiency
- 32% ▼ -3.00%
- Median HH income
- $41,895
- Composite
- 26.26/100
- National rank
- #7253
- State rank
- #608 of 826 in TX
Livability — Bryan
- Score
- 76/100
- State rank
- #99
- US rank
- #3341
Category grades
Schools grade is shown separately in the Schools card above.
Census & demographics
- Census place
- Bryan, TX
- County
- Brazos County · 233,400 people
- City population
- 101,772
- Metro
- College Station-Bryan, TX
- Population (ZIP)
- 25,762
- Household income
- $70,666
- Rent vs Own
- Severe rent burden
- 1559.0
Population outlook (Brazos County) Hauer SSP2
- Today (2025)
- 267,942 people
- By 2030
- 296,630 · +10.7%
- By 2040
- 354,560 · +32.3%
- By 2050
- 414,616 · +54.7%
- By 2075
- 562,158 · +109.8%
- By 2100
- 678,828 · +153.3%
Race, ethnicity, and origin ACS 2023
- Neighborhood character
- Diverse neighborhood (Simpson 0.58)
- Race & ethnicity
- White 59% Hispanic / Latino 26% Two or more races 12% Black 11% Asian 2%
- Hispanic origin (detail)
- Mexican 23%
- Common ancestry
- Lithuanian 3% Slovak 2% Italian 2%
- Foreign-born
- 7% · Canada, South Korea
- Languages at home
- 82% English-only · Spanish 15% Korean 1% Russian/Polish/Slavic 1%
Political lean MEDSL · Brazos
- 2024 margin
- Strong R (+24.9) · D 36.9% · R 61.7% · Other 1.4%
- 2008→2024 swing
- +4.1pp toward D · 2008: -28.9pp · 2024: -24.9pp
- All cycles
- 2024: R+24.9 2020: R+14.3 2016: R+23.7 2012: R+35.3 2008: R+28.9
Not yet ingested
- Civics
- —
Market trends
- HPI YoY
- ▼ -148.67%
- Current HPI
- 202.0858
- Rent YoY
- ▲ 1.82%
- Metro
- College Station-Bryan, TX
- State GDP YoY
- ▲ 3.95%
- F500 in state
- 110
Industry mix (Fortune 500 HQ in TX)
| Industry | F500 HQs | Revenue |
|---|---|---|
| Energy | 16 | $1,198B |
|
||
| Technology | 5 | $198B |
|
||
| Engineering / Construction | 4 | $72B |
|
||
| Energy Services | 3 | $60B |
|
||
| Utilities | 3 | $41B |
|
||
| Healthcare | 2 | $330B |
|
||
Price history
+53.1% since first listed11 events — show timeline
- 2026-05-01 Sold (Public Records) — Public Records
- 2025-09-29 Listed $228,900 Fizber.com
- 2023-04-11 Sold (Public Records) — Public Records
- 2018-06-18 Listed $200,000 BCSRMLS
- 2017-11-20 Sold (Public Records) — Public Records
- 2017-11-20 Sold (MLS) — BCSRMLS
- 2017-06-09 Listed $189,900 BCSRMLS
- 2015-03-27 Sold (Public Records) — Public Records
- 2015-03-26 Sold (MLS) — BCSRMLS
- 2015-02-16 Listed $149,500 BCSRMLS
- 2006-03-01 Sold (Public Records) — Public Records
Property tax history
+4.8%/yrLatest (2025): $4,360 · -7.8% YoY. Source: county tax records.
Cash-flow waterfall
monthlySold comps — $/sqft
last 12 mo · ≤1 miLoading sold comps…