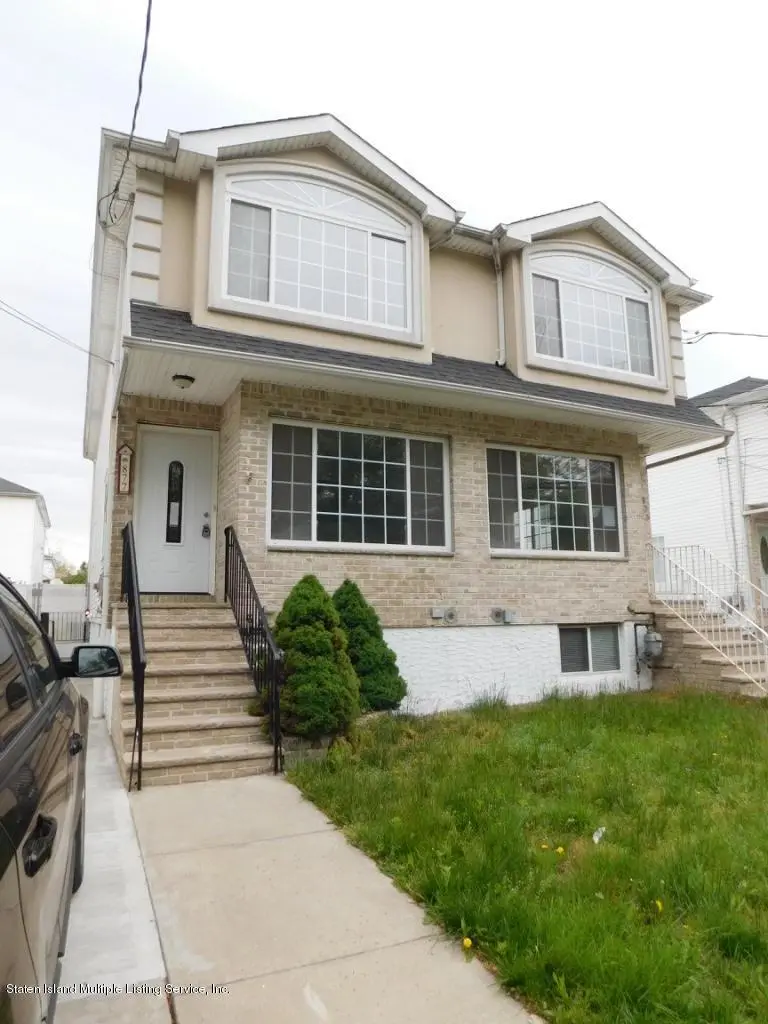
877 Travis Ave · New York, NY
Flood risk 1/10 · Minimal
- FEMA flood zone
- X (unshaded)
- Chance of flooding over 30 yrs
- 0.0%
- Est. flood insurance / yr
- $507 – $1,088
Fire risk 4/10 · Minor
- Est. fire insurance / yr
- $691 – $1,283
Heat risk 7/10 · Major
- Hot days now (above 98°F)
- 7 days/yr
- Hot days in 30 yrs
- 15 days/yr
Wind risk 6/10 · Moderate
- Chance of severe wind over 30 yrs
- 50.0%
Air-quality risk 4/10 · Minor
- Unhealthy air days now
- 5 days/yr
- Unhealthy air days in 30 yrs
- 6 days/yr
Risk factors via First Street. Map © Google.
Why this score? — see what drove the D+ grade
The composite is a weighted blend of 9 inputs, each scored 0–100. Each bar is that input's sub-score; the figure is the points it added to the 100-point composite (weight × sub-score).
- ARV discount +15.0/15.0
- Cash flow +11.1/30.0
- Schools +5.0/10.0
- Livability +3.8/5.0
- Rent growth +3.5/5.0
- 1% rule +3.3/10.0
- DSCR +3.2/10.0
- Condition / age +2.5/5.0
- Appreciation +0.0/10.0
$439,000
🖨 Deal sheet (PDF) 📄 Offer letter ✓ Due diligence
Listing remarks
Your search for your new home ends right now. Fit right in to your updated 3 BR / 3 Bath home. Enjoy friends and family over for dinner in your oversized kitchen which features an open layout, new cabinets and granite countertops. Master bedroom features cathedral ceilings and the large 4 piece master bath is the perfect compliment to your home. Attractively priced, conveniently located, tremendous value and the opportunity to move right in, unpack your bags and start to enjoy your new home. Leave some time to see this one because you are sure to fall in love. ..
Key facts
- 2,266 sq ft lot
- Built 2004
- Listed 46 days
Neighborhood map
What this means for you Summary
Snapshot
- This is a 3-bed/2.5-bath single-family listed at $439k.
Deal economics
- At list price, monthly cash flow is $-176 ($-2k/yr) — negative.
- To cash-flow at today's rent, offer at most $408k (7.1% below list).
- To meet the 1% rule (rent ≥ 1% of price), the offer needs to be $363k (17.4% below list).
- Recommended offer: $363k (17.4% below list) — sets the bar for 1% rule.
- Cap rate 5.8% vs local median 2.6% in New York — top-decile yield for the area; either an underpriced asset or a hidden risk that comps aren't pricing in. Stress-test before assuming the spread holds.
Location & tenants
- Location reads 75/100 on livability (#268 in NY, #4,188 nationally) — a middle-class / working-renter tenant base. Strengths: amenities A+, commute A+, health & safety A; Watch: crime F, cost of living F.
- Zoned schools: Elm Tree Elementary School (math 27% / reading 52%, grade F, #1,444 of 2,108 statewide, top 71%, 806 students, 94% FRL); Is 72 Rocco Laurie (math 47% / reading 65%, grade B-, #205 of 729 statewide, top 29%, 1,449 students, 66% FRL); Midwood High School (math 94% / reading 96%, grade A+, #83 of 1,100 statewide, top 8%, 4,062 students, 73% FRL).
- Market conditions: Rents rising (+3.9%/yr); 490 active listings in the ZIP; 1 comparable units currently listed for rent nearby; solid renter incomes; 480 units permitted in Richmond County in 2024 (22 in 5+ unit buildings).
- This rent runs 42% of the median local income ($105k/yr) — at the standard rent-burdened threshold; future hikes will face affordability resistance.
Forward outlook
- Local home prices are declining (-3.0%/yr); year-one equity from $3k of loan paydown is wiped out by about $13k of value loss. Plan a longer hold.
- Richmond County population projected to shrink 5% by 2050 — rents likely to lag national; underwrite the cash flow, not the appreciation.
Negotiation context
- It's been on market 46 days — a 3% lower offer ($426k) is reasonable based on typical stale-listing flexibility.
- 4 sale attempts since 21y ago with the ask held roughly flat each time — persistent listings suggest the price (not the market) is what's stuck; bring a comps-based counter.
Risks & watch-outs
- Climate carrying-cost: major wind risk, 50% chance of damaging wind over 30y; extreme-heat days projected 7→15/yr by 2055 (HVAC capex compounding) — expect insurance premiums to compound above CPI over the hold.
Questions for the listing agent
- What do current leases actually rent for vs. the listed asking? Can we see a recent rent roll and the last 12 months of T-12 income?
- It's been on market 46 days. Have you received any prior offers? Is the seller open to a 17% concession, seller financing, or rate buy-down credit?
- Is there a deadline driving the sale (1031 exchange, divorce, estate, relocation)? That informs how much negotiation room exists.
- Schools are B-rated — typically a magnet for longer-tenancy family renters. What's the average tenant stay here, and is there a school-zone premium baked into asking?
- Crime grade is F in this area — have there been break-ins, vandalism, or insurance claims at this property in the last 3 years? What carrier currently insures it and at what premium?
- The area grade is low — what's the realistic commute time and amenity access for the typical tenant pool here? Any planned neighborhood developments (good or bad) we should know about?
- What's the average days-on-market for RENTAL listings here right now (not sales)? A rising rental-DOM trend means longer vacancies and softer asking-rent achievability than the comps imply.
- What's the recent tenant-quality profile in this submarket — average credit score on applications, eviction rate, late-payment / NSF rate, and stable-employment percentage? A property-management company in the area should have these aggregated.
- How much new for-sale + rental construction is in the pipeline within 1–3 miles? Heavy new supply typically softens prices + rents 12–24 months out; constrained supply supports both.
Investment metrics
- 1% rule
- 0.83% ✗
- Cap rate
- 5.81%
- Cash-on-cash
- -1.71%
- DSCR
- 0.92
- GRM
- 10.1
CMA / ARV
- ARV (on-the-fly)
- $655,200
- Comps found
- 12
Show comp detail 12 sales within ~0.75 mi
| Address | Dist | Beds/Ba | Sqft | Sold | Price | $/sf | Match |
|---|---|---|---|---|---|---|---|
| 2054 Richmond Ave | 0.30mi | 4/2.5 (+1) | 1,430 (+2%) | 4mo | $725,000 | $507 | 74 |
| 12 Grissom Ave | 0.41mi | 3/1.5 | 1,392 (-1%) | 4mo | $555,000 | $399 | 72 |
| 34 Country Dr E Unit A45 | 0.47mi | 2/2.5 (-1) | 1,395 (-0%) | 2mo | $350,000 | $251 | 71 |
| 197 Park Dr N | 0.21mi | 3/2.5 | 1,246 (-11%) | 2mo | $772,000 | $620 | 70 |
| 135 Freedom Ave | 0.18mi | 3/1.5 | 1,548 (+11%) | 4mo | $725,000 | $468 | 67 |
| 6 Mulberry Ave | 0.27mi | 3/1.5 | 1,232 (-12%) | 2mo | $710,000 | $576 | 62 |
| 107 Denker Pl | 0.70mi | 3/1.5 | 1,410 (+1%) | 3mo | $670,000 | $475 | 59 |
| 29 A Cooper Ter | 0.37mi | 3/1.5 | 1,591 (+14%) | 1mo | $550,000 | $346 | 55 |
| 20 Sweetgum Ln | 0.72mi | 3/2.5 | 1,551 (+11%) | 4mo | $816,000 | $526 | 45 |
| 19 Lamped Loop Unit A3 | 0.56mi | 3/1.5 | 1,202 (-14%) | 1mo | $482,500 | $401 | 45 |
| 52 Racal Ct Unit A-2 | 0.56mi | 2/1.5 (-1) | 1,232 (-12%) | 1mo | $486,500 | $395 | 44 |
| 36 Northport Ln | 0.75mi | 2/1.5 (-1) | 1,300 (-7%) | 2mo | $550,000 | $423 | 42 |
Match score weights: distance 35% · size 25% · config 20% · recency 20%. Top-matched comps best support the ARV.
Projected returns pro-forma
-3.0% appreciation · 3.93% rent growth · sell at horizon
- IRR
- -18.1%
- Equity multiple
- 0.36×
- Total profit
- $-78,837
- Equity at exit
- $65,456
- IRR
- -8.6%
- Equity multiple
- 0.44×
- Total profit
- $-68,488
- Equity at exit
- $37,957
Cash invested: $122,920 (down + closing). Projections, not guarantees.
Landlord ↔ Tenant lean methodology
- Overall (CITY)
- 0 Strongly Tenant-Friendly
- State New York
- 15 Strongly Tenant-Friendly · D+10
- County
- — inherits STATE
- City New York
- 0 Strongly Tenant-Friendly · D+34
ZIP-level market 10314
- Rents YoY
- 3.9%
- Active inventory
- 490
- Price-to-rent
- 10.1×
Monthly cashflow live
- Estimated rent
- $3,627 medium interval (Pro) →
- Mortgage (P&I)
- −$2,302
- Tax from tax record
- −$556 /mo · $6,668/yr
- Insurance
- −$183
- HOA
- −$0
- Vacancy / Maint / Mgmt
- −$762
- Net cashflow
- $-176
Break-even live
Sensitivity live
| Price | -10% $73 | -5% $-51 | +0% $-176 | +5% $-300 | +10% $-424 |
|---|---|---|---|---|---|
| Rent | -10% $-462 | -5% $-319 | +0% $-176 | +5% $-32 | +10% $111 |
| Rate | -1.0pp $45 | -0.5pp $-64 | base $-176 | +0.5pp $-289 | +1.0pp $-405 |
UW: 25.0% down · 7.5% · 30yr · 1.5% tax · 5.0% vac · 8.0% maint · 8.0% mgmt
Financing live
Cash to close
- Down payment
- $109,750
- Closing costs
- $13,170
- Reserves months
- —
- Total cash needed
- —
Loan-product check · same deal, 3 products live
Conventional
25% down · 7.5% · 30yr
- Down + closing
- —
- Monthly P&I
- —
- Monthly cashflow
- —
- DSCR
- —
- Eligible?
- —
Personal DTI + credit; lowest rate.
DSCR
20% down · 8.5% · 30yr
- Down + closing
- —
- Monthly P&I
- —
- Monthly cashflow
- —
- DSCR
- —
- Eligible?
- —
No personal income docs; deal must DSCR.
Hard money
10% down · 12.0% · 12mo
- Down + closing
- —
- Monthly P&I
- —
- Monthly cashflow
- —
- DSCR
- —
- Eligible?
- —
Short-term bridge; refi at stabilization.
Rent comps 1 comps
| Address | Beds | Baths | Sqft | Rent | $/sqft | DOM | Units | Dist |
|---|---|---|---|---|---|---|---|---|
| 9 Brunswick St Unit 2 Staten Island, NY | 3.0 | 2.0 | 1600 | $3,300 | $2.06 | 26d | 1 | 0.79mi |
Listing history 12 events
-
2024-08-27status Pending
-
2016-07-02status Pending
-
2016-06-01historical
-
2016-05-17$439,000 Active
-
2016-02-17historical
-
2016-02-17historical
-
2014-11-29historical
-
2007-10-30$474,999
-
2006-10-30$469,000
-
2005-06-09$473,000
-
2004-08-27soldstatus $905,000
-
2004-08-27soldstatus $495,000
ⓘ Source: listings_history table (triggers on properties + properties_extension) + one-shot
backfill from property_details.listing_events for pre-trigger history.
Tax reassessment forecast NY · Partial reset (capped growth)
- Current annual tax
- $6,668 · $556/mo
- Projected year-2 tax
- $7,044 · $587/mo
- Expected delta
- +$375/yr (+$31/mo · 5.6%)
ⓘ Screening estimate from a state-policy table — verify with the county assessor before closing.
Climate risk First Street
- Flood 1/10 Low FEMA zone X (unshaded) · 0% chance over 30 yrs
- Wildfire 4/10 Moderate
- Heat 7/10 Severe 7 d/yr ≥98°F today · 15 d/yr by 30 yrs out
- Wind 6/10 Major 50% chance of damaging wind over 30 yrs
- Air quality 4/10 Moderate 5 unhealthy d/yr today · 6 by 30 yrs out
Nearby sold comps map
Loading sold comps map…
Walkable amenities ~0.75 mi
Loading nearby amenities…
Taxation est. · year 1
- Rental income
- $43,522
- − Mortgage interest
- −$24,591
- − Property taxes
- −$6,668
- − Insurance
- −$2,195
- − Repairs & maintenance
- −$3,482
- − Management
- −$3,482
- − Depreciation
- −$12,771
- Taxable loss
- −$9,667
- Est. tax savings @ 24.0%
- +$2,320
- After-tax cash flow
- $213/yr
For passive investors: Depreciation is non-cash, so a rental often shows a tax loss while cash-flowing — sheltering income. Rental losses are passive: they offset passive income freely, and up to $25,000/yr can offset ordinary (W-2) income if you actively participate and your MAGI is under $100k (phasing out to $0 by $150k); unused losses carry forward. On sale, claimed depreciation is recaptured at up to 25%, and gains may owe capital-gains tax (a 1031 exchange can defer both). Figures are a year-1 estimate at your 24.0% rate — not tax advice; consult a CPA.
Schools (NCES district)
No district data.
Livability — New York
- Score
- 75/100
- State rank
- #268
- US rank
- #4188
Category grades
Schools grade is shown separately in the Schools card above.
Census & demographics
- Census place
- New York, NY
- County
- Richmond County · 404,174 people
- City population
- 7,731,280
- Metro
- New York-Newark-Jersey City, NY-NJ-PA
- Population (ZIP)
- 93,915
- Household income
- $104,613
- Rent vs Own
- Severe rent burden
- 2168.0
Population outlook (Richmond County) Hauer SSP2
- Today (2025)
- 482,784 people
- By 2030
- 481,831 · -0.2%
- By 2040
- 473,159 · -2.0%
- By 2050
- 457,242 · -5.3%
- By 2075
- 408,029 · -15.5%
- By 2100
- 341,459 · -29.3%
Race, ethnicity, and origin ACS 2023
- Neighborhood character
- Diverse neighborhood (Simpson 0.58)
- Race & ethnicity
- White 60% Asian 19% Hispanic / Latino 15% Two or more races 8% Black 4%
- Hispanic origin (detail)
- Mexican 3% Puerto Rican 7% Dominican 1%
- Common ancestry
- Romanian 4% Scotch-Irish 2% Subsaharan African 1%
- Foreign-born
- 28% · Canada, China, South Korea
- Languages at home
- 61% English-only · Spanish 9% Chinese 7% Other Indo-European 7%
Political lean MEDSL · Richmond
- 2024 margin
- Strong R (+29.8) · D 35.1% · R 64.9%
- 2008→2024 swing
- -25.7pp toward R · 2008: -4.0pp · 2024: -29.8pp
- All cycles
- 2024: R+29.8 2020: R+14.9 2016: R+16.8 2012: D+0.8 2008: R+4.0
Not yet ingested
- Civics
- —
Market trends
- HPI YoY
- ▼ -553.73%
- Current HPI
- 378.3872
- Rent YoY
- ▲ 3.93%
- Metro
- New York-Newark-Jersey City, NY-NJ-PA
- State GDP YoY
- ▲ 2.60%
- F500 in state
- 92
Industry mix (Fortune 500 HQ in NY)
| Industry | F500 HQs | Revenue |
|---|---|---|
| Financial Services | 10 | $950B |
|
||
| Consumer Goods | 9 | $162B |
|
||
| Insurance | 4 | $225B |
|
||
| Telecommunications | 2 | $144B |
|
||
| Pharmaceuticals | 2 | $112B |
|
||
| Media / Entertainment | 2 | $69B |
|
||
Price history
-51.5% since first listed12 events — show timeline
- 2024-08-27 Pending — SIBORMLS
- 2016-07-02 Pending — SIBORMLS
- 2016-06-01 Listing Removed — SIBORMLS
- 2016-05-17 Listed $439,000 SIBORMLS
- 2016-02-17 Listing Removed — SIBORMLS
- 2016-02-17 Listing Removed — SIBORMLS
- 2014-11-29 Listing Removed — SIBORMLS
- 2007-10-30 Listed $474,999 SIBORMLS
- 2006-10-30 Listed $469,000 SIBORMLS
- 2005-06-09 Listed $473,000 SIBORMLS
- 2004-08-27 Sold (Public Records) $495,000 Public Records
- 2004-08-27 Sold (Public Records) $905,000 Public Records
Property tax history
+6.4%/yrLatest (2025): $6,668 · +6.0% YoY. Source: county tax records.
Cash-flow waterfall
monthlySold comps — $/sqft
last 12 mo · ≤1 miLoading sold comps…