310 W Tenth St · Johnston City, IL
Flood risk 1/10 · Minimal
- FEMA flood zone
- X (unshaded)
- Chance of flooding over 30 yrs
- 0.0%
- Est. flood insurance / yr
- $507 – $1,088
Fire risk 2/10 · Minimal
- Est. fire insurance / yr
- $804 – $1,492
Heat risk 5/10 · Moderate
- Hot days now (above 107°F)
- 7 days/yr
- Hot days in 30 yrs
- 20 days/yr
Wind risk 2/10 · Minimal
- Chance of severe wind over 30 yrs
- 2.0%
Air-quality risk 2/10 · Minimal
- Unhealthy air days now
- 0 days/yr
- Unhealthy air days in 30 yrs
- 2 days/yr
Risk factors via First Street. Map © Google.
Why this score? — see what drove the B- grade
The composite is a weighted blend of 9 inputs, each scored 0–100. Each bar is that input's sub-score; the figure is the points it added to the 100-point composite (weight × sub-score).
- Cash flow +30.0/30.0
- 1% rule +10.0/10.0
- DSCR +10.0/10.0
- ARV discount +7.5/15.0
- Livability +3.2/5.0
- Rent growth +2.5/5.0
- Condition / age +2.5/5.0
- Schools +1.1/10.0
- Appreciation +0.0/10.0
$49,000
🖨 Deal sheet 📄 Offer letter ✓ Due diligence
Listing remarks
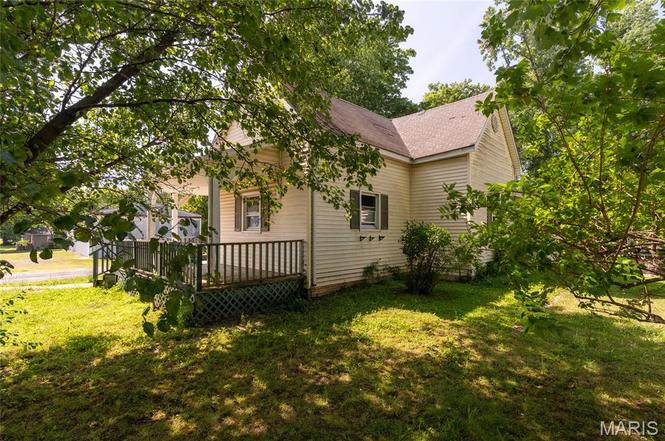
Welcome to 310 W 10th St, Johnston City, IL 62951 — a classic 1930-built single-family home on a spacious 6,945 sq ft lot. This 1,390 sq ft property offers a solid foundation and excellent potential for investors, flippers, or handy homeowners looking to create equity through renovations. While the home needs significant work (cosmetic and possibly mechanical updates), it presents a fantastic blank canvas in an established, quiet neighborhood. Imagine updating the layout, modernizing finishes, and transforming this into a charming, move-in-ready residence or a strong rental property. Key Features:1,390 square feet of living space Built in 1930 with the character of an earlier era Gene
Key facts
- Solid foundation
- Spacious lot
- Convenient location
Tags
Property features AI
Finance
- Other: No home warranty
- Financial info: Tax amount reported for 2024
Exterior
- Utilities: Public water; Public sewer; Electricity available; Electric service: Other
- Home design: Single-family residence; One level
- Construction: Frame construction; Above-grade finished area reported as 1,390 (owner reported)
- Exterior features: Corner lot
Interior
- Bedrooms: Two bedrooms on the main level
- Bathrooms: One full bathroom on the main level
- Heating & cooling: No heating specified; Cooling: Other
- Interior features: Five total rooms
Neighborhood map
What this means for you Summary
Snapshot
- This is a 2-bed/1.0-bath single-family listed at $49k.
Deal economics
- At list price, monthly cash flow is $507 ($6k/yr) — positive.
- The deal already cash-flows at list — no discount required.
- Meets the 1% rule at list price ($1k rent vs $49k).
Location & tenants
- Location reads 64/100 on livability (#670 in IL) — a middle-class / working-renter tenant base. Strengths: cost of living A+, housing A+, crime B+; Watch: amenities F, commute F, employment F.
- Johnston City CUSD 1 (town): math 11% / reading 14% proficiency, ranked #556 of 620 in IL (top 90%) — low school quality limits family demand, transient renter base, plan for 1-2y turnover.
- Zoned schools: Johnston City High School (math 17% / reading 17%, grade F, #430 of 693 statewide, top 66%, 337 students, 0% FRL) — zoned schools average 0% FRL vs 54% district-wide (54 pts lower); this property's tenant base skews higher-income than the district average.
- Market conditions: 26 active listings in the ZIP; 130 units permitted in Williamson County in 2024 (5 in 5+ unit buildings).
Forward outlook
- Local home prices are declining (-3.0%/yr); year-one equity from $339 of loan paydown is wiped out by about $1k of value loss. Plan a longer hold.
- At projected returns (-3.0% appreciation + 3.0% rent growth), your $14k cash investment doubles in ~3 years — after that, you're playing with house money.
Negotiation context
- Only 5 days on market — expect competitive offers; lowballing is unlikely to land.
Risks & watch-outs
- Watch-outs: built in 1950 — expect roof / HVAC / electrical / plumbing capex.
- Climate carrying-cost: extreme-heat days projected 7→20/yr by 2055 (HVAC capex compounding) — expect insurance premiums to compound above CPI over the hold.
Questions for the listing agent
- Built in 1950 — when were the roof, HVAC, electrical panel, plumbing, and water heater last replaced?
- Is there a deadline driving the sale (1031 exchange, divorce, estate, relocation)? That informs how much negotiation room exists.
- Schools are F-rated, which usually means shorter tenancies and higher turnover. Who's the typical renter profile here, and what's been the actual vacancy rate?
- What's the average days-on-market for RENTAL listings here right now (not sales)? A rising rental-DOM trend means longer vacancies and softer asking-rent achievability than the comps imply.
- What's the recent tenant-quality profile in this submarket — average credit score on applications, eviction rate, late-payment / NSF rate, and stable-employment percentage? A property-management company in the area should have these aggregated.
- How much new for-sale + rental construction is in the pipeline within 1–3 miles? Heavy new supply typically softens prices + rents 12–24 months out; constrained supply supports both.
Investment metrics
- 1% rule
- 2.21% ✓
- Cap rate
- 18.70%
- Cash-on-cash
- 44.31%
- DSCR
- 2.97
- GRM
- 3.8
CMA / ARV
- ARV (on-the-fly)
- $161,240
- Comps found
- 12
Show comp detail 12 sales within ~0.75 mi
| Address | Dist | Beds/Ba | Sqft | Sold | Price | $/sf | Match |
|---|---|---|---|---|---|---|---|
| 404 W 9th St | 0.07mi | 3/2.0 (+1) | 1,431 (+3%) | 7mo | $165,800 | $116 | 77 |
| 605 Follis Ave | 0.20mi | 3/2.0 (+1) | 1,344 (-3%) | 5mo | $164,000 | $122 | 72 |
| 110 W 7th St | 0.18mi | 2/1.0 | 1,221 (-12%) | 9mo | $64,500 | $53 | 64 |
| 304 W 10th St | 0.03mi | 3/2.0 (+1) | 1,216 (-12%) | 7mo | $150,000 | $123 | 63 |
| 714 W 5th St | 0.44mi | 2/1.0 | 1,250 (-10%) | 1mo | $130,000 | $104 | 62 |
| 905 Marilyn Dr | 0.50mi | 3/2.0 (+1) | 1,460 (+5%) | 1mo | $187,900 | $129 | 59 |
| 1006 Gent Ave | 0.65mi | 3/1.0 (+1) | 1,380 (-1%) | 10mo | $72,100 | $52 | 55 |
| 1210 Barham Ave | 0.50mi | 3/2.0 (+1) | 1,480 (+6%) | 8mo | $140,000 | $95 | 51 |
| 1304 Hazel St St | 0.64mi | 3/2.0 (+1) | 1,460 (+5%) | 6mo | $190,000 | $130 | 48 |
| 805 W 9th St | 0.40mi | 3/2.0 (+1) | 1,546 (+11%) | 9mo | $50,000 | $32 | 46 |
| 1200 Joy Ln | 0.53mi | 3/2.0 (+1) | 1,500 (+8%) | 9mo | $275,000 | $183 | 46 |
| 1402 Trout Ave | 0.40mi | 3/1.5 (+1) | 1,222 (-12%) | 11mo | $120,000 | $98 | 45 |
Match score weights: distance 35% · size 25% · config 20% · recency 20%. Top-matched comps best support the ARV.
Projected returns pro-forma
-3.0% appreciation · 3.0% rent growth · sell at horizon
- IRR
- 41.3%
- Equity multiple
- 2.77×
- Total profit
- $24,346
- Equity at exit
- $7,306
- IRR
- 47.5%
- Equity multiple
- 5.58×
- Total profit
- $62,838
- Equity at exit
- $4,237
Cash invested: $13,720 (down + closing). Projections, not guarantees.
Landlord ↔ Tenant lean methodology
- Overall (STATE)
- 43 Moderately Tenant-Leaning
- State Illinois
- 43 Moderately Tenant-Leaning · D+7
- County
- — inherits STATE
- City
- — inherits STATE
ZIP-level market 62951
- Home prices YoY
- -25.8%
- Active inventory
- 26
- Price-to-rent
- 3.8×
Monthly cashflow live
- Estimated rent
- $1,084 medium interval (Pro) →
- Mortgage (P&I)
- −$257
- Tax from tax record
- −$72 /mo · $866/yr
- Insurance
- −$20
- HOA
- −$0
- Vacancy / Maint / Mgmt
- −$228
- Net cashflow
- $507
Break-even live
UW: 25.0% down · 7.5% · 30yr · 1.5% tax · 5.0% vac · 8.0% maint · 8.0% mgmt
Financing live
Cash to close
- Down payment
- $12,250
- Closing costs
- $1,470
- Reserves months
- —
- Total cash needed
- —
Loan-product check · same deal, 3 products live
Conventional
25% down · 7.5% · 30yr
- Down + closing
- —
- Monthly P&I
- —
- Monthly cashflow
- —
- DSCR
- —
- Eligible?
- —
Personal DTI + credit; lowest rate.
DSCR
20% down · 8.5% · 30yr
- Down + closing
- —
- Monthly P&I
- —
- Monthly cashflow
- —
- DSCR
- —
- Eligible?
- —
No personal income docs; deal must DSCR.
Hard money
10% down · 12.0% · 12mo
- Down + closing
- —
- Monthly P&I
- —
- Monthly cashflow
- —
- DSCR
- —
- Eligible?
- —
Short-term bridge; refi at stabilization.
Listing history 6 events
-
2026-06-19days on market $49,000 Active 5 DOM
-
2026-06-18days on market $49,000 Active 4 DOM
-
2026-06-17days on market $49,000 Active 3 DOM
-
2026-06-16days on market $49,000 Active 2 DOM
-
2026-06-15remarks 693-char remark
-
2026-06-15$49,000 Active 1 DOM
ⓘ Source: listings_history table (triggers on properties + properties_extension) + one-shot
backfill from property_details.listing_events for pre-trigger history.
Tax reassessment forecast IL · Partial reset (capped growth)
- Current annual tax
- $866 · $72/mo
- Projected year-2 tax
- $989 · $82/mo
- Expected delta
- +$123/yr (+$10/mo · 14.2%)
ⓘ Screening estimate from a state-policy table — verify with the county assessor before closing.
Climate risk First Street
- Flood 1/10 Low FEMA zone X (unshaded) · 0% chance over 30 yrs
- Wildfire 2/10 Low
- Heat 5/10 Major 7 d/yr ≥107°F today · 20 d/yr by 30 yrs out
- Wind 2/10 Low 2% chance of damaging wind over 30 yrs
- Air quality 2/10 Low 0 unhealthy d/yr today · 2 by 30 yrs out
Nearby sold comps map
Loading sold comps map…
Walkable amenities ~0.75 mi
Loading nearby amenities…
Taxation est. · year 1
- Rental income
- $13,004
- − Mortgage interest
- −$2,745
- − Property taxes
- −$866
- − Insurance
- −$245
- − Repairs & maintenance
- −$1,040
- − Management
- −$1,040
- − Depreciation
- −$1,425
- Taxable income
- $5,642
- Est. tax owed @ 24.0%
- −$1,354
- After-tax cash flow
- $4,725/yr
For passive investors: Depreciation is non-cash, so a rental often shows a tax loss while cash-flowing — sheltering income. Rental losses are passive: they offset passive income freely, and up to $25,000/yr can offset ordinary (W-2) income if you actively participate and your MAGI is under $100k (phasing out to $0 by $150k); unused losses carry forward. On sale, claimed depreciation is recaptured at up to 25%, and gains may owe capital-gains tax (a 1031 exchange can defer both). Figures are a year-1 estimate at your 24.0% rate — not tax advice; consult a CPA.
Schools (NCES district)
- District
- Johnston City CUSD 1
- NCES district ID
- 1720550
- Math proficiency
- 11% ▼ -11.00%
- Reading proficiency
- 14% ▼ -6.00%
- Median HH income
- $40,813
- Composite
- 10.81/100
- National rank
- #9765
- State rank
- #556 of 620 in IL
Livability — Johnston City
- Score
- 64/100
- State rank
- #670
- US rank
- #13707
Category grades
Schools grade is shown separately in the Schools card above.
Census & demographics
- Census place
- Johnston City, IL
- City population
- 5,381
- Population (ZIP)
- 5,381
Population outlook (Williamson County) Hauer SSP2
- Today (2025)
- 69,553 people
- By 2030
- 70,090 · +0.8%
- By 2040
- 70,345 · +1.1%
- By 2050
- 69,394 · -0.2%
- By 2075
- 63,590 · -8.6%
- By 2100
- 51,154 · -26.5%
Race, ethnicity, and origin ACS 2023
- Neighborhood character
- Predominantly White (92%)
- Race & ethnicity
- White 92% Two or more races 3% Asian 2% Hispanic / Latino 2%
- Common ancestry
- Romanian 4% Iranian 3% English 2%
- Foreign-born
- 2% · China
- Languages at home
- 98% English-only · Chinese 2%
Political lean MEDSL · Williamson
- 2024 margin
- Solid R (+38.8) · D 30.0% · R 68.8% · Other 1.3%
- 2008→2024 swing
- -24.0pp toward R · 2008: -14.8pp · 2024: -38.8pp
- All cycles
- 2024: R+38.8 2020: R+37.3 2016: R+41.2 2012: R+25.0 2008: R+14.8
Not yet ingested
- Civics
- —
Market trends
- HPI YoY
- ▼ -38.65%
- Current HPI
- 111.1728
- Rent YoY
- —
- Metro
- —
- State GDP YoY
- ▲ 1.59%
- F500 in state
- 60
Industry mix (Fortune 500 HQ in IL)
| Industry | F500 HQs | Revenue |
|---|---|---|
| Insurance | 4 | $201B |
|
||
| Consumer Goods | 4 | $87B |
|
||
| Industrial Machinery | 3 | $64B |
|
||
| Healthcare | 2 | $55B |
|
||
| Retail / Pharmacy | 1 | $148B |
|
||
| Agriculture / Food | 1 | $86B |
|
||
Price history
+15.3% since first listed4 events — show timeline
- 2026-06-14 Price Changed $49,000 MARIS as Distributed by MLS Grid
- 2026-06-14 Listed $42,500 MARIS as Distributed by MLS Grid
- 2021-08-06 Listing Removed — RMLSA as Distributed by MLS Grid
- 2005-09-10 Listing Removed — MRED as Distributed by MLS Grid
Property tax history
+4.5%/yrLatest (2025): $866 · +3.2% YoY. Source: county tax records.
Cash-flow waterfall
monthlySold comps — $/sqft
last 12 mo · ≤1 miLoading sold comps…