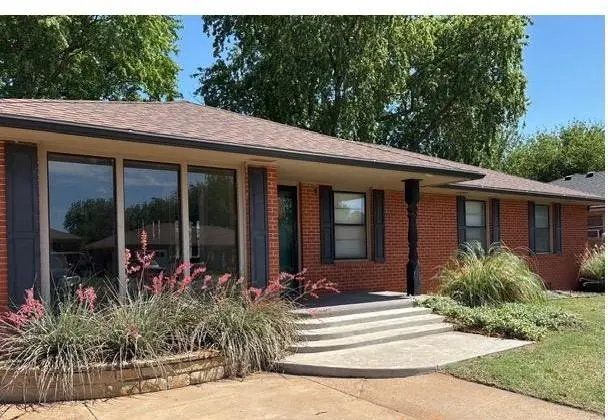
323 Hayden Blvd · Elk City, OK
Flood risk 1/10 · Minimal
- FEMA flood zone
- X
- Chance of flooding over 30 yrs
- 0.0%
- Est. flood insurance / yr
- $435 – $905
Fire risk 3/10 · Minor
- Est. fire insurance / yr
- $2,463 – $4,575
Heat risk 6/10 · Moderate
- Hot days now (above threshold)
- 7 days/yr
- Hot days in 30 yrs
- 20 days/yr
Wind risk No data
- Chance of severe wind over 30 yrs
- —
Air-quality risk No data
- Unhealthy air days now
- —
- Unhealthy air days in 30 yrs
- —
Risk factors via First Street. Map © Google.
Why this score? — see what drove the B- grade
The composite is a weighted blend of 9 inputs, each scored 0–100. Each bar is that input's sub-score; the figure is the points it added to the 100-point composite (weight × sub-score).
- Cash flow +30.0/30.0
- DSCR +10.0/10.0
- 1% rule +9.9/10.0
- ARV discount +7.5/15.0
- Livability +3.2/5.0
- Rent growth +2.5/5.0
- Condition / age +2.5/5.0
- Schools +1.3/10.0
- Appreciation +0.0/10.0
$79,000
🖨 Deal sheet 📄 Offer letter ✓ Due diligence
Listing remarks MLS
Looking for a traditionally styled brick home? This well maintained home's new roof was installed in the fall of 2020. The new HVAC system placed in 2015 promises to keep you comfy in any season! An oversized backyard deck in a shady backyard will be your ticket to relaxation. A cellar is included and accessible from the deck as well. The privacy fence encloses a manageable sized yard with a shed to store your lawn and garden tools. The electric range, vent hood and dishwasher remain in the large kitchen that includes a dining room, but it's definitely BYOR (refrigerator)! The laundry room was once a part of the kitchen and has plenty of storage and room for a sink. A bedroom was opened up to enlarge the living area, but could easily be returned to 3rd bedroom status. The other 2 bedrooms are large and accommodating. Finally, set your bistro set on the front porch for morning coffee and enjoy the graceful, easily navigated steps to your front flower beds. See this home soon!
Key facts
- Brick exterior
- Spacious living area
- Large kitchen
Tags
Property features AI
Finance
- Other: Located in Crestview addition; Living area listed as 1,538 (assessor)
- Financial info: Property being sold as-is; Not assumable
- HOA & community: No mandatory association dues
Exterior
- Parking: Concrete parking
- Security: Below-ground storm shelter
- Utilities: No utilities details provided
- Home design: Single family residence; One-level property; Existing property
- Construction: Brick construction; Composition roof; Conventional foundation
- Exterior features: Covered porch; Interior lot
Interior
- Kitchen: No appliances specified
- Bedrooms: 2 bedrooms
- Bathrooms: 1 full bath and 1 half bath
- Interior features: No fireplace; No built-in appliances listed
- Laundry & utility: No mechanical or laundry features listed
Neighborhood map
What this means for you Summary
Snapshot
- This is a 3-bed/2.0-bath single-family listed at $79k.
Deal economics
- At list price, monthly cash flow is $384 ($5k/yr) — positive.
- The deal already cash-flows at list — no discount required.
- Meets the 1% rule at list price ($1k rent vs $79k).
- Cap rate 12.1% vs local median 4.1% in Elk City — top-decile yield for the area; either an underpriced asset or a hidden risk that comps aren't pricing in. Stress-test before assuming the spread holds.
Location & tenants
- Location reads 65/100 on livability (#141 in OK) — a middle-class / working-renter tenant base. Strengths: cost of living A+, housing A, crime B+; Watch: employment D+, amenities F, commute F.
- Elk City (town): math 14% / reading 15% proficiency, ranked #218 of 270 in OK (top 81%) — low school quality limits family demand, transient renter base, plan for 1-2y turnover.
- Zoned schools: Elk City Es (math 22% / reading 17%, grade F, #479 of 845 statewide, top 63%, 753 students, 0% FRL); Elk City Hs (math 8% / reading 22%, grade F, #332 of 447 statewide, top 78%, 615 students, 0% FRL) — zoned schools average 0% FRL vs 48% district-wide (48 pts lower); this property's tenant base skews higher-income than the district average.
- Market conditions: 122 active listings in the ZIP; 16 units permitted in Beckham County in 2024 (0 in 5+ unit buildings).
Forward outlook
- Local home prices are declining (-3.0%/yr); year-one equity from $546 of loan paydown is wiped out by about $2k of value loss. Plan a longer hold.
- Beckham County population projected at +35% by 2050 — long-run rental-demand tailwind backs the buy-and-hold thesis.
- At projected returns (-3.0% appreciation + 3.0% rent growth), your $22k cash investment doubles in ~6 years — after that, you're playing with house money.
Negotiation context
- Only 2 days on market — expect competitive offers; lowballing is unlikely to land.
- 3 sale attempts since 5y ago with the ask held roughly flat each time — persistent listings suggest the price (not the market) is what's stuck; bring a comps-based counter.
Risks & watch-outs
- Climate carrying-cost: extreme-heat days projected 7→20/yr by 2055 (HVAC capex compounding) — expect insurance premiums to compound above CPI over the hold.
Questions for the listing agent
- Built in 1960 — when were the roof, HVAC, electrical panel, plumbing, and water heater last replaced?
- Is there a deadline driving the sale (1031 exchange, divorce, estate, relocation)? That informs how much negotiation room exists.
- Schools are F-rated, which usually means shorter tenancies and higher turnover. Who's the typical renter profile here, and what's been the actual vacancy rate?
- What's the average days-on-market for RENTAL listings here right now (not sales)? A rising rental-DOM trend means longer vacancies and softer asking-rent achievability than the comps imply.
- What's the recent tenant-quality profile in this submarket — average credit score on applications, eviction rate, late-payment / NSF rate, and stable-employment percentage? A property-management company in the area should have these aggregated.
- How much new for-sale + rental construction is in the pipeline within 1–3 miles? Heavy new supply typically softens prices + rents 12–24 months out; constrained supply supports both.
Investment metrics
- 1% rule
- 1.49% ✓
- Cap rate
- 12.12%
- Cash-on-cash
- 20.81%
- DSCR
- 1.93
- GRM
- 5.6
CMA / ARV
- ARV (on-the-fly)
- $159,952
- Comps found
- 12
Show comp detail 12 sales within ~0.75 mi
| Address | Dist | Beds/Ba | Sqft | Sold | Price | $/sf | Match |
|---|---|---|---|---|---|---|---|
| 406 Mcarthur Blvd | 0.11mi | 3/2.0 | 1,576 (+2%) | 4mo | $170,000 | $108 | 87 |
| 402 Mcarthur Blvd | 0.10mi | 3/2.0 | 1,480 (-4%) | 7mo | $149,000 | $101 | 83 |
| 401 Mcarthur Blvd | 0.08mi | 3/1.0 | 1,396 (-9%) | 5mo | $150,000 | $107 | 73 |
| 155 Blackburn Blvd | 0.38mi | 4/2.0 (+1) | 1,582 (+3%) | 5mo | $165,000 | $104 | 68 |
| 602 N Main St | 0.42mi | 3/2.0 | 1,626 (+6%) | 7mo | $169,900 | $104 | 65 |
| 1101 Colorado Ave | 0.34mi | 2/2.0 (-1) | 1,446 (-6%) | 6mo | $200,000 | $138 | 64 |
| 128 Sunset St | 0.33mi | 3/2.0 | 1,649 (+7%) | 11mo | $145,000 | $88 | 63 |
| 210 Hoover Cir | 0.45mi | 3/3.0 | 1,400 (-9%) | 2mo | $100,000 | $71 | 59 |
| 117 Shell Blvd | 0.39mi | 3/2.0 | 1,692 (+10%) | 8mo | $189,000 | $112 | 59 |
| 820 N Randall Ave | 0.57mi | 2/2.0 (-1) | 1,516 (-1%) | 13mo | $149,500 | $99 | 55 |
| 101 Rowsey | 0.61mi | 3/2.0 | 1,329 (-14%) | 8mo | $158,000 | $119 | 43 |
| 515 N Booth Ave | 0.70mi | 4/1.0 (+1) | 1,334 (-13%) | 8mo | $128,000 | $96 | 30 |
Match score weights: distance 35% · size 25% · config 20% · recency 20%. Top-matched comps best support the ARV.
Projected returns pro-forma
-3.0% appreciation · 3.0% rent growth · sell at horizon
- IRR
- 13.2%
- Equity multiple
- 1.53×
- Total profit
- $11,648
- Equity at exit
- $11,779
- IRR
- 22.1%
- Equity multiple
- 2.88×
- Total profit
- $41,671
- Equity at exit
- $6,830
Cash invested: $22,120 (down + closing). Projections, not guarantees.
Landlord ↔ Tenant lean methodology
- Overall (STATE)
- 83 Strongly Landlord-Friendly
- State Oklahoma
- 83 Strongly Landlord-Friendly · R+20
- County
- — inherits STATE
- City
- — inherits STATE
ZIP-level market 73644
- Home prices YoY
- -24.0%
- Active inventory
- 122
- Price-to-rent
- 5.6×
Monthly cashflow live
- Estimated rent
- $1,174 medium interval (Pro) →
- Mortgage (P&I)
- −$414
- Tax from tax record
- −$96 /mo · $1,155/yr
- Insurance
- −$33
- HOA
- −$0
- Vacancy / Maint / Mgmt
- −$246
- Net cashflow
- $384
Break-even live
UW: 25.0% down · 7.5% · 30yr · 1.5% tax · 5.0% vac · 8.0% maint · 8.0% mgmt
Financing live
Cash to close
- Down payment
- $19,750
- Closing costs
- $2,370
- Reserves months
- —
- Total cash needed
- —
Loan-product check · same deal, 3 products live
Conventional
25% down · 7.5% · 30yr
- Down + closing
- —
- Monthly P&I
- —
- Monthly cashflow
- —
- DSCR
- —
- Eligible?
- —
Personal DTI + credit; lowest rate.
DSCR
20% down · 8.5% · 30yr
- Down + closing
- —
- Monthly P&I
- —
- Monthly cashflow
- —
- DSCR
- —
- Eligible?
- —
No personal income docs; deal must DSCR.
Hard money
10% down · 12.0% · 12mo
- Down + closing
- —
- Monthly P&I
- —
- Monthly cashflow
- —
- DSCR
- —
- Eligible?
- —
Short-term bridge; refi at stabilization.
Listing history 3 events
-
2026-06-18days on market $79,000 Active 2 DOM
-
2026-06-17remarks 560-char remark
-
2026-06-17$79,000 Active 1 DOM
ⓘ Source: listings_history table (triggers on properties + properties_extension) + one-shot
backfill from property_details.listing_events for pre-trigger history.
Tax reassessment forecast OK · Resets to sale price
- Current annual tax
- $1,155 · $96/mo
- Projected year-2 tax
- $1,155 · $96/mo
- Expected delta
- $0/yr ($0/mo · 0.0%)
ⓘ Screening estimate from a state-policy table — verify with the county assessor before closing.
Climate risk First Street
- Flood 1/10 Low FEMA zone X · 0% chance over 30 yrs
- Wildfire 3/10 Moderate
- Heat 6/10 Major
Nearby sold comps map
Loading sold comps map…
Walkable amenities ~0.75 mi
Loading nearby amenities…
Taxation est. · year 1
- Rental income
- $14,082
- − Mortgage interest
- −$4,425
- − Property taxes
- −$1,155
- − Insurance
- −$395
- − Repairs & maintenance
- −$1,127
- − Management
- −$1,127
- − Depreciation
- −$2,298
- Taxable income
- $3,556
- Est. tax owed @ 24.0%
- −$853
- After-tax cash flow
- $3,750/yr
For passive investors: Depreciation is non-cash, so a rental often shows a tax loss while cash-flowing — sheltering income. Rental losses are passive: they offset passive income freely, and up to $25,000/yr can offset ordinary (W-2) income if you actively participate and your MAGI is under $100k (phasing out to $0 by $150k); unused losses carry forward. On sale, claimed depreciation is recaptured at up to 25%, and gains may owe capital-gains tax (a 1031 exchange can defer both). Figures are a year-1 estimate at your 24.0% rate — not tax advice; consult a CPA.
Schools (NCES district)
- District
- Elk City
- NCES district ID
- 4010740
- Math proficiency
- 14% ▼ -11.00%
- Reading proficiency
- 15% ▼ -14.00%
- Median HH income
- $49,040
- Composite
- 13.26/100
- National rank
- #9547
- State rank
- #218 of 270 in OK
Livability — Elk City
- Score
- 65/100
- State rank
- #141
- US rank
- #13090
Category grades
Schools grade is shown separately in the Schools card above.
Census & demographics
- Census place
- Elk City, OK
- City population
- 13,687
- Population (ZIP)
- 13,687
Population outlook (Beckham County) Hauer SSP2
- Today (2025)
- 26,564 people
- By 2030
- 28,217 · +6.2%
- By 2040
- 31,865 · +20.0%
- By 2050
- 35,862 · +35.0%
- By 2075
- 47,189 · +77.6%
- By 2100
- 55,622 · +109.4%
Race, ethnicity, and origin ACS 2023
- Neighborhood character
- Predominantly White (80%)
- Race & ethnicity
- White 80% Hispanic / Latino 15% Two or more races 6% Black 1% Asian 1%
- Hispanic origin (detail)
- Mexican 13%
- Common ancestry
- Iranian 2% Lithuanian 2% Italian 2%
- Foreign-born
- 4% · Canada, China
- Languages at home
- 89% English-only · Spanish 10%
Political lean MEDSL · Beckham
- 2024 margin
- Solid R (+70.1) · D 14.2% · R 84.3% · Other 1.4%
- 2008→2024 swing
- -14.0pp toward R · 2008: -56.1pp · 2024: -70.1pp
- All cycles
- 2024: R+70.1 2020: R+72.0 2016: R+70.8 2012: R+59.1 2008: R+56.1
Not yet ingested
- Civics
- —
Market trends
- HPI YoY
- ▼ -56.11%
- Current HPI
- 178.0217
- Rent YoY
- —
- Metro
- —
- State GDP YoY
- ▲ 1.55%
- F500 in state
- 6
Industry mix (Fortune 500 HQ in OK)
| Industry | F500 HQs | Revenue |
|---|---|---|
| Energy | 3 | $48B |
|
||
Price history
-43.6% since first listed7 events — show timeline
- 2026-06-15 Listed $79,000 MLSOK
- 2022-04-08 Sold (Public Records) $142,000 Public Records
- 2022-04-07 Sold (MLS) $142,000 MLSOK
- 2022-02-20 Pending — MLSOK
- 2022-01-21 Relisted — MLSOK
- 2022-01-13 Pending — MLSOK
- 2021-08-27 Listed $140,000 MLSOK
Property tax history
+9.6%/yrLatest (2025): $1,155 · +10.1% YoY. Source: county tax records.
Cash-flow waterfall
monthlySold comps — $/sqft
last 12 mo · ≤1 miLoading sold comps…