3924 Edgewood Rd · Baltimore, MD
Flood risk 1/10 · Minimal
- FEMA flood zone
- X (unshaded)
- Chance of flooding over 30 yrs
- 0.0%
- Est. flood insurance / yr
- $473 – $860
Fire risk 1/10 · Minimal
- Est. fire insurance / yr
- $755 – $1,403
Heat risk 6/10 · Moderate
- Hot days now (above 104°F)
- 7 days/yr
- Hot days in 30 yrs
- 15 days/yr
Wind risk 6/10 · Moderate
- Chance of severe wind over 30 yrs
- 27.0%
Air-quality risk 3/10 · Minor
- Unhealthy air days now
- 3 days/yr
- Unhealthy air days in 30 yrs
- 4 days/yr
Risk factors via First Street. Map © Google.
Why this score? — see what drove the B- grade
The composite is a weighted blend of 9 inputs, each scored 0–100. Each bar is that input's sub-score; the figure is the points it added to the 100-point composite (weight × sub-score).
- Cash flow +25.5/30.0
- ARV discount +13.9/15.0
- DSCR +8.5/10.0
- 1% rule +7.0/10.0
- Livability +3.8/5.0
- Rent growth +3.1/5.0
- Condition / age +2.5/5.0
- Schools +1.0/10.0
- Appreciation +0.0/10.0
$189,000
🖨 Deal sheet (PDF) 📄 Offer letter ✓ Due diligence
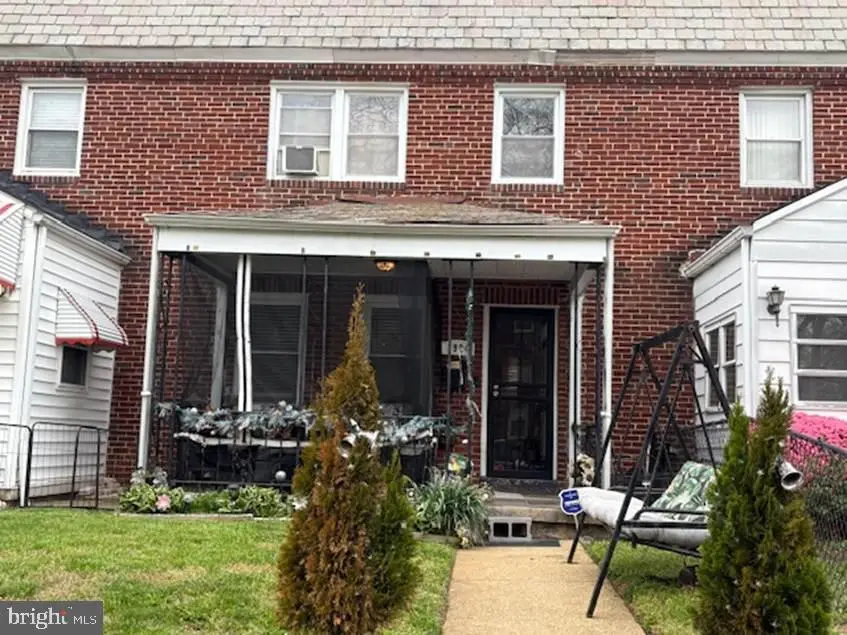
Listing remarks
Discover the possibilities in this spacious 4-bedroom, 2 full-bath home offering character, functionality, and tremendous value for homeowners, investors, and renovation enthusiasts alike. This property features a classic brick garage, welcoming covered front porch, and a cozy rear porch perfect for relaxing and enjoying the outdoors. The fenced front yard and curb appeal. Inside, you'll find generous living space along with a full basement that includes a bedroom, full bathroom, and exterior exit—offering flexibility for extended living arrangements, guest accommodations, or future investment opportunities. Property is being sold As-Is. Home requires repairs and updates. Ideal for i
Key facts
- Covered front porch
- Classic brick garage
- Exterior exit
Tags
Property features AI
Finance
- Other: Ownership is fee simple
Exterior
- Parking: On-street parking
- Utilities: Public water; Public sewer
- Home design: Interior townhouse/rowhouse; Above-grade finished area reported by assessor
- Construction: Brick construction; Stone and concrete perimeter foundation; Other foundation elements noted; Above- and below-grade structures present; Below-grade finished and unfinished areas reported by assessor
- Exterior features: Not in a federal flood zone; Ground rent paid annually; Property located within city limits
Interior
- Bedrooms: Three bedrooms on the upper level; One bedroom on the lower level
- Bathrooms: Two full bathrooms (one on upper level, one on lower level)
- Heating & cooling: Radiator heat fueled by natural gas; Central air conditioning with natural gas cooling fuel
- Interior features: Finished basement with connecting stairway and interior access; Basement has a rear outside entrance; Basement is fully finished and improved; Living area reported by assessor
Neighborhood map
What this means for you Summary
Snapshot
- This is a 4-bed/2.0-bath townhouse listed at $189k.
Deal economics
- At list price, monthly cash flow is $441 ($5k/yr) — positive.
- The deal already cash-flows at list — no discount required.
- Meets the 1% rule at list price ($2k rent vs $189k).
- Cap rate 9.1% vs local median 6.0% in Baltimore — top-decile yield for the area; either an underpriced asset or a hidden risk that comps aren't pricing in. Stress-test before assuming the spread holds.
Location & tenants
- Location reads 76/100 on livability (#90 in MD, #3,396 nationally) — a middle-class / working-renter tenant base. Strengths: amenities A+, commute A+, housing A+; Watch: schools D, crime F.
- Baltimore City Public Schools (urban): math 7% / reading 16% proficiency, ranked #24 of 24 in MD (top 100%) — low school quality limits family demand, transient renter base, plan for 1-2y turnover; 79% free/reduced lunch — lower-income household profile, screen leases tightly.
- Market conditions: Rents rising (+2.4%/yr); 351 active listings in the ZIP; 25 comparable units currently listed for rent nearby; rentals at typical pace (median 25d on market — plan ~3-4 weeks tenant-placement turnaround); 1,273 units permitted in Baltimore city in 2024 (1,104 in 5+ unit buildings).
- At $2,260/mo this rent would consume 53% of the median local household income ($52k/yr) (locally 3644% of renters already pay >50% of income on rent) — very limited rent-growth headroom before tenants either downsize or default.
Forward outlook
- Local home prices are declining (-3.0%/yr); year-one equity from $1k of loan paydown is wiped out by about $6k of value loss. Plan a longer hold.
- Baltimore County population projected to shrink 4% by 2050 — rents likely to lag national; underwrite the cash flow, not the appreciation.
Negotiation context
- Only 8 days on market — expect competitive offers; lowballing is unlikely to land.
- Current owner paid $155k; 22% above their basis — modest negotiation headroom, anchor on the comps not their cost.
Risks & watch-outs
- Watch-outs: built in 1935 — expect roof / HVAC / electrical / plumbing capex.
- Climate carrying-cost: major wind risk, 27% chance of damaging wind over 30y; extreme-heat days projected 7→15/yr by 2055 (HVAC capex compounding) — expect insurance premiums to compound above CPI over the hold.
Questions for the listing agent
- Built in 1935 — when were the roof, HVAC, electrical panel, plumbing, and water heater last replaced?
- Is there a deadline driving the sale (1031 exchange, divorce, estate, relocation)? That informs how much negotiation room exists.
- Schools are D-rated, which usually means shorter tenancies and higher turnover. Who's the typical renter profile here, and what's been the actual vacancy rate?
- Crime grade is F in this area — have there been break-ins, vandalism, or insurance claims at this property in the last 3 years? What carrier currently insures it and at what premium?
- What's the average days-on-market for RENTAL listings here right now (not sales)? A rising rental-DOM trend means longer vacancies and softer asking-rent achievability than the comps imply.
- What's the recent tenant-quality profile in this submarket — average credit score on applications, eviction rate, late-payment / NSF rate, and stable-employment percentage? A property-management company in the area should have these aggregated.
- How much new for-sale + rental construction is in the pipeline within 1–3 miles? Heavy new supply typically softens prices + rents 12–24 months out; constrained supply supports both.
Investment metrics
- 1% rule
- 1.20% ✓
- Cap rate
- 9.10%
- Cash-on-cash
- 10.01%
- DSCR
- 1.45
- GRM
- 7.0
CMA / ARV
- ARV (on-the-fly)
- $220,500
- Comps found
- 12
Show comp detail 12 sales within ~0.75 mi
| Address | Dist | Beds/Ba | Sqft | Sold | Price | $/sf | Match |
|---|---|---|---|---|---|---|---|
| 4027 Annellen Rd | 0.09mi | 4/2.0 | 1,452 (-3%) | 3mo | $220,900 | $152 | 88 |
| 3927 Cedardale Rd | 0.07mi | 3/2.0 (-1) | 1,578 (+5%) | 4mo | $208,000 | $132 | 80 |
| 3911 Bareva Rd | 0.18mi | 4/2.0 | 1,620 (+8%) | 0mo | $112,100 | $69 | 78 |
| 3206 Yosemite Ave | 0.24mi | 3/1.5 (-1) | 1,360 (-9%) | 2mo | $215,000 | $158 | 65 |
| 4023 Reisterstown Rd | 0.35mi | 4/4.0 | 1,400 (-7%) | 2mo | $250,000 | $179 | 63 |
| 2531 Boarman Ave | 0.62mi | 4/2.5 | 1,479 (-1%) | 4mo | $254,000 | $172 | 63 |
| 3635 Wabash Ave | 0.46mi | 3/1.5 (-1) | 1,400 (-7%) | 4mo | $159,000 | $114 | 57 |
| 3951 Boarman Ave | 0.72mi | 4/2.5 | 1,588 (+6%) | 2mo | $249,000 | $157 | 53 |
| 2523 Boarman Ave | 0.64mi | 3/1.0 (-1) | 1,450 (-3%) | 3mo | $82,500 | $57 | 53 |
| 3825 Pall Mall Rd | 0.59mi | 4/2.0 | 1,670 (+11%) | 2mo | $246,000 | $147 | 52 |
| 3635 Columbus Dr | 0.49mi | 3/2.5 (-1) | 1,360 (-9%) | 4mo | $125,000 | $92 | 51 |
| 3741 Boarman Ave | 0.51mi | 3/1.0 (-1) | 1,280 (-15%) | 3mo | $115,000 | $90 | 40 |
Match score weights: distance 35% · size 25% · config 20% · recency 20%. Top-matched comps best support the ARV.
Projected returns pro-forma
-3.0% appreciation · 2.41% rent growth · sell at horizon
- IRR
- -1.9%
- Equity multiple
- 0.93×
- Total profit
- $-3,790
- Equity at exit
- $28,181
- IRR
- 7.1%
- Equity multiple
- 1.52×
- Total profit
- $27,724
- Equity at exit
- $16,341
Cash invested: $52,920 (down + closing). Projections, not guarantees.
Landlord ↔ Tenant lean methodology
- Overall (CITY)
- 12 Strongly Tenant-Friendly
- State Maryland
- 27 Tenant-Leaning · D+14
- County
- — inherits STATE
- City Baltimore
- 12 Strongly Tenant-Friendly · D+58
ZIP-level market 21215
- Rents YoY
- 2.4%
- Active inventory
- 351
- Price-to-rent
- 7.0×
Monthly cashflow live
- Estimated rent
- $2,260 high interval (Pro) →
- Mortgage (P&I)
- −$991
- Tax from tax record
- −$274 /mo · $3,287/yr
- Insurance
- −$79
- HOA
- −$0
- Vacancy / Maint / Mgmt
- −$475
- Net cashflow
- $441
Break-even live
Sensitivity live
| Price | -10% $548 | -5% $495 | +0% $441 | +5% $388 | +10% $334 |
|---|---|---|---|---|---|
| Rent | -10% $263 | -5% $352 | +0% $441 | +5% $531 | +10% $620 |
| Rate | -1.0pp $537 | -0.5pp $489 | base $441 | +0.5pp $392 | +1.0pp $343 |
UW: 25.0% down · 7.5% · 30yr · 1.5% tax · 5.0% vac · 8.0% maint · 8.0% mgmt
Financing live
Cash to close
- Down payment
- $47,250
- Closing costs
- $5,670
- Reserves months
- —
- Total cash needed
- —
Loan-product check · same deal, 3 products live
Conventional
25% down · 7.5% · 30yr
- Down + closing
- —
- Monthly P&I
- —
- Monthly cashflow
- —
- DSCR
- —
- Eligible?
- —
Personal DTI + credit; lowest rate.
DSCR
20% down · 8.5% · 30yr
- Down + closing
- —
- Monthly P&I
- —
- Monthly cashflow
- —
- DSCR
- —
- Eligible?
- —
No personal income docs; deal must DSCR.
Hard money
10% down · 12.0% · 12mo
- Down + closing
- —
- Monthly P&I
- —
- Monthly cashflow
- —
- DSCR
- —
- Eligible?
- —
Short-term bridge; refi at stabilization.
Rent comps 25 comps
| Address | Beds | Baths | Sqft | Rent | $/sqft | DOM | Units | Dist |
|---|---|---|---|---|---|---|---|---|
| 4037 Cedardale Rd Baltimore, MD | 5.0 | 3.0 | 1500 | $2,800 | $1.87 | 15d | 1 | 0.13mi |
| 3204 Sequoia Ave Baltimore, MD | 4.0 | 2.5 | 1791 | $2,600 | $1.45 | 44d | 1 | 0.27mi |
| 4230 Towanda Ave Baltimore, MD | 3.0 | 2.0 | 1400 | $1,800 | $1.29 | 18d | 1 | 0.33mi |
| 3822 Pall Mall Rd Baltimore, MD | 3.0 | 1.5 | 1320 | $1,875 | $1.42 | 44d | 1 | 0.58mi |
| 2619 Loyola Northway Baltimore, MD | 3.0 | 2.0 | 1400 | $1,995 | $1.43 | 24d | 1 | 0.63mi |
| 3784 Columbus Dr Baltimore, MD | 4.0 | 2.0 | 1250 | $2,200 | $1.76 | 24d | 1 | 0.66mi |
| 2415 Loyola Southway Baltimore, MD | 3.0 | 1.5 | 1200 | $2,033 | $1.69 | 44d | 1 | 0.72mi |
| 2915 Oakford Ave Baltimore, MD | 3.0 | 2.0 | 1102 | $1,600 | $1.45 | 18d | 1 | 0.73mi |
| 2454 W Cold Spring Ln Baltimore, MD | 3.0 | 1.0 | 1200 | $1,650 | $1.38 | 24d | 1 | 0.78mi |
| 4704 Pimlico Rd Baltimore, MD | 3.0 | 1.5 | 2006 | $1,800 | $0.90 | 24d | 1 | 0.93mi |
| 2305 Wichita Ave Unit 1 Baltimore, MD | 3.0 | 1.0 | 1950 | $1,300 | $0.67 | 24d | 1 | 1.00mi |
| 2910 Reisterstown Rd Baltimore, MD | 1.0–3.0 | 1.0 | 950 | $1,414 | $1.49 | 15d | 4 | 1.07mi |
| 3028 Hanlon Ave Baltimore, MD | 3.0 | 2.0 | 1200 | $1,711 | $1.43 | 24d | 1 | 1.09mi |
| 3632 Parkdale Ave Baltimore, MD | 3.0 | 1.0 | 1400 | $3,000 | $2.14 | 44d | 1 | 1.13mi |
| 3104 Tioga Pkwy Baltimore, MD | 3.0 | 2.0 | 1640 | $2,050 | $1.25 | 22d | 1 | 1.14mi |
| 5115 Pembridge Ave Baltimore, MD | 3.0 | 2.0 | 1088 | $2,150 | $1.98 | 44d | 1 | 1.31mi |
| 3030 Windsor Ave Baltimore, MD | 4.0 | 1.5 | 2124 | $1,995 | $0.94 | 5d | 1 | 1.35mi |
| 4320 Roland Heights Ave Baltimore, MD | 3.0 | 2.5 | 1800 | $3,300 | $1.83 | 18d | 1 | 1.37mi |
| 4322 Roland Heights Ave Baltimore, MD | 3.0 | 3.0 | 1800 | $3,000 | $1.67 | 44d | 1 | 1.37mi |
| 2001 W Cold Spring Ln Baltimore, MD | 1.0–3.0 | 1.0–2.0 | 1154 | $3,505 | $3.04 | 2d | 31 | 1.37mi |
| 3904 Gwynns Falls Pkwy Baltimore, MD | 3.0 | 2.0 | 1772 | $2,600 | $1.47 | 44d | 1 | 1.38mi |
| 5306 Ethelbert Ave Baltimore, MD | 5.0 | 2.5 | 1510 | $3,000 | $1.99 | 5d | 1 | 1.40mi |
| 4319 Medfield Ave Baltimore, MD | 3.0 | 2.5 | 1800 | $3,100 | $1.72 | 44d | 1 | 1.42mi |
| 2812 Clifton Ave Baltimore, MD | 3.0 | 1.5 | 1650 | $1,850 | $1.12 | 44d | 1 | 1.43mi |
| 2917 Clifton Ave Baltimore, MD | 4.0 | 4.0 | 1700 | $2,150 | $1.26 | 24d | 1 | 1.46mi |
Listing history 6 events
-
2026-06-18days on market $189,000 Coming Soon 8 DOM
-
2026-06-17days on market $189,000 Coming Soon 7 DOM
-
2026-06-16days on market $189,000 Coming Soon 6 DOM
-
2026-06-15days on market $189,000 Coming Soon 5 DOM
-
2026-06-13remarks 693-char remark
-
2026-06-13$189,000 Coming Soon 3 DOM
ⓘ Source: listings_history table (triggers on properties + properties_extension) + one-shot
backfill from property_details.listing_events for pre-trigger history.
Tax reassessment forecast MD · Partial reset (capped growth)
- Current annual tax
- $3,287 · $274/mo
- Projected year-2 tax
- $3,287 · $274/mo
- Expected delta
- $0/yr ($0/mo · 0.0%)
ⓘ Screening estimate from a state-policy table — verify with the county assessor before closing.
Climate risk First Street
- Flood 1/10 Low FEMA zone X (unshaded) · 0% chance over 30 yrs
- Wildfire 1/10 Low
- Heat 6/10 Major 7 d/yr ≥104°F today · 15 d/yr by 30 yrs out
- Wind 6/10 Major 27% chance of damaging wind over 30 yrs
- Air quality 3/10 Moderate 3 unhealthy d/yr today · 4 by 30 yrs out
Nearby sold comps map
Loading sold comps map…
Walkable amenities ~0.75 mi
Loading nearby amenities…
Taxation est. · year 1
- Rental income
- $27,117
- − Mortgage interest
- −$10,587
- − Property taxes
- −$3,287
- − Insurance
- −$945
- − Repairs & maintenance
- −$2,169
- − Management
- −$2,169
- − Depreciation
- −$5,498
- Taxable income
- $2,461
- Est. tax owed @ 24.0%
- −$591
- After-tax cash flow
- $4,706/yr
For passive investors: Depreciation is non-cash, so a rental often shows a tax loss while cash-flowing — sheltering income. Rental losses are passive: they offset passive income freely, and up to $25,000/yr can offset ordinary (W-2) income if you actively participate and your MAGI is under $100k (phasing out to $0 by $150k); unused losses carry forward. On sale, claimed depreciation is recaptured at up to 25%, and gains may owe capital-gains tax (a 1031 exchange can defer both). Figures are a year-1 estimate at your 24.0% rate — not tax advice; consult a CPA.
Schools (NCES district)
- District
- Baltimore City Public Schools
- NCES district ID
- 2400090
- Math proficiency
- 7% ▼ -9.00%
- Reading proficiency
- 16% ▼ -5.00%
- Median HH income
- $42,108
- Composite
- 10.08/100
- National rank
- #9805
- State rank
- #24 of 24 in MD
Livability — Baltimore
- Score
- 76/100
- State rank
- #90
- US rank
- #3396
Category grades
Schools grade is shown separately in the Schools card above.
Census & demographics
- Census place
- Baltimore, MD
- County
- Baltimore City · 558,601 people
- City population
- 588,727
- Metro
- Baltimore-Columbia-Towson, MD
- Population (ZIP)
- 52,229
- Household income
- $51,587
- Rent vs Own
- Severe rent burden
- 3644.0
Population outlook (Baltimore County) Hauer SSP2
- Today (2025)
- 624,249 people
- By 2030
- 621,541 · -0.4%
- By 2040
- 609,756 · -2.3%
- By 2050
- 597,249 · -4.3%
- By 2075
- 552,236 · -11.5%
- By 2100
- 513,934 · -17.7%
Race, ethnicity, and origin ACS 2023
- Neighborhood character
- Predominantly Black (73%)
- Race & ethnicity
- Black 73% White 17% Hispanic / Latino 5% Two or more races 4% Asian 1%
- Common ancestry
- Scotch-Irish 2% Romanian 2% Italian 1%
- Foreign-born
- 9% · Canada, South Korea
- Languages at home
- 91% English-only · Spanish 4% French/Haitian/Cajun 1% Other Indo-European 1%
Political lean MEDSL · Baltimore
- 2024 margin
- Solid D (+73.0) · D 85.2% · R 12.2% · Other 2.6%
- 2008→2024 swing
- -2.5pp toward R · 2008: 75.5pp · 2024: 73.0pp
- All cycles
- 2024: D+73.0 2020: D+76.6 2016: D+74.6 2012: D+76.4 2008: D+75.5
Not yet ingested
- Civics
- —
Market trends
- HPI YoY
- ▼ -318.58%
- Current HPI
- 291.4926
- Rent YoY
- ▲ 2.41%
- Metro
- Baltimore-Columbia-Towson, MD
- State GDP YoY
- ▲ 2.97%
- F500 in state
- 12
Industry mix (Fortune 500 HQ in MD)
| Industry | F500 HQs | Revenue |
|---|---|---|
| Aerospace / Defense | 1 | $71B |
|
||
| Utilities | 1 | $25B |
|
||
| Hotels | 1 | $24B |
|
||
| Consumer Goods | 1 | $7B |
|
||
| Real Estate | 1 | $6B |
|
||
| Chemicals | 1 | $2B |
|
||
Price history
+278.0% since first listed5 events — show timeline
- 2026-06-10 Coming Soon $189,000 BRIGHT MLS
- 2011-01-05 Sold (Public Records) $155,000 Public Records
- 2011-01-05 Sold (Public Records) $155,000 Public Records
- 2011-01-05 Sold (Public Records) $155,000 Public Records
- 2010-03-19 Sold (Public Records) $50,000 Public Records
Property tax history
+2.0%/yrLatest (2025): $3,287 · +4.7% YoY. Source: county tax records.
Cash-flow waterfall
monthlySold comps — $/sqft
last 12 mo · ≤1 miLoading sold comps…